Back to Journals » Neuropsychiatric Disease and Treatment » Volume 15
Durability of symptomatic responses obtained with adjunctive vagus nerve stimulation in treatment-resistant depression
Authors Kumar A, Bunker MT, Aaronson ST, Conway CR, Rothschild AJ, Mordenti G ![]() , Rush AJ
, Rush AJ ![]()
Received 1 December 2018
Accepted for publication 22 January 2019
Published 13 February 2019 Volume 2019:15 Pages 457—468
DOI https://doi.org/10.2147/NDT.S196665
Checked for plagiarism Yes
Review by Single anonymous peer review
Peer reviewer comments 3
Editor who approved publication: Dr Roger Pinder
Arun Kumar,1 Mark T Bunker,1 Scott T Aaronson,2 Charles R Conway,3 Anthony J Rothschild,4,5 Giacomo Mordenti,6 Augustus J Rush7,8
1LivaNova USA PLC, Houston, TX, USA; 2Department of Clinical Research, Sheppard Pratt Health System, Baltimore, MD, USA; 3Department of Psychiatry, Washington University School of Medicine in St Louis, St Louis, MO, USA; 4Department of Psychiatry, University of Massachusetts Medical School, Worcester, MA, USA; 5Department of Psychiatry, UMass Memorial Medical Center, Worcester, MA, USA; 6LivaNova PLC, London, UK; 7Department of Psychiatry and Behavioral Sciences, National University of Singapore, Singapore; 8Department of Psychiatry and Behavioral Sciences, Duke University School of Medicine, Durham, NC, USA
Objective: To compare the durations of response achieved with adjunctive vagus nerve stimulation (VNS + TAU) vs treatment as usual (TAU) alone in treatment-resistant depression (TRD) over a 5-year period in the TRD registry.
Materials and methods: Data from 271 participants on TAU and 328 participants on VNS + TAU were analyzed. Response was defined as ≥50% decrease in baseline Montgomery–Åsberg Depression Rating Scale (MADRS) score at postbaseline visit and was considered retained until the decrease was <40%. MADRS was obtained quarterly in year 1 and biannually thereafter. Time-to-events were estimated using Kaplan–Meier method and compared using log-rank test. HR was estimated using Cox proportion hazard model.
Results: In the VNS + TAU arm, 62.5% (205/328) of participants had a first response over 5 years compared with 39.9% (108/271) in TAU. The time to first response was significantly shorter for VNS + TAU than for TAU (P<0.01). For responders in the first year, median time to relapse from first response was 10.1 months (Q1=4.2, Q3=31.5) for VNS + TAU vs 7.3 months (Q1=3.1, Q3=17.6) for TAU (P<0.01). HR=0.6 (95% CI: 0.4, 0.9) revealed a significantly lower chance for relapse in VNS + TAU. Probability of retaining first response for a year was 0.39 (0.27, 0.51) for TAU and 0.47 (0.38, 0.56) for VNS + TAU. Timing of the onset of the response did not impact the durability of the response.
Conclusion: VNS therapy added to TAU in severe TRD leads to rapid onset and higher likelihood of response, and a greater durability of the response as compared to TAU alone.
Keywords: depressive disorder, treatment-resistant depression, vagus nerve stimulation, longitudinal study, durability of response
Introduction
Two major clinical challenges are encountered in the management of patients suffering from depression whether they are treatment resistant or not. First, there is the challenge of obtaining complete symptomatic remission in the acute treatment phase. With more failed treatments, the probability of remission in the acute phase decreases.1,2 The second challenge focuses on the maintenance of the optimal symptomatic benefit once achieved in the acute treatment phase, that is, the prevention of relapse (a return of the current episode) or recurrence (onset of a new episode).3,4 The Sequenced Treatment Alternatives to Achieve Remission in Depression (STAR-D) trial found that relapse rates were higher in participants whose depression had failed to benefit adequately from a large number of prior acute phase treatment trials (ie, they were rated as having a greater level of “treatment resistance”).1 These two challenges – obtaining remission or at least a response, and then sustaining that benefit over time – are central challenges in long-term depression management. This issue is even more pronounced in patients with higher levels of treatment resistance.
Vagus nerve stimulation (VNS) therapy entails the use of an implantable device in persons with severe treatment-resistant depression (TRD).5,6 VNS is used as an adjunct or “add-on” treatment to ongoing medication treatment (typically antidepressant or mood stabilizing agents or other “augmenting” agents), in persons with TRD. The standard threshold for defining TRD in the VNS trials is failure of four adequate prior antidepressant treatments, although there is currently not a complete consensus on the required number of medication failures.7 Several reports have found either an earlier or more frequent benefit (in both response or remission rates) with VNS when added to treatment as usual (TAU) as compared to TAU alone.5,6,8,9 However, the appearance of symptom benefit is not realized for all participants within the first 3 months of initiating VNS.5,6,8
Most participants who responded during the pilot and pivotal VNS TRD studies showed durable clinical benefit.8,10–12 For early responders, 63%–72% showed substantial clinical benefit at 12 months, and these rates were 61%–77% at 24 months. Likewise, 65%–79% of late responders showed substantial clinical benefit at 24 months.13 Berry et al found that for VNS + TAU, among participants who achieved response at 24 weeks as per the Montgomery–Åsberg Depression Rating Scale (MADRS), 153 (153/217=71%) had a sustained response at 48 weeks.9,14 Additionally, of the 104 participants in the VNS + TAU group evaluated at 96 weeks, 70 (70/104=67%) had a sustained MADRS response.
None of the present publications have examined the long-term durability (up to 4 years) of the VNS-associated antidepressant responses and how a participant’s response is affected by the timing of the onset of the response (ie, do “early” responders stay well longer/shorter than “late responders”). Also, if participants lose their first response, what is the chance of achieving another response and how durable are those responses? We take advantage of a large, nonrandomized comparison between participants receiving treatment as usual (TAU) plus VNS as compared to those receiving TAU alone to answer these questions.6
Aims of the study
We aimed to determine if duration of TRD first response was more sustained in patients receiving VNS + TAU vs TAU alone. We also aimed to determine if there is a correlation between the time at which the first response occurs and the durability of the response in the VNS + TAU treatment group. A third exploratory questions was also addressed: In those TRD patients who respond, and then subsequently relapse, do the two treatments groups differ in the likelihood of a second response, time to second response, or durability of the second response?
Materials and methods
Study population
Participants were part of a Food and Drug Administration-required registry of TRD patients followed for 5 years. The eligibility criteria for the TRD registry are detailed elsewhere.6,15 Briefly, participants had to be 18 years of age or older and experiencing a major depressive episode (MDE) of 2 years or longer in duration (either unipolar or bipolar depression) or have a history of at least three MDEs including the current depressive episode and a life-time history of inadequate response to four or more adequate antidepressant treatments (dosage per Physicians’ Desk Reference labeling for a minimum of 4 weeks), which could include electroconvulsive therapy (ECT). Participants could not have a history of psychotic disorder or rapid-cycling bipolar disorder, or psychotic features in the present MDE (ClinicalTrials.gov Identifier: NCT00320372).
Study treatment
Before enrollment into the TRD registry, participants (except for VNS participants who were in the previously reported flexible dose study and were rolled over into the TRD registry study; note that these participants were excluded from the analysis in this article) were allowed to select the treatment arm of their choice.5 Some participants could be assigned to receive the alternate treatment by the site for various reasons, including availability of surgical implantation at a site, number of allocated slots for implantation, or failure to qualify for insurance reimbursement for VNS therapy implantation. Device implantation surgery and related medical care were covered either by a participant’s insurance policy or from personal funds.
Participants in the VNS + TAU arm underwent implantation during visit 2 (baseline). Postbaseline follow-up visits for all participants were conducted at 3, 6, 9, 12, 18, 24, 30, 36, 42, 48, 54, and 60 months. Data were collected on medical status, adjustment of mood disorder therapy (as needed in the judgment of the clinician), concomitant treatments (with no restrictions on concomitant treatments in this observational registry), and assessment of depressive symptom severity (MADRS, administered by offsite blinded central raters), as well as, the self-rated Quick Inventory of Depressive Symptomatology-Self Report and the Clinical Global Impression scale.16–18
Statistical analysis
Of the 494 participants in the VNS + TAU arm reported in Aaronson et al, 159 participants who had “crossed over” from VNS treatment in the previously reported flexible dose study were excluded, as most of these subjects had only 1 year of consistent follow-up data and our study aimed to understand long-term retention of the response.5,6 In addition, the analysis excluded participants who had a baseline MADRS score of <10 as it indicated that they were already remitted from their MDE prior to initiation of treatment; this excluded n=2 from VNS + TAU and n=5 from TAU alone.19 After the above exclusions and then only including the participants in the intention-to-treat population yielded a total of 328 participants in VNS + TAU group and 271 participants in TAU group. Note that participants who were crossed over to another arm during the study were censored at the last visit before crossover.
Analyses
A time-to-event analysis was conducted for the data as follows:
- Time to first response was defined as the time from baseline to the first visit with reduction in MADRS score of ≥50% compared to baseline. Note that similar analysis was done in Aaronson et al.6 However, since our sample is different, we repeated the analysis to understand whether trend observed in Aaronson et al is maintained in this sample.6
- Duration of first response as per MADRS was defined as the time from first response to the first visit when reduction in MADRS score was <40% compared to baseline. Similar to Sackeim et al, the criterion for maintenance of response at the follow-up time points was reduced to an improvement of at least 40% relative to baseline to avoid characterizing a minor decrease (eg, from 51% to 49%) as loss of benefit.13 A MADRS score drop of <40% constituted a clinically meaningful loss of treatment response, hereafter called “relapse”. Note that only participants who achieved first response within the first year of starting treatment in the registry were included in this analysis. These participants could have potentially been followed-up for 4 years and hence provided a reasonable sample to assess the long-term durability of first response.
- Time to second response was the time from the first relapse to the subsequent visit when reduction in MADRS score was ≥50% compared to baseline. This analysis was conducted only for those participants who responded within the first year and had relapsed after their initial response.
- Duration of second response was defined as the time from a second response to a visit when reduction in MADRS score was <40% compared to baseline. Only first year responders who relapsed from their first response and had a second response were included in this analysis.
For all the above data, a probability of time to event was estimated using Kaplan–Meier (KM) method. KM plots along with the number of participants at risk at periodic time points are provided. KM probability estimates for the time to event with 95% CI at month 3, 6, 9, and 12 are provided. Time to event curves for the two treatment arms were compared using log-rank test. A Cox proportion hazards model was used to estimate the HR (and 95% CI) of the instantaneous chance of a participant having an event in the VNS + TAU arm compared to the TAU arm, at any given time during follow-up.
We evaluated the impact of the timing when the first response occurred (eg, at 3-, 6-, 9-, or 12-month visits) on the durability of first response for the VNS + TAU arm. A KM plot for the time to relapse from the first response (that occurred in first year) is provided by visit when first response occurred.
Missing data imputation
We imputed one or two consecutive missing data with the average of the two adjacent nonmissing data. No imputation was done for three or more consecutive missing data. After imputation, participants were censored at the last visit with nonmissing data for all the analysis. Thus, we had total 2,343 visits with data for TAU participants and 2,991 visits with data for VNS + TAU participants in the censored data set. Imputation for a single missed data point in the censored data set was done for 146 visits (146/2,343, ie, 6.2% of all available data) for TAU participants and for 199 visits (199/2,991, ie, 6.7% of all available data) for VNS + TAU participants. Imputation for two consecutive missing data points was done for 82 visits (82/2,343, ie, 3.5% of all available data) for TAU participants and for 106 visits (106/2,991, ie, 3.5% of all available data) for VNS + TAU participants. Overall there were 228 imputed data (228/2,343, ie, 9.7% of all available data) in TAU arm and 305 imputed data (305/2,991, ie, 10.2% of all available data) in VNS + TAU arm.
The imputation method maintains the pattern of response status regardless of what threshold is used to define a new response or maintenance of a response. That is, if a patient has a response at the adjacent visits then the imputation will give a response at the missed visit. Similarly, if a patient had no response at the adjacent visits, then the imputation will give a no-response at the missed visit. Only when responses are different at the adjacent visits then an imputed response at a missed visit could thus have prolonged a response maintenance (if pattern is [response, missed visits, no-response]) or could have given an earlier response (if pattern is [no-response, missed visits, response]). Otherwise imputation favors only the treatment arm that has more missing data with adjacent responses, which is indeed desirable.
We provide additional summary below about the imputed censored data set to show that imputation could not have altered the result substantially in favor of any of the treatment arms unless a treatment arm has more missing data with adjacent responses. When response is defined as reduction of MADRS score of ≥50%, the censored data set has a regular response pattern, ie, either response or no-response at both the adjacent visits around the one missing data 74.7% for TAU and 62.3% for VNS + TAU, and around two consecutive missing data 90.2% for TAU and 86.8% for VNS + TAU. Thus, occurrence of first or second response could have been altered due to imputation, only for 1.91% of the censored data for TAU arm and 2.97% of censored data in VNS + TAU arm. Similarly, when response is defined as reduction of MADRS score of ≥40%, the censored data set provided a regular response pattern around one missing data 67.1% for TAU and 55.3% for VNS + TAU, and around two consecutive missing data 85.4% for TAU and 81.1% for VNS + TAU. Thus, prolongation of the response maintenance could have occurred only for 3.49% of the censored data in VNS + TAU arm and 2.56% of the censored data in the TAU arm. Given the small percentage of data that could have an altered response pattern due to imputation and noting that not all alterations in the response pattern are favorable, we conclude that the imputation method would work reasonably well for this data set.
Results
Sample demographics and disease characteristics
The analysis population included 328 participants in the VNS + TAU arm and 271 participants in the TAU arm. Baseline demographic characteristics and clinical information for the analysis population are provided in Table 1.
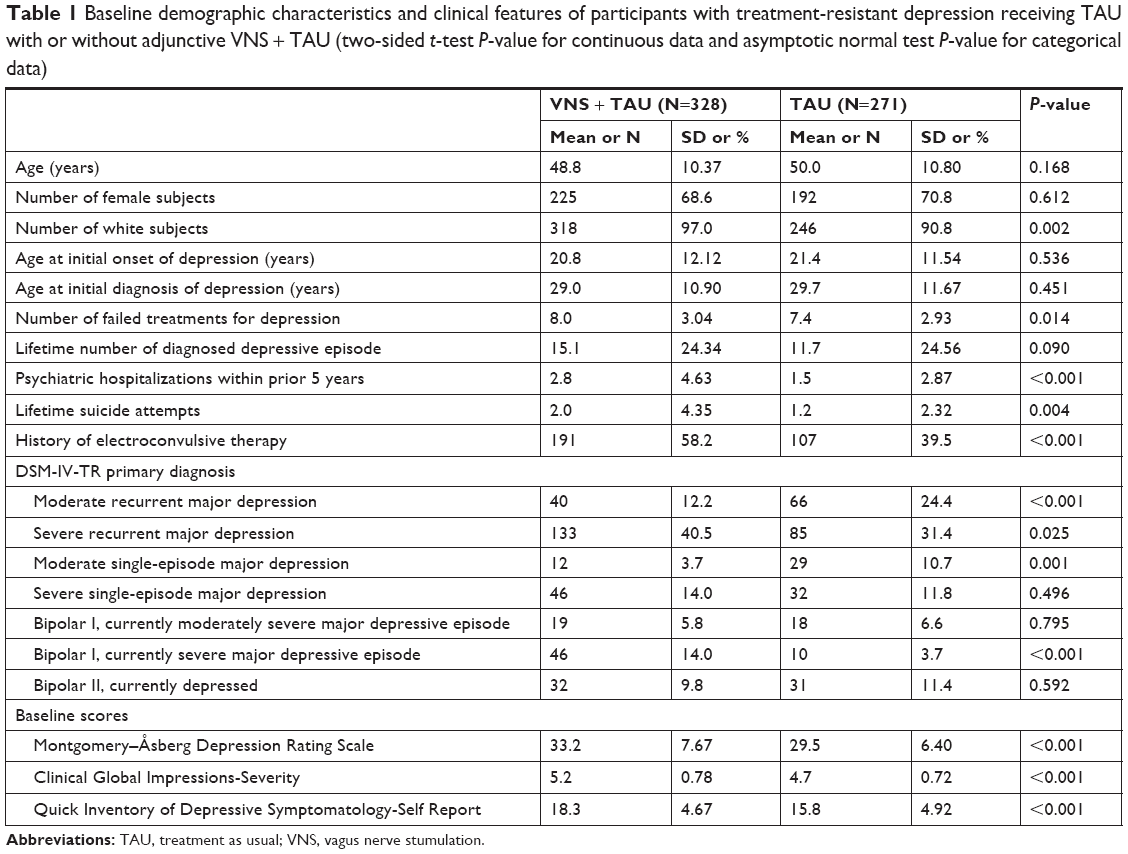 | Table 1 Baseline demographic characteristics and clinical features of participants with treatment-resistant depression receiving TAU with or without adjunctive VNS + TAU (two-sided t-test P-value for continuous data and asymptotic normal test P-value for categorical data) |
- In persons with TRD, does VNS + TAU differ from TAU alone in regard to the onset of response (defined by at least a 50% reduction in baseline MADRS) and cumulative response rate over time?
In a similar data set, VNS + TAU demonstrated greater cumulative first onset of antidepressant response.6 A similar analysis was performed here to confirm if the trends are maintained in this sample. Overall, 62.5% (205/328) of participants in the VNS + TAU arm had a first response during the entire follow-up, compared to 39.9% (108/271) of participants in the TAU arm. The KM plot of time to first response shows that the time to first response was significantly shorter for VNS + TAU than for TAU alone (P<0.01 for log-rank test) (Figure 1) and the estimated cumulative probability for the time to first response is higher for VNS + TAU participants compared to TAU participants over the majority of the follow-up period (Table 2). Median time to the first response was 18.1 months (Q1=6.9, Q3=49.1) for VNS + TAU participants compared to 49.1 months (Q1=12.3, Q3=not estimable) for TAU participants. HR for time to first response for VNS + TAU compared to TAU was 2.0 (95% CI: 1.6, 2.5) meaning a statistically significantly larger chance for a VNS + TAU participant to get a first response compared to TAU participants at any given time during the follow-up.
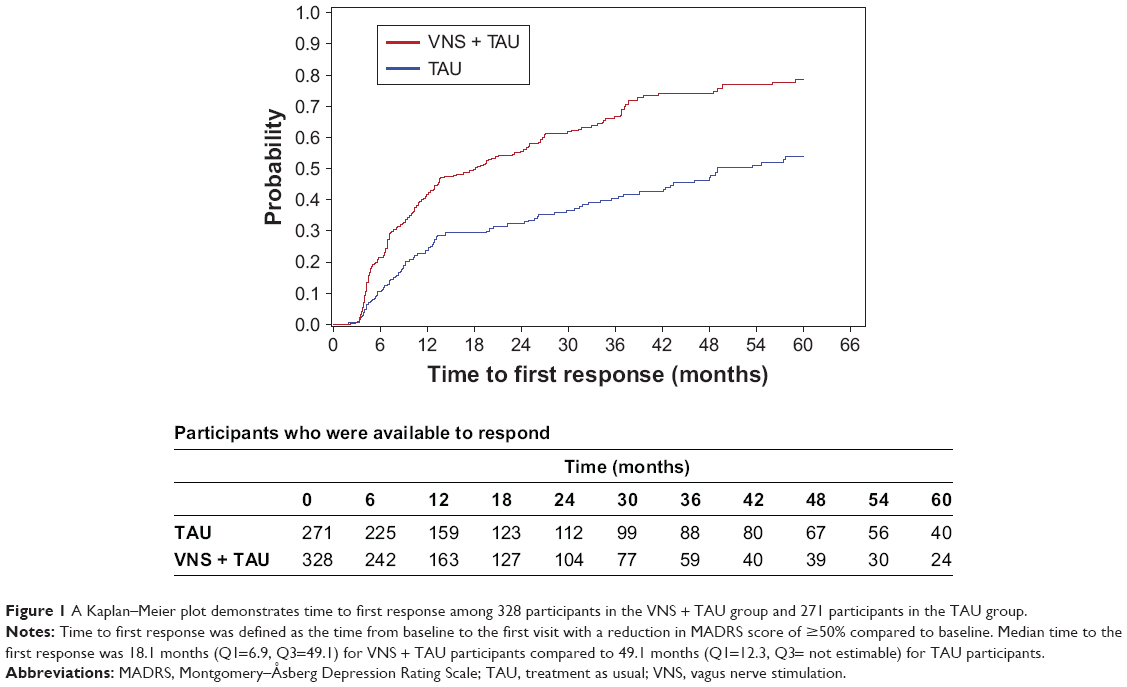 | Figure 1 A Kaplan–Meier plot demonstrates time to first response among 328 participants in the VNS + TAU group and 271 participants in the TAU group. |
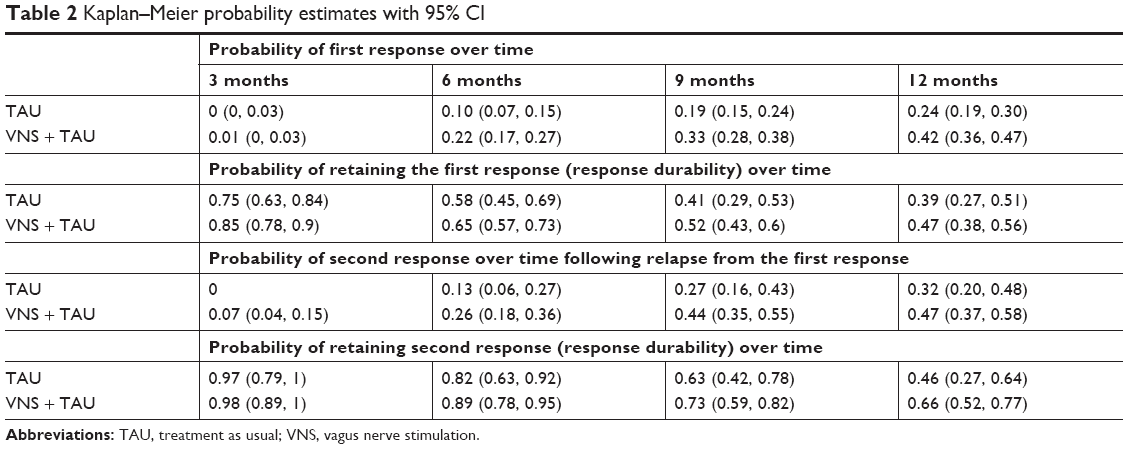 | Table 2 Kaplan–Meier probability estimates with 95% CI |
- In individuals who achieve a first response, does VNS + TAU differ from TAU alone in regard to the duration of the response (defined a priori as maintenance of at least a 40% reduction from baseline MADRS)?
A total of 148 (148/205=72.2%) participants had a first response in the first year in VNS + TAU arm and 69 (69/108=63.9%) participants had a first response in first year in the TAU arm. Of the 148 in the VNS + TAU arm, 98 (98/148=66.2%) participants relapsed from their first response during the study. Out of the 69 participants with first response in first year in the TAU arm, 55 (55/69=79.7%) participants relapsed from first response during the study. KM plot of time to relapse from first response demonstrates significantly longer time to relapse for the VNS + TAU arm (P<0.01 for log-rank test) (Figure 2). When response occurred within the first 12 months of initiating treatment, time to relapse took 1 year or longer for 47% of the responders in VNS + TAU, compared to 39% of the responders in TAU (Table 2). Median time to relapse from first response in first year was 10.1 months (Q1=4.2, Q3=31.5) for VNS + TAU and 7.3 months (Q1=3.1, Q3=17.6) for TAU. HR for time to relapse for VNS + TAU compared to TAU was 0.6 (95% CI: 0.4, 0.9) indicating a significantly lower probability for VNS + TAU participants to lose response compared to TAU participants at any given time during the follow-up.
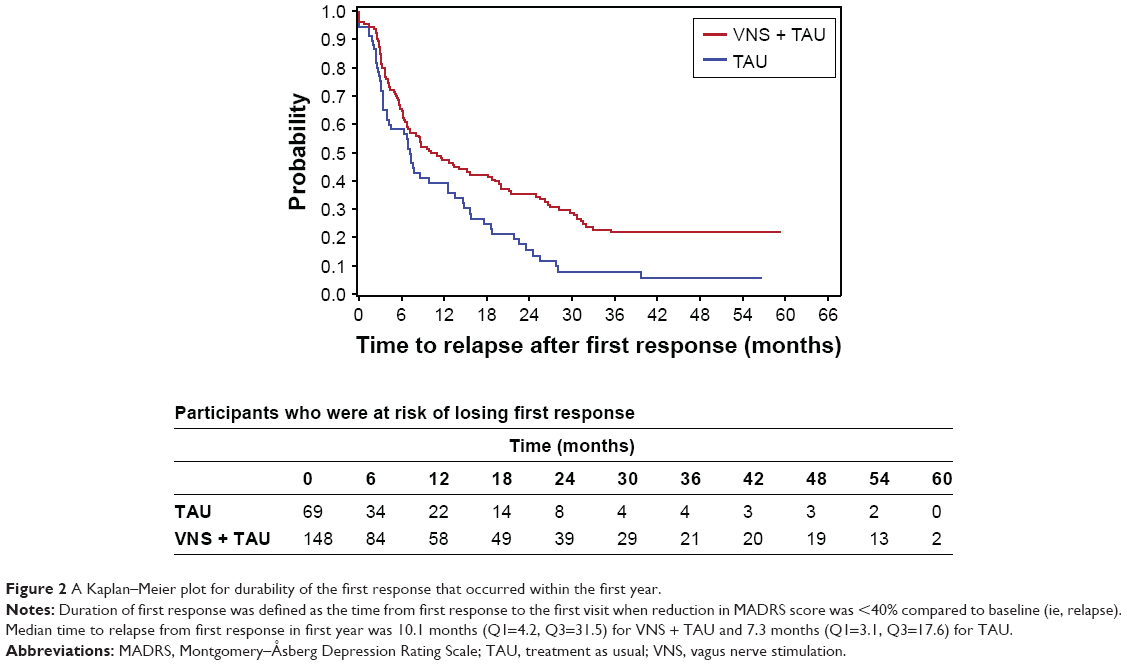 | Figure 2 A Kaplan–Meier plot for durability of the first response that occurred within the first year. |
- In VNS + TAU group, is the time at which the first response occurs related to the durability of that response?
In VNS + TAU group, the probability of retaining the first response beyond 1 year is higher in early responders (those who first responded at 3 or 6 months visits) than in late responders (those who first responded at 9 or 12 months) although the sample size is not sufficient to make any definite conclusion (P≈1.00 for log-rank test) (Figure 3). We conducted similar analysis putting early responders (3 or 6 months) as one group and late responders (9 or 12 months) as another group. Pattern was similar (Figure S1) (P=0.06).
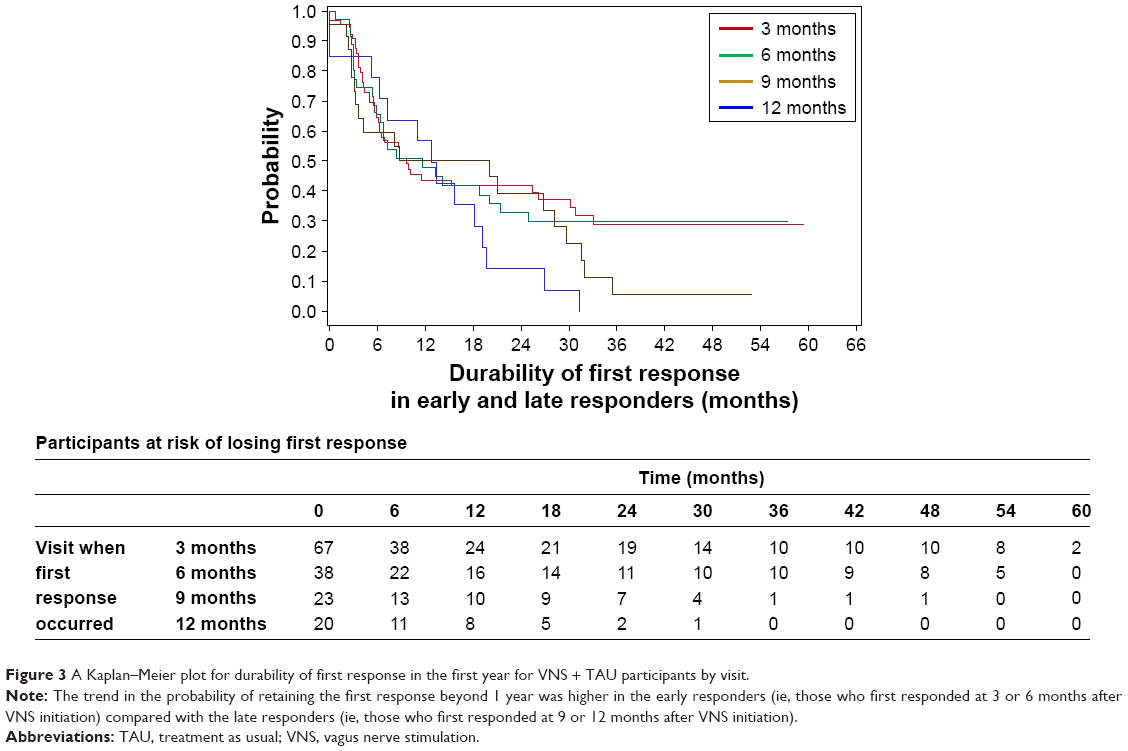 | Figure 3 A Kaplan–Meier plot for durability of first response in the first year for VNS + TAU participants by visit. |
- In each treatment group, does VNS + TAU differ from TAU alone in regard to the onset of a second response for participants that has relapsed from first response? How does VNS + TAU differ from TAU in terms of retaining a second response?
There is a substantial chance of a second response after the first response in both the TAU and VNS + TAU groups (Figure S2; Table 2). The two treatment arms do not differ significantly in the timing or overall likelihood of having a second response as measured from the time when the first response was lost. Thus, VNS neither increases nor apparently decreases the chances of the second response. However, more participants initially responded to VNS + TAU. Thus, achieving a second response is presumably occurring in at least some participants whose depression would be unlikely to respond to TAU alone.
The durability of the second response when it occurs with VNS + TAU may be more durable than the second response to TAU alone (P=0.06) (Figure S3; Table 2). The analysis is limited by sample sizes. However, it indicates that VNS has no obvious negative effect in the durability of the second response.
Discussion
In this nonrandomized comparative study of participants with either bipolar depression (30%) or unipolar depression with very substantial levels of treatment resistance, we found that symptomatic response defined by the MADRS was about twice as likely in those who received VNS + TAU as compared to TAU alone at 1-year postimplant. For those who responded, the duration of that benefit was significantly longer for those who received VNS + TAU than for those in TAU alone. At 12 months after the initial response, 47% of those who had responded to VNS + TAU still retained their response, compared to 39% of responders to TAU. Furthermore, there were suggestive (but not statistically significant) indications that those who achieved an earlier depression symptom benefit were more likely to sustain that benefit for at least 1 year.
Results also revealed that in both VNS + TAU and TAU groups, when a response was lost, a second response did occur for a substantial percentage of participants within 12 months after losing the initial response. Approximately half of the participants in the VNS + TAU group, as compared to about 1/3 of those in the TAU, had their second response within 12 months. There was no statistically significant difference between the two groups in the probability or timing of onset of achieving a second response. When this second response did occur, it may have been more durable for those treated with VNS + TAU than for TAU alone – persisting for at least 12 months for 66% in the VNS + TAU group vs 46% for TAU alone. However, these percentages are not statistically different.
This is the first study to look at the long-term durability of benefit up to 4 years, defined here as response based on 50% reduction in baseline MADRS score to declare the onset of response and a threshold of retaining at least a 40% reduction compared to baseline to retain the response. As expected from prior reports, the probability and timing of first response were more likely to be sooner with adjunctive VNS treatment than with TAU alone. In terms of long-term durability, VNS + TAU participants are expected to retain their response longer than TAU participants (HR=0.6, 95% CI: 0.4, 0.9).6 Similar to prior reports, a substantial proportion (about 50%) of participants who achieved a response maintained that benefit for at least a year after the response began.9,13,20 In addition, while half of these participants lost this initial response, half achieved a second response in 12 months. Furthermore, with adjunctive VNS, the second response was retained in two out of three participants for an additional 12 months.
The durability of response in this cohort was somewhat lower than expected from the previous pilot studies and randomized controlled trials.8,21 Possible explanations include the following: 1) these participants were treated under general clinical conditions not managed by research staff and 2) the sample contained 30% with bipolar depression whereas the other samples generally included about 10%–15% of bipolar depressed participants. A greater waxing and waning of symptoms would be expected from the bipolar sample. This issue was examined in our sample and we found no difference in response between participants diagnosed with bipolar depression vs unipolar depression (Figure S4). The present data also indicate that VNS is not impairing participant’s ability to achieve a second response following an initial response and subsequent relapse.
Comparison of the durability of the first response in this TRD sample is challenging due to sample size limitations and to the fact that any comparison between these treatment arms is contingent on a response having occurred. That is, we are comparing only those who responded in each arm. VNS + TAU produced more responders even though they likely included more difficult-to-treat (poorer prognosis) depressions that are at greater risk of relapse (ie, are not able to sustain a benefit once it occurs). Despite this likely bias against VNS + TAU in these two responder samples, the HR of 0.6 (95% CI: 0.4, 0.9) reveals a significantly smaller chance of loss of response for a VNS + TAU responder than for a responder in TAU.
Another benchmark by which to evaluate the present results is the Level 4 STAR-D participants all of whom had failed on three prior well-delivered medication treatments.1 While the acute trial was only 12 weeks in the fourth step, the remission rate was 15% and the response rate was not much greater. Of those who entered follow-up, most had responded but had not achieved remission prior to entering follow-up. Their relapse rate was over 80% over 12 months, which is substantially greater than the roughly 45% 12-month relapse rate for VNS + TAU participants and roughly 65% relapse rate for TAU participants.
Limitations
This study has several limitations: the two groups were not randomized, although majority of their clinical characteristics were comparable. In fact, the higher rate of prior ECT treatment (58% in VNS + TAU compared to 40% in TAU arm) and the higher proportion of severe recurrent major depression in VNS + TAU would suggest that the VNS + TAU group was more severely ill. In addition, there was no control for treatment. That is, we cannot conclude with certainty that all the observed effects were exclusively related to adjunctive VNS treatment. In this effectiveness trial, medications and other treatments, such as TMS and ECT, could change for the participants in both treatment arms though Conway et al (2018) mentioned unpublished results that showed that there were more medication changes in the TAU group. Thus, it is unlikely that benefits seen for VNS + TAU patients were due to other therapies.22 Furthermore, participants and clinicians were knowledgeable about the care being given. However, the off-site central raters collecting the MADRS were blind to both treatment arm and overall clinical status. The participant population limits generalizability, though it is of course reasonably representative of participants suffering from TRD. Finally, in this 5-year longitudinal study, participant attrition over time limits our ability to address with sufficient sample sizes some of the questions posed. The primary reasons for attrition did not fall in an identifiable category and hence was collected in the database under category “Others”. The next two significant reasons for attrition were consent withdrawal and noncompliance.
Conclusion
Persons with severe TRD who are treated with adjunctive VNS have a reasonable probability of achieving response within the first year (42%). Of those responders, VNS + TAU participants retain response longer compared to TAU participants; close to 50% can expect to retain that benefit over the subsequent 12 months. For those who lose that benefit, the chances of a second response are on the order of 50% within the subsequent 12 months and when a second response occurs, two-thirds in VNS + TAU and less than half in TAU can expect to retain it for the subsequent year.
Ethics statement
The TRD registry study was approved by the Western Institutional Review Board. A written informed consent was obtained from all participants in the study in accordance with the Declaration of Helsinki.
Data sharing statement
Data and results related to the TRD registry study that are open access can be found at https://clinicaltrials.gov/ct2/show/results/NCT00320372. Deidentified participant’s data for the TRD registry study will not be shared.
Acknowledgments
The authors would like to thank the patients who participated in the TRD registry study, as well as the principal investigators and study staff. The registry was sponsored by Cyberonics, Inc. (currently LivaNova, PLC), through contracts to investigative sites. The authors appreciate the editorial support of Karishma Manzur, PhD, employee of Lenimen Consulting, Inc. ClinicalTrials.gov Identifier: NCT00320372.
Disclosure
Dr Kumar is an employee of LivaNova USA PLC. Dr Bunker is a former employee and a current consultant of LivaNova USA PLC. Mr Mordenti is an employee of LivaNova PLC. Dr Aaronson has received consulting fees from Genomind, LivaNova PLC, Alkermes PLC, and Neuronetics; research support from Neuronetics; and speaking fees from Neurocrine Biosciences, Inc., Otsuka Pharmaceuticals Co., Ltd., and Sunovion Pharmaceuticals, Inc. Dr Conway has received research support from Bristol–Myers Squibb, The Stanley Medical Research Institute, the National Institute of Mental Health, NeoSync, Inc., Cyberonics, Inc., Taylor Family Institute for Innovative Psychiatric Research, American Foundation for Suicide Prevention, Assurex Health, Inc., August Busch IV Foundation, and The Foundation for Barnes-Jewish Hospital. He is currently serving as a research consultant for LivaNova PLC. Dr Rothschild has received grant or research support from Allergan PLC, Janssen, the National Institute of Mental Health, Takeda, Eli Lilly and Company (medications for a NIH-funded clinical trial), and Pfizer Inc. (medications for a NIH-funded clinical trial), is a consultant to Alkermes, GlaxoSmithKline, Sage Therapeutics, and Sanofi Aventis LLC, and has received royalties for the Rothschild Scale for Antidepressant Tachyphylaxis (RSAT)®; Clinical Manual for the Diagnosis and Treatment of Psychotic Depression, American Psychiatric Press, 2009; The Evidence-Based Guide to Antipsychotic Medications, American Psychiatric Press, 2010; The Evidence-Based Guide to Antidepressant Medications, American Psychiatric Press, 2012; and UpToDate®. Dr Rush has received consulting fees from Akili, Brain Resource Inc., Compass Inc., Curbstone Consultant LLC, Emmes Corp., Johnson and Johnson (Janssen), LivaNova, Mind Linc, Sunovion, Taj Medical; speaking fees from LivaNova; and royalties from Guilford Press and the University of Texas Southwestern Medical Center, Dallas, TX (for the inventory of depressive symptoms and its derivatives). He is also named coinventor on two patents: US Patent No 7,795,033: Methods to Predict the Outcome of Treatment with Antidepressant Medication, Inventors: McMahon FJ, Laje G, Manji H, Rush AJ, Paddock S, Wilson AS; and US Patent No 7,906,283: Methods to Identify Patients at Risk of Developing Adverse Events During Treatment with Antidepressant Medication, Inventors: McMahon FJ, Laje G, Manji H, Rush AJ, Paddock S. The authors report no other conflicts of interest in this work.
References
Rush AJ, Trivedi MH, Wisniewski SR, et al. Acute and longer-term outcomes in depressed outpatients requiring one or several treatment steps: a STAR*D report. Am J Psychiatry. 2006;163(11):1905–1917. | ||
Thase ME, Rush AJ. When at first you don’t succeed: sequential strategies for antidepressant nonresponders. J Clin Psychiatry. 1997;58(Suppl 13):23–29. | ||
Frank E, Prien RF, Jarrett RB, et al. Conceptualization and rationale for consensus definitions of terms in major depressive disorder, remission, recovery, relapse, and recurrence. Arch Gen Psychiatry. 1991;48(9):851–855. | ||
Rush AJ, Kraemer HC, Sackeim HA, et al. Report by the ACNP Task Force on response and remission in major depressive disorder. Neuropsychopharmacology. 2006;31(9):1841–1853. | ||
Aaronson ST, Carpenter LL, Conway CR, et al. Vagus nerve stimulation therapy randomized to different amounts of electrical charge for treatment-resistant depression: acute and chronic effects. Brain Stimul. 2013;6(4):631–640. | ||
Aaronson ST, Sears P, Ruvuna F, et al. A 5-year observational study of patients with treatment-resistant depression treated with vagus nerve stimulation or treatment as usual: comparison of response, remission, and suicidality. Am J Psychiatry. 2017;174(7):640–648. | ||
AHRQ. Technology Assessment Program: Definition of Treatment-Resistant Depression in the Medicare Population. Project ID: PSYT0816. Agency for Healthcare Research and Quality. US Department of Health and Human Services. 2018. Available from: https://www.cms.gov/Medicare/Coverage/DeterminationProcess/downloads/id105TA.pdf. Accessed April 18, 2018. | ||
Rush AJ, Sackeim HA, Marangell LB, et al. Effects of 12 months of vagus nerve stimulation in treatment-resistant depression: a naturalistic study. Biol Psychiatry. 2005;58(5):355–363. | ||
Berry SM, Broglio K, Bunker M, Jayewardene A, Olin B, Rush AJ. A patient-level meta-analysis of studies evaluating vagus nerve stimulation therapy for treatment-resistant depression. Med Devices. 2013;6:17–35. | ||
Rush AJ, George MS, Sackeim HA, et al. Vagus nerve stimulation (VNS) for treatment-resistant depressions: a multicenter study. Biol Psychiatry. 2000;47(4):276–286. | ||
Rush AJ, Marangell LB, Sackeim HA, et al. Vagus nerve stimulation for treatment-resistant depression: a randomized, controlled acute phase trial. Biol Psychiatry. 2005;58(5):347–354. | ||
George MS, Rush AJ, Marangell LB, et al. A one-year comparison of vagus nerve stimulation with treatment as usual for treatment-resistant depression. Biol Psychiatry. 2005;58(5):364–373. | ||
Sackeim HA, Brannan SK, Rush AJ, George MS, Marangell LB, Allen J. Durability of antidepressant response to vagus nerve stimulation (VNS). Int J Neuropsychopharmacol. 2007;10(6):817–826. | ||
Montgomery SA, Asberg M. A new depression scale designed to be sensitive to change. Br J Psychiatry. 1979;134:382–389. | ||
Olin B, Jayewardene AK, Bunker M, Moreno F. Mortality and suicide risk in treatment-resistant depression: an observational study of the long-term impact of intervention. PLoS One. 2012;7(10):e48002. | ||
Trivedi MH, Rush AJ, Ibrahim HM, et al. The inventory of depressive symptomatology, clinician rating (IDS-C) and self-report (IDS-SR), and the quick inventory of depressive symptomatology, clinician rating (QIDS-C) and self-report (QIDS-SR) in public sector patients with mood disorders: a psychometric evaluation. Psychol Med. 2004;34(1):73–82. | ||
Rush AJ, Trivedi MH, Ibrahim HM, et al. The 16-Item quick inventory of depressive symptomatology (QIDS), clinician rating (QIDS-C), and self-report (QIDS-SR): a psychometric evaluation in patients with chronic major depression. Biol Psychiatry. 2003;54(5):573–583. | ||
Guy W. ECDEU Assessment Manual for Psychopharmacology. Rockville, MD: US Department of Health, Education, and Welfare; 1976. | ||
Zimmerman M, Posternak MA, Chelminski I. Defining remission on the Montgomery-Asberg depression rating scale. J Clin Psychiatry. 2004;65(2):163–168. | ||
Nahas Z, Marangell LB, Husain MM, et al. Two-year outcome of vagus nerve stimulation (VNS) for treatment of major depressive episodes. J Clin Psychiatry. 2005;66(9):1097–1104. | ||
Marangell LB, Rush AJ, George MS, et al. Vagus nerve stimulation (VNS) for major depressive episodes: one year outcomes. Biol Psychiatry. 2002;51(4):280–287. | ||
Conway CR, Kumar A, Xiong W, Bunker M, Aaronson ST, Rush AJ. Chronic vagus nerve stimulation significantly improves quality of life in treatment-resistant major depression. J Clin Psychiatry. 2018;79(5):52–59. |
Supplementary materials
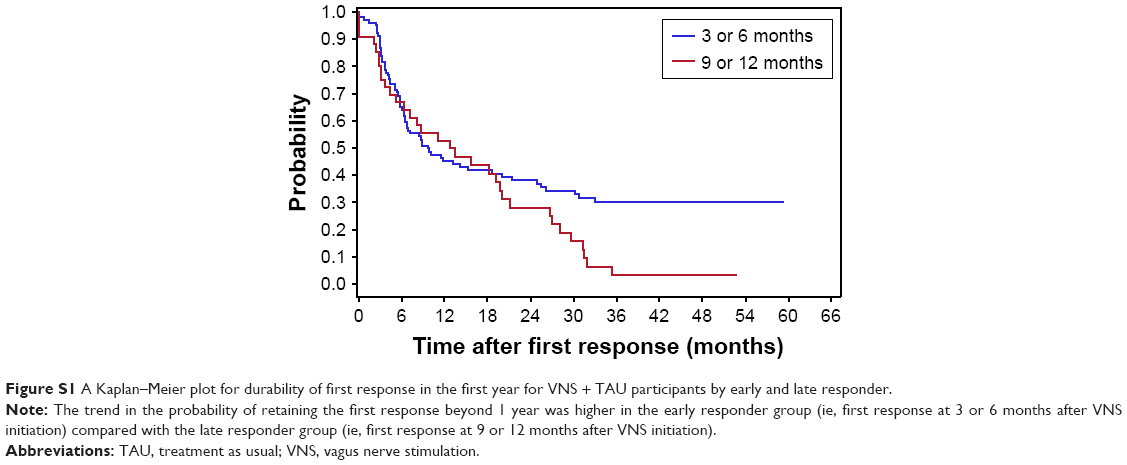 | Figure S1 A Kaplan–Meier plot for durability of first response in the first year for VNS + TAU participants by early and late responder. |
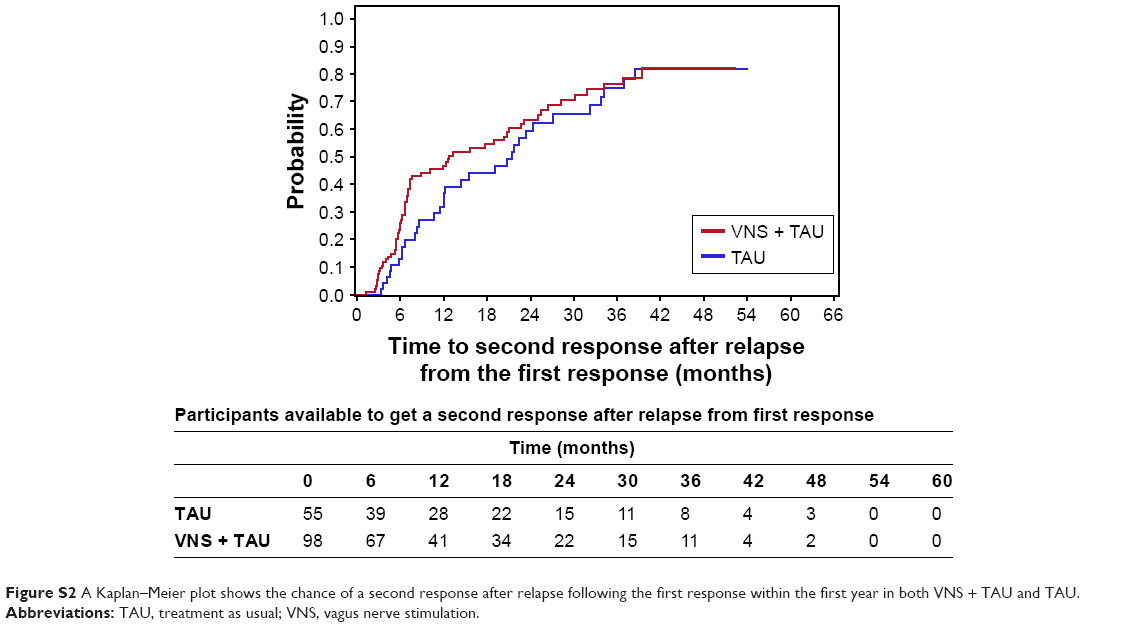 | Figure S2 A Kaplan–Meier plot shows the chance of a second response after relapse following the first response within the first year in both VNS + TAU and TAU. |
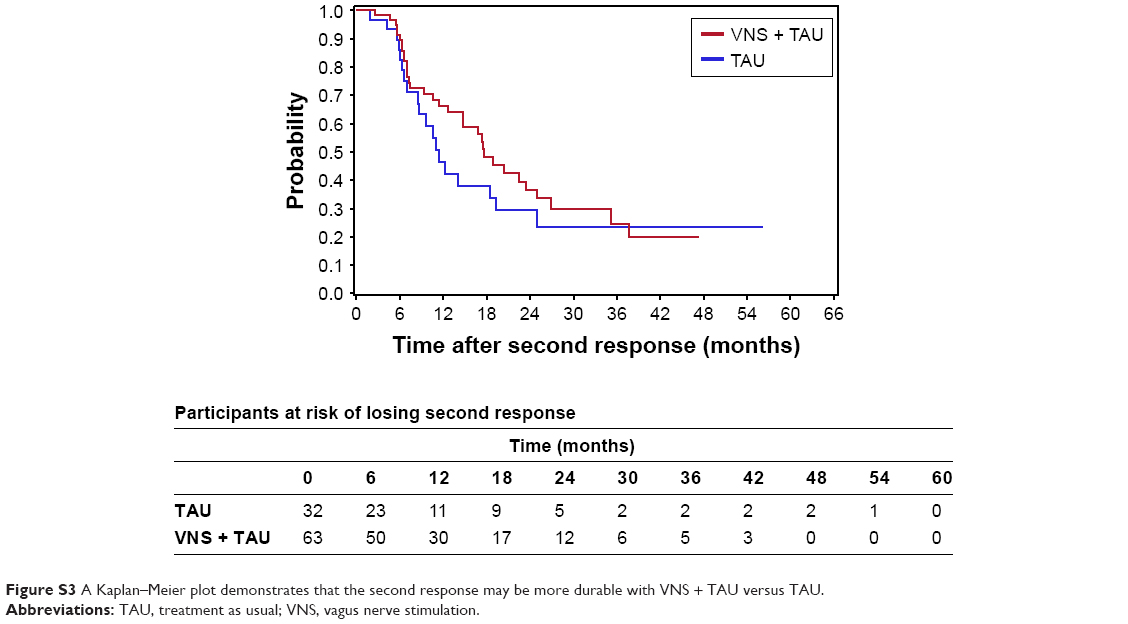 | Figure S3 A Kaplan–Meier plot demonstrates that the second response may be more durable with VNS + TAU versus TAU. |
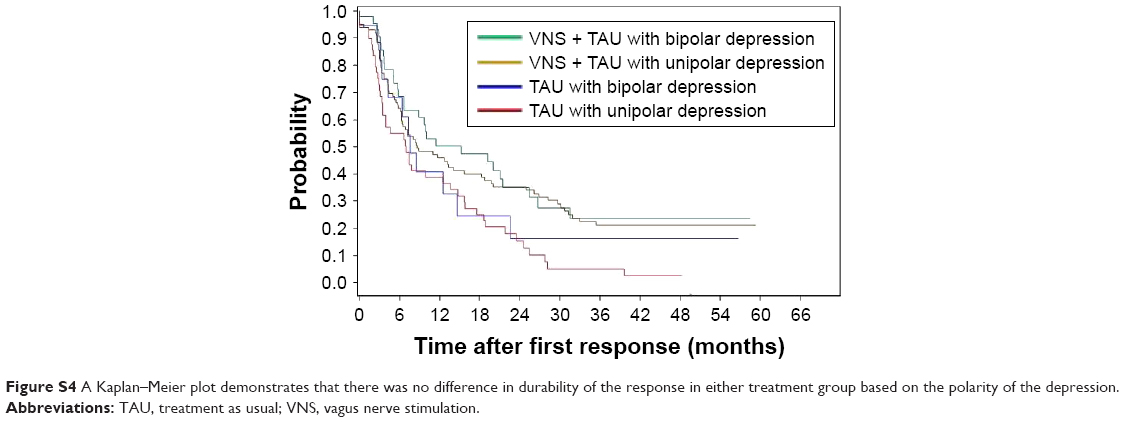 | Figure S4 A Kaplan–Meier plot demonstrates that there was no difference in durability of the response in either treatment group based on the polarity of the depression. |
 © 2019 The Author(s). This work is published and licensed by Dove Medical Press Limited. The
full terms of this license are available at https://www.dovepress.com/terms
and incorporate the Creative Commons Attribution
- Non Commercial (unported, 3.0) License.
By accessing the work you hereby accept the Terms. Non-commercial uses of the work are permitted
without any further permission from Dove Medical Press Limited, provided the work is properly
attributed. For permission for commercial use of this work, please see paragraphs 4.2 and 5 of our Terms.
© 2019 The Author(s). This work is published and licensed by Dove Medical Press Limited. The
full terms of this license are available at https://www.dovepress.com/terms
and incorporate the Creative Commons Attribution
- Non Commercial (unported, 3.0) License.
By accessing the work you hereby accept the Terms. Non-commercial uses of the work are permitted
without any further permission from Dove Medical Press Limited, provided the work is properly
attributed. For permission for commercial use of this work, please see paragraphs 4.2 and 5 of our Terms.