Back to Journals » OncoTargets and Therapy » Volume 11
Drug response to PD-1/PD-L1 blockade: based on biomarkers
Received 15 March 2018
Accepted for publication 12 May 2018
Published 8 August 2018 Volume 2018:11 Pages 4673—4683
DOI https://doi.org/10.2147/OTT.S168313
Checked for plagiarism Yes
Review by Single anonymous peer review
Peer reviewer comments 2
Editor who approved publication: Dr Yao Dai
Qi Chen, Tianhe Li, Wentao Yue
Central Laboratory, Beijing Obstetrics and Gynecology Hospital, Capital Medical University, Beijing 100026, People’s Republic of China
Abstract: In recent years, immunotherapies targeting programmed death-1 (PD-1)/programmed death ligand 1 (PD-L1) have provided great hopes for patients with cancer. A successful anti-PD-1/PD-L1 therapy includes not only the elimination of immunosuppressive tumor cells but also the rejuvenation of exhausted T cells. Nevertheless, the efficacy of therapy is still low, so that biomarker-driven therapy has attracted more and more attention to identify patients who are likely to benefit from therapy and to reduce unnecessary disease progression. While many studies have focused on characteristics of tumor biopsies, biomarkers linked to T cell exhaustion and rejuvenation have just become new hot spots in drug response studies. However, no biomarker is perfect in drug response prediction currently, so there is an urgent need for other biomarkers to compensate for the deficiency. In this review, we summarize some approved and candidate biomarkers predictive of drug response before and during PD-1/PD-L1 blockade, including those characterizing responsive or suppressive tumor cells and those evaluating the T cell rejuvenation. Overall, we set up a comprehensive network of biomarkers of tumor characteristics and T cell rejuvenation, predicting drug response before and during anti-PD-1/PD-L1 therapies.
Keywords: PD-1, PD-L1, biomarker, network, tumor, T cell rejuvenation
Introduction
In recent years, programmed death-1 (PD-1)/programmed death ligand 1 (PD-L1) blockade has attracted much attention in oncotherapy. As the inhibitory receptor–ligand interaction between PD-1 and PD-L1 is involved in the negative regulation of T cell activation and peripheral tolerance during immune responses by cancer cells,1 drugs targeting PD-1 or PD-L1 have been proved to be valuable in oncotherapy.
Until now, five anti-PD-1/PD-L1 drugs have received approval by the US Food and Drug Administration (FDA), including anti-PD-1 drugs such as pembrolizumab (Keytruda; Merck & Co., Inc., Kenilworth, NJ, USA) and nivolumab (Opdivo; Bristol-Myers Squibb Company New York, NY, USA) as well as anti-PD-L1 drugs such as atezolizumab (Tecentriq; Genentech, Inc., South San Francisco, CA, USA), avelumab (Bavencio; EMD Serono, Inc., Merck KGaA, Darmstadt, Germany), and durvalumab (Imfinzi; AstraZeneca UK Limited, Cambridge, UK). Most of the anti-PD-1/PD-L1 drugs have been approved for application in certain types of tumor (Table 1). Briefly, pembrolizumab has been approved for the treatment of melanoma,2 non-small cell lung cancer (NSCLC),3,4 Hodgkin lymphoma, head and neck squamous cell carcinoma (HNSCC), urothelial carcinoma,5–7 and then for gastric or gastroesophageal junction adenocarcinoma on September 22, 2017 (http://www.mrknewsroom.com). Meanwhile, nivolumab received accelerated approval for metastatic colorectal cancer on July 31, 2017, and has been previously approved for melanoma, NSCLC, renal cell carcinoma, HNSCC, Hodgkin lymphoma, and urothelial cancer.8,9 Atezolizumab is approved for metastatic NSCLC10 and received accelerated approval for urothelial carcinoma11,12 but failed in the Phase III IMvigor211 study in May 2017 (https://www.roche.com). Moreover, avelumab received accelerated approval in March 2017 for metastatic Merkel cell carcinoma13,14 and in May 2017 for urothelial carcinoma (https://www.fda.gov). Finally, durvalumab received accelerated approval in May 2017 for treating urothelial carcinoma.15
 | Table 1 Application range and biomarkers for anti-PD-1/PD-L1 drugs |
Despite demonstrated successes, only a minority of patients can benefit from the therapies if applied just based on tumor types, so that it is imperative to identify biomarkers for drug response prediction. However, only two biomarkers have already been approved for the application of anti-PD-1/PD-L1 drugs, while other candidate biomarkers still need validation by clinical trial (Table 1). It should be noted that no single biomarker is sufficient for drug response prediction currently; each has its limitations. Therefore, other candidate biomarkers are valuable to compensate for deficiencies of the existing biomarkers.
To enhance the drug response to PD-1/PD-L1 blockade, comprehensive considerations of the biomarkers are required. First, the risk of therapeutic failure comes not only from primary resistance characteristics of a patient but also from resistance that emerges during the treatment course. Second, barriers to success exist in failure not only to eliminate immunosuppressive tumor cells but also to reinvigorate exhausted T cells.
In this review, we set up a comprehensive network of approved and candidate biomarkers before and during PD-1/PD-L1 blockade in consideration of the characteristics of tumor and reinvigoration of exhausted T cells.
Biomarker network of tumor characteristics for PD-1/PD-L1 blockade
Biomarkers of tumor characteristics before treatment
Most biomarkers predictive of response to anti-PD-1/PD-L1 drugs are concentrated on tumor characteristics before the initiation of therapy (Table 1 and Figure 1); each has its limitations and requires other biomarkers to compensate for it. Among discovered biomarkers, only two have been approved for the application of anti-PD-1/PD-L1 drugs. The first biomarker is PD-L1 expression, which has been validated in nearly all tumor types for all approved anti-PD-1/PD-L1 drugs in cancer market, while most other biomarkers still lack validation in clinical trials. However, the application of PD-L1 expression needs complicated considerations of tumor types and standardization, and sometimes it is not sufficient to differentiate responders from nonresponders. Hence, PD-L1 single-nucleotide polymorphisms (SNPs) that are easier in standardization, such as rs4143815 and rs2282055, are explored to further select responders. The second biomarker is microsatellite instability (MSI) or deficient mismatch repair (dMMR), which is recently approved for application as a biomarker predictive of response to anti-PD-1/PD-L1 drug negligible of tumor type. Although this approval has opened a new era in drug response prediction, MSI is still not sufficient for drug response prediction due to its various frequencies in different cancers. Polymerase ε (POLE) mutation appears as a positive biomarker for patients with a microsatellite stable (MSS) phenotype, while mutations such as Janus Kinase 1 (JAK1) and JAK2 appear to be negative biomarkers for patients with an MSI phenotype, requiring validation by clinical trials.
 | Figure 1 Biomarker network of tumor characteristics before and during PD-1/PD-L1 blockade. |
PD-L1 expression: standardization and tumor type
PD-L1 expression is now the most widely validated predictive biomarker for drug response to anti-PD-1/PD-L1 drugs (Table 1). Many kinds of genomic aberrations such as copy number amplification of the genes PD-L1 and JAK2 can result in high expression of PD-L1 protein and poor prognosis.16–18 Based on PD-L1 expression, pembrolizumab is approved for the first-line treatment of metastatic NSCLC with a cutoff of ≥50%, while the second-line treatment requires only ≥1%.3,4,19 Meanwhile, PD-L1 expression is reported to predict a better response to avelumab in patients with urothelial carcinoma with a confirmed objective response rate (ORR) of 53.8% in PD-L1-positive tumors compared with 4.2% in PD-L1-negative tumors.20 Similarly, statistically significant increase in ORR was observed in patients with HNSCC treated with pembrolizumab (22% vs 4% for PD-L1-positive vs PD-L1-negative).21
However, several challenges have been reviewed to be associated with this approach.22 We only point out three of them.
One of the challenges is the lack of standardization. Different PD-L1 assays in clinical trials have provided variable definition of “PD-L1 expression” and various cutoffs for “PD-L1 positive/high”, making it hard to compare the drug efficacy even on the same tumor type. Just for patients with urothelial cancer, when treated with pembrolizumab, PD-L1 expression tested by PD-L1 IHC 22C3 pharmDx was scored by the percentage of cells (tumor cells, macrophages, or lymphocytes) expressing PD-L1 in a tumor biopsy, and a cutoff of ≥10% was associated with a higher frequency of drug response.23 Meanwhile, when treated with atezolizumab, PD-L1 expression was assessed by VENTANA PD-L1 SP142 (Ventana Medical Systems, Inc, Oro Valley, AR, USA), depending on the percentage of PD-L1-stained tumor-infiltrating immune cells, and a cutoff of ≥5% was used.11 In addition, when treated with durvalumab, PD-L1 expression was determined by VENTANA PD-L1 (SP263 ), and high PD-L1 expression was defined as ≥25% of either tumor cells or immune cells staining for PD-L1 expression.24 Moreover, when treated with nivolumab, PD-L1 expression was assessed according to membrane staining by PD-L1 IHC 28-8 pharmDx, and several cutoffs were used (≥5%, ≥1%, <1%).25 Even though ORR was highest in pembrolizumab-treated patients (Table 2), we cannot conclude that pembrolizumab is the most suitable drug for patients with urothelial cancer. By taking into account that a patient would not take every assay for his PD-L1 expression, it is hard to select the most suitable therapy for him.
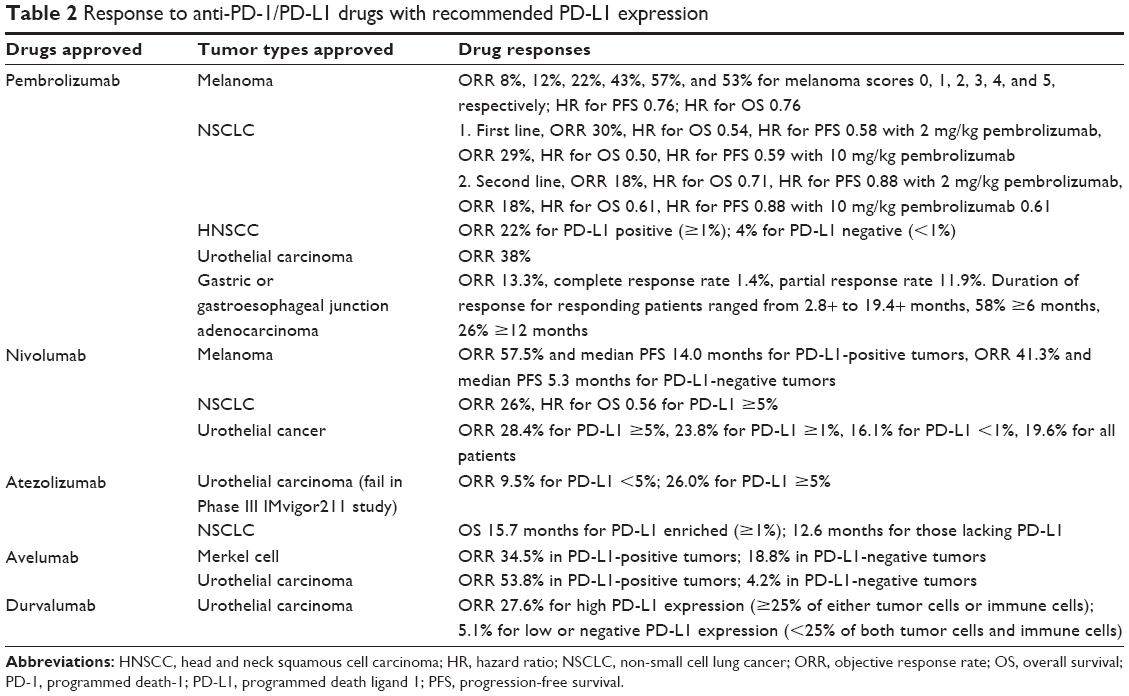 | Table 2 Response to anti-PD-1/PD-L1 drugs with recommended PD-L1 expression |
Another challenge is the complicated consideration of different tumor types (Table 1). For example, applification of pembrolizumab requires a certain level of PD-L1 expression in some types of tumor, and the required PD-L1 expression level is variable. Nevertheless, applification of pembrolizumab is regardless of PD-L1 expression in other tumor types, although higher expression of PD-L1 still correlates with better outcomes.
Finally, PD-L1 expression is not sufficient for distinguishing responders and nonresponders in some cases, as drug responses are not much different between PD-L1-high and PD-L1-low patients. For example, nivolumab is applied on melanoma irrespective of PD-L1 expression with ORR of 57.5% for PD-L1-positive tumors and 41.3% for PD-L1-negative tumors.26
To compensate for the limitations of PD-L1 expression, many efforts have been made to discover new biomarkers. Among them, PD-L1 SNPs come out as biomarkers related to PD-L1 expression but easier in standardization, while MSI and dMMR can be used as biomarkers predictive of drug response to PD-1/PD-L1 blockade negligible of tumor types and regardless of PD-L1 expression.
PD-L1 SNPs: easier in standardization
SNPs have been classically used to understand the mechanisms of drug response to various diseases.27 PD-L1 SNPs are previously reported to be related to PD-L1 expression. For example, rs4143815 C>G in 3′UTR of PD-L1 was associated with a decreased PD-L1 expression in NSCLC patients.28,29 However, very few studies have been performed to evaluate the impact of PD-L1 SNPs on response to anti-PD-1/PD-L1 drugs until now.
PD-L1 SNPs that are more easily standardized may serve as biomarkers compensated for PD-L1 expression, particularly when PD-1 expression is not sufficient to further identify responders. For example, PD-L1 expression is not sufficient in further patient selection when treated NSCLC patients with nivolumab.9,30 Strikingly, the ORR and the median progression-free survival (PFS) time for the C/C, C/G genotypes of PD-L1 rs4143815 are better than the G/G genotype (Table 3).31 Similarly, a better clinical response is observed in the G/G, G/T genotypes of intronic PD-L1 rs2282055 compared with the T/T genotype (Table 3).31
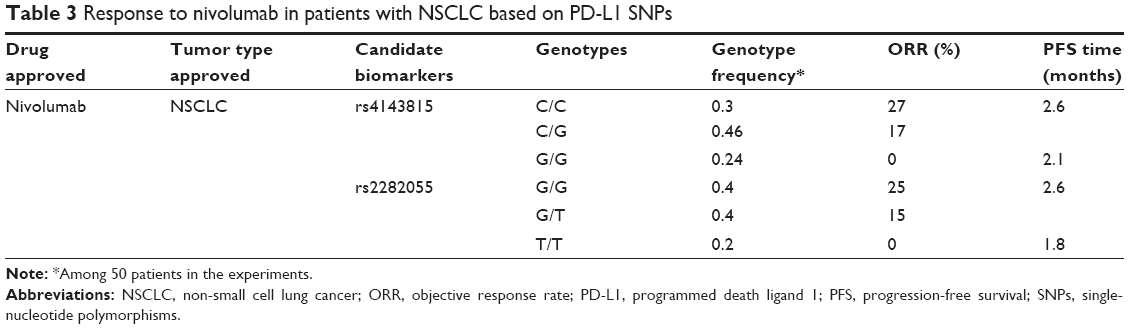 | Table 3 Response to nivolumab in patients with NSCLC based on PD-L1 SNPs |
Although PD-L1 SNPs are more easily standardized and can further identify responsive and nonresponsive NSCLC patients treated with nivolumab, there are still some uncertainties for their application. Does application of PD-L1 SNPs still need complex considerations of tumor types? Should they be used as supplements to PD-L1 expression or independently? Further clinical trials are required to instruct the application of PD-L1 SNPs as a predictive biomarker for response to anti-PD-1/PD-L1 drugs.
MSI and dMMR: tissue-agnostic biomarker
Compared with PD-L1 expression that needs complicated considerations of different tumor types, MSI becomes the first approved tissue-agnostic biomarker for solid tumors treated with pembrolizumab,32 regardless of PD-L1 expression. MSI is a molecular marker of dMMR system. As the mismatch repair system is of pivotal importance in detecting and cutting off mismatches during DNA replication,33 MSI leads to an endogenous antitumor response that is counterbalanced by the expression of PD-1 or PD-L1.33 Therefore, when treated with pembrolizumab, favorable response was achieved in MSI-high (MSI-H), dMMR colorectal cancer, and noncolorectal cancer (Table 4).34
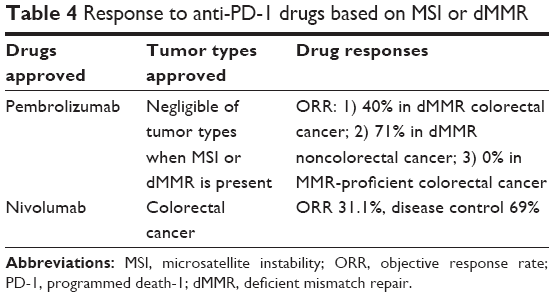 | Table 4 Response to anti-PD-1 drugs based on MSI or dMMR |
It would be interesting that whether this tissue-agnostic biomarker MSI can be used for drug response prediction for other anti-PD-1/PD-L1 drugs. Strikingly, just on July 31, 2017, the FDA granted accelerated approval to nivolumab for the treatment of dMMR and MSI-H metastatic colorectal cancer based on its durable effect in the study CA209142 (CHECKMATE 142; NCT 02060188; Table 4).35 Although this approval is restricted to colorectal cancer, it may be inferred that patients with other types of MSI tumor would also benefit from nivolumab therapy. Recent approvals have inspired designed clinical trials to test the efficacy of other anti-PD-1/PD-L1 drugs on MSI tumors, including a Phase II study of avelumab in patients with MSI-H endometrial cancer (NCT02912572;ongoing trial). More clinical trials should be conducted to confirm the tissue-agnostic utility of MSI in different anti-PD-1/PD-L1 therapies.
Although inspired by the discovery of MSI as a tissue-agnostic biomarker for drug response to PD-1/PD-L1 blockade, it is insufficient to predict drug response simply classified by MSI and the opposite phenotype MSS, which is usually believed to correlate with negative drug response. First, it should be noted that the frequencies of MSI are variable across different kinds of cancer. Frequencies of MSI are high in some cancer types, for example, 13% in colorectal cancer and 22% in endometrial and gastric cancer.34 However, frequencies of MSI are very low in some other cancer types, for example, nearly 0% in lung cancer, only 1% in bladder cancer, 2% in renal cell carcinoma, and 3% in HNSCC,34 which is much lower than the percentage of patients likely to benefit from PD-1/PD-L1 blockade. Second, response rates in MSI tumors have never reached 100% with some MSI patients showing resistance to anti-PD-1/PD-L1 drugs.
Discovery of more biomarkers is still in need, especially for patients without an MSI phenotype but who would likely be cured by anti-PD-1/PD-L1 drugs as well as those with MSI who would not benefit from the therapies.
POLE and JAK1/2 mutations: compensation for MSS and MSI
The limitations of MSI in drug response prediction have triggered the discovery of some new biomarkers by screening the tumors, including POLE mutations as a positive biomarker in MSS phenotype and JAK1/2 mutations as negative biomarkers in MSI phenotype (Table 1).
First, mutations in POLE have provided hopes for patients with an MSS phenotype. POLE is a DNA polymerase involved in DNA replication and repair. Mutations in POLE contribute to an MSS phenotype, but still predict effective response to pembrolizumab in patients with colorectal cancer.36 The same phenomenon is reported in patients with endometrial cancer, who have POLE mutations and show exceptional response to pembrolizumab or nivolumab.37,38 However, these case reports are not sufficient for the validation of POLE mutation as a positive biomarker. Larger clinical trials testing drug response in patients with mutated POLE and MSS are required, including a study of pembrolizumab for patients with advanced cancer (NCT02693535), a Phase II study evaluating avelumab for patients with endometrial cancer (NCT02912572) as well as a Phase II study assessing azacitidine in combination with durvalumab for patients with colorectal carcinoma (NCT 02811497;ongoing trial).
Second, JAK1 and JAK2 emerge as negative biomarkers of tumors with MSI. They are induced by interferon-γ and can activate STAT1/STAT2/STAT3-IRF1 axis to upregulate PD-L1 expression, resulting in increased resistance to tumor lysis by NK cells.39,40 So that loss-of-function mutations of JAK1 and JAK2 can abolish interferon-γ signaling. It has been reported in case reports that JAK1 and JAK2 mutations are involved in primary resistance to pembrolizumab in dMMR colon cancer.41 However, it also requires validation by clinical trials, as POLE does.
Biomarkers of tumor characteristics during treatment
For patients who have been supposed to be a responder before PD-1/PD-L1 blockade, delayed relapse after an initial objective tumor regression is a major barrier in the successful anti-PD-1/PD-L1 therapy due to some newly occurred mutations such as JAK1, JAK2, and beta-2-microglobulin (B2M; Table 1 and Figure 1). However, it is controversial to use the newly occurred mutations as biomarkers as they may be neglected before reaching a detectable level. Moreover, when PD-L1 expression is insufficient to identify responders before the initiation of the treatment, the elevated PD-L1 expression appears as a compensable biomarker during the treatment, although it is unclear which extent of upregulation can be defined as “responsiveness” (Figure 1). Although we are not able to discuss all biomarkers in recent years, we present evidence on some factors as a representative.
JAK1/2 and B2M: newly occurred mutations
Mutations in tumor biopsies have long been plausible biomarkers for drug response prediction. To understand the mechanism of acquired resistance during PD-1/PD-L1 blockade, biopsy samples from patients with acquired resistance have been examined.
Among many biomarkers for acquired resistance, it is noted that biomarkers related to primary resistance can also lead to resistance during the treatment. With tumors not mutated for JAK1 or JAK2, patients with melanoma still show resistance to pembrolizumab therapy due to newly occurred JAK1 and JAK2 mutations during the treatment.42 Similarly, a truncated B2M mutation can result in defective antigen presentation and was reported to be linked to acquired resistance to pembrolizumab.42
However, it is controversial to use the newly occurred mutations to monitor the therapy course. First, with multiregional exome sequencing of spatially distinct regions of the tumors, different groups of researchers found that intratumoral heterogeneity existed in somatic mutation and copy number alteration levels, following a branched evolution model.43,44 Mutations such as JAK1 can be found as both truncal mutations or branch mutations.43,44 For a patient with primary and recurrent metastatic tumors, polyclonal metastatic seeding existed43 which can lead to drug resistance. Compared with mutations that can be found in a large proportion of the primary tumors, new mutations usually occur in only a few cells. It’s hard to detect these mutations before they accumulated to a certain level, when it may be too late for a patient to change for another proper therapy in time. To address this issue, single-cell sequencing appears to be valuable in better understanding the genomic principles of tumor heterogeneity and monitoring the emergence of drug-resistant cell clones in patient samples.45,46 Second, as these mutations were discovered in case reports, clinical trials are needed to confirm their frequencies in patients with acquired resistance, so as to assess the value of these biomarkers.
PD-L1 upregulation: response during treatment
Commonly detected on different kinds of tumor cells, PD-L1 expression is previously seen as a positive biomarker predictive of drug response before PD-1/PD-L1 blockade. However, PD-L1 expression before therapy fails to differentiate patients with melanoma who would respond to pembrolizumab or nivolumab and those who would not.47
Strikingly, when tested during the immunotherapies, the elevation of PD-L1 expression was observed to be associated with effective response to pembrolizumab and nivolumab.47 Notably, within 2 months of commencing treatment, tumoral PD-L1 and macrophage PD-L1 expression were higher in responders than nonresponders. Therefore, PD-L1 upregulation could be considered as an effective biomarker to monitor the treatment and further classify patients with different responses to PD-1/PD-L1 blockade.
Nevertheless, the application of elevated PD-L1 level as a biomarker still faces some challenges. In addition to its lack of standardization and complex considerations of tumor types, PD-L1 expression is usually variable in patients before the therapy, so that it is hard to define a baseline PD-L1 expression. Meanwhile, biopsies from both responders and non-responders show an upregulation of PD-L1 expression during the therapy, although with distinct elevated level.47 It deserves cautiously definition of “responsiveness” and “resistance” based on the level of PD-L1 upregulation.
Biomarker network of T cell rejuvenation for PD-1/PD-L1 blockade
T cell rejuvenation is a pivotal step of a successful PD-1/PD-L1 blockade. However, there are not many biomarkers evaluating the T cell rejuvenation until now (Table 1 and Figure 2). The upregulation of T cell immunoglobulin mucin-3 (TIM-3) and a “reinvigoration score” based on the ratio of Ki67 to tumor burden have recently emerged as biomarkers monitoring the therapy course, which are associated with T cell exhaustion and reinvigoration. However, the observation of these biomarkers needs several weeks of waiting and puts a risk of unnecessary disease progression on patients. To predict the T cell rejuvenation ability before the initiation of the treatment, exhaustion-associated DNA methylation status may be valuable, especially for cancer patients with chronic virus infection or antigen exposure. Evidence on these biomarkers is presented in the following sections.
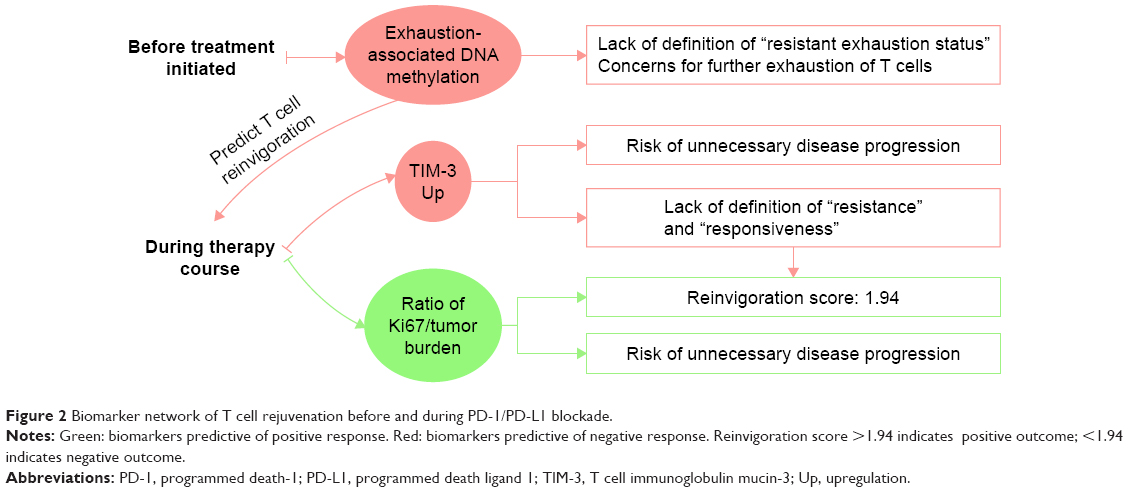 | Figure 2 Biomarker network of T cell rejuvenation before and during PD-1/PD-L1 blockade. |
Upregulation of TIM-3: resistance during treatment
Failure in T cell rejuvenation is a risk factor that may subvert the drug response prediction based on biomarkers describing the characteristics of tumor biopsies. While much effort has been made to discover biomarkers describing the characteristics of tumor biopsies, very few biomarkers have been discovered to evaluate T cell rejuvenation ability in blood samples and appear as new hot spots in immunotherapy.
One of the candidate biomarkers to monitor the therapy course is the upregulation of TIM-3. TIM-3 plays a key role in inhibiting Th1 cell response and the expression of cytokines such as IFN-γ and TNF-α,48 so that the upregulation of TIM-3 may lead to resistance to PD-1/PD-L1 blockade. In fact, in a mouse model of lung adenocarcinoma, TIM-3 is reported to be upregulated in PD-1-antibody-bond T cells in tumors progressing following response to anti-PD-1 therapy.49 This TIM-3-induced resistance was also observed in patients with lung cancer and those with HNSCC, even after these patients had been selected according to PD-L1 expression and showed an initial response to pembrolizumab or nivolumab (Table 1).49,50 In these patients, IFN-γ and TNF-α failed to be further induced in TIM-3-positive T cells upon PD-1 blockade, opposite to that observed in TIM-3-negative T cells.50 Therefore, a combination therapy of TIM-3 inhibitor and anti-PD-1/PD-L1 drugs is recommended to improve therapy efficacy.
Strikingly, not all anti-PD-1/PD-L1 drugs may lead to TIM-3 upregulation. The treatment with avelumab is reported to cause no significant effect on peripheral immune cell subsets, including those that express PD-L1 or TIM-3,51,52 so as to prevent cells from resorting to alternative checkpoints. This advantage of avelumab in overcoming TIM-3-induced resistance is believed to come from its ability to induce antibody-dependent cytotoxicity-mediated tumor cell lysis.51 Whether avelumab can be singly applied across different types of tumors remains to be confirmed.
It should be noted that it is still uncertain which level of TIM-3 upregulation can be defined as “resistance”, and patients have to wait for a period to know whether they would benefit from the therapy, and more clinical trials have to be cautiously designed.
Ratio of Ki67 to tumor burden: reinvigoration score during treatment
Although changes of some biomarkers during the therapy course appear to be related to drug response to PD-1/PD-L1 blockade, there are few definitions of “resistance” or “responsiveness” based on their changes. Recently, a “reinvigoration score” has been developed according to the ratio of Ki67 to tumor burden to distinguish clinical outcomes and predict drug response.
Ki67 alone did not correlate with clinical outcomes to PD-1/PD-L1 blockade; in contrast, the ratio of changes of Ki67 to tumor burden did. It was reported that higher ratio of fold change of Ki67+ CD8 T cells to tumor burden was related to better clinical response in patients with melanoma.53 Nevertheless, this fold change required measurements both before and after treatment.
Therefore, the ratio of Ki67+ CD8 T cells to pretreatment tumor burden at 6 weeks post pembrolizumab treatment was used as the “reinvigoration score” instead.53 In fact, when this ratio was greater than 1.94, better outcome was achieved by ORR, PFS, and overall survival in patients with melanoma. In contrast, a ratio of <1.94 was indicated for negative clinical outcomes.
However, the application of this reinvigoration score faces the same problem as elevated TIM-3 does. As patients must wait several weeks before they receive the results, the risk of unnecessary disease progression increases due to delayed replacement of proper therapies. Therefore, biomarkers are in urgent need to evaluate the T cell rejuvenation ability before patients take the therapy.
Exhaustion-associated DNA methylation: consideration before treatment
Exhaustion-associated DNA methylation is a new biomarker to evaluate the rejuvenation ability of T cells before PD-1/PD-L1 blockade.
Some biomarkers that seem to be promising in drug response prediction may fail to meet the demands of clinic. For example, the virus-infected cells usually have the expression of PD-L1 upregulated to escape immune surveillance54–56 and then lead to many kinds of tumors. T cells gradually lose function in a hierarchical manner during viral infections and tumor development57 and have been reported to be restored by PD-1/PD-L1 blockade.54–56 However, virus load seems to be insufficient for drug response prediction. In some case reports, patients with HIV, hepatitis C virus (HCV), or Epstein-Barr virus (EBV) infection show resistance to pembrolizumab, even though virus DNA is undetectable after therapy.58,59
Failure of response to PD-1/PD-L1 blockade is possibly due to heritable exhaustion-associated de novo methylation progressively acquired during virus-induced cancer development.60 In a chronic virus-infected mouse model of prostate cancer, the de novo methylation in loci such as IFN-γ, Myc, Tcf7, Ccr7, Tbx21, and Eomesodermin makes activated CD8 T cells fully exhausted and restricts T cell expansion and clonal diversity. Interestingly, once established, these DNA methylation programs are preserved during PD-L1 blockade therapy. In contrast, exhaustion-associated de novo DNA methylation programs are not acquired during a primary acute viral infection. This may explain why some virus-induced tumors show full response to PD-1/PD-L1 blockade, while others only show partial or no response.
Therefore, blocking of de novo DNA methylation appears to be an effective method to overcome exhaustion-induced resistance to anti-PD-1/PD-L1 therapy. In fact, in CD8 T cells that lack the ability to acquire de novo DNA methylation programs, TIM-3 expression appears to be lower than that in wild type (WT) chronic virus-infected CD8 T cells.60
Moreover, it should be noted that T cell exhaustion-related drug resistance is a risk factor not only for cells with chronic virus infection but also for other chronic antigen-presented cells. It deserves more clinical trials to prove the relationship between the exhaustion status of T cells and full, partial, or no response to PD-1/PD-L1 blockade. Besides, tumor-related virus or antigen may last for a period during the treatment, but PD-1/PD-L1 blockade cannot prevent de novo exhaustion-associated DNA methylation programs. These raise concerns that T cells that are activated or partially exhausted before treatment may become fully exhausted. Future clinical trials are required to shed light on the changes of exhaustion-associated DNA methylation during PD-1/PD-L1 blockade.
Conclusion
The biomarker-driven individualized therapies receive better clinical outcomes than therapies based only on tumor types, so that they have attracted much more attention in recent years. Although a lot of biomarkers have been detected, no single biomarker is sufficient for drug response prediction until now. Hence, prediction of drug response based on a network of biomarkers that compensated for each other’s limitations would optimize the therapy efficacy.
A successful anti-PD-1/PD-L1 therapy involves the elimination of suppressive tumors and rejuvenation of exhausted T cells, requiring complex considerations of different biomarkers (Figure 3). First, regarding tumor characteristics, biomarkers before the initiation of the treatment were centered on PD-L1 expression or MSI, including PD-L1 SNPs such as rs4143815 and rs2282055 compensative for PD-L1 expression, POLE mutations responsive in the MSS phenotype, and JAK1 and JAK2 mutations negative in the MSI phenotype. Biomarkers in tumor biopsies can also monitor PD-1/PD-L1 blockade, including newly occurred JAK1, JAK2, and B2M mutations that lead to resistance, and PD-L1 upregulation that indicates responsiveness. Second, regarding T cell rejuvenation, TIM-3 upregulation can be a sign of resistance, while the ratio of Ki67 to tumor burden provides a measurable “reinvigoration score”, both can be used for monitoring the therapy course. Moreover, exhaustion-associated DNA methylation appears as a candidate biomarker to predict the T cell rejuvenation ability before the initiation of the treatment.
 | Figure 3 A comprehensive network of predictive biomarkers for PD-1/PD-L1 blockade. |
In conclusion, although we are unable to list all biomarkers, we set up a comprehensive network including biomarkers describing characteristics of tumor biopsies and evaluating T cell reinvigoration, before and during PD-1/PD-L1 blockade (Figure 3). It is of great significance to explore more biomarkers to improve this network, so as to enhance the efficacy of anti-PD-1/PD-L1 therapy.
Acknowledgments
This review was supported by the National Natural Science Foundation of China (grants 81502353 and 61431019) and Beijing Obstetrics and Gynecology Hospital, Capital Medical University (FCYY201713). We would also like to show our gratitude to the “anonymous” reviewers for their insights that greatly improved the manuscript.
Author contributions
Qi Chen and Wentao Yue conceptualized, drafted, and revised the manuscript. Tianhe Li revised the manuscript. All authors contributed toward data analysis, drafting and revising the paper and agree to be accountable for all aspects of the work.
Disclosure
The authors report no conflicts of interest in this work.
References
Salmaninejad A, Khoramshahi V, Azani A, et al. PD-1 and cancer: molecular mechanisms and polymorphisms. Immunogenetics. 2018;70(2):73–86. | ||
Poole RM. Pembrolizumab: first global approval. Drugs. 2014;74(16):1973–1981. | ||
Sul J, Blumenthal GM, Jiang X, He K, Keegan P, Pazdur R. FDA Approval Summary: pembrolizumab for the treatment of patients with metastatic non-small cell lung cancer whose tumors express programmed death-ligand 1. Oncologist. 2016;21(5):643–650. | ||
Pai-Scherf L, Blumenthal GM, Li H, et al. FDA Approval Summary: pembrolizumab for treatment of metastatic non-small cell lung cancer: first-line therapy and beyond. Oncologist. 2017;22(11):1392–1399. | ||
Li H, Yu J, Liu C, et al. Time dependent pharmacokinetics of pembrolizumab in patients with solid tumor and its correlation with best overall response. J Pharmacokinet Pharmacodyn. 2017;44(5):403–414. | ||
Larkins E, Blumenthal GM, Yuan W, et al. FDA Approval Summary: pembrolizumab for the treatment of recurrent or metastatic head and neck squamous cell carcinoma with disease progression on or after platinum-containing chemotherapy. Oncologist. 2017;22(7):873–878. | ||
[No authors listed] Three drugs approved for urothelial carcinoma by FDA. Cancer Discov. 2017;7(7):659–660. | ||
Sheng J, Srivastava S, Sanghavi K, et al. Clinical pharmacology considerations for the development of immune checkpoint inhibitors. J Clin Pharmacol. 2017;57(suppl 10):S26–S42. | ||
Kazandjian D, Suzman DL, Blumenthal G, et al. FDA Approval Summary: nivolumab for the treatment of metastatic non-small cell lung cancer with progression on or after platinum-based chemotherapy. Oncologist. 2016;21(5):634–642. | ||
Weinstock C, Khozin S, Suzman D, et al. U.S. Food and Drug Administration Approval Summary: atezolizumab for metastatic non-small cell lung cancer. Clin Cancer Res. 2017;23(16):4534–4539. | ||
Ning YM, Suzman D, Maher VE, et al. FDA Approval Summary: atezolizumab for the treatment of patients with progressive advanced urothelial carcinoma after platinum-containing chemotherapy. Oncologist. 2017;22(6):743–749. | ||
[No authors listed] Nod for atezolizumab in advanced bladder cancer. Cancer Discov. 2017;7(6):OF4. | ||
Choy M. Pharmaceutical approval update. P T. 2017;42(6):366–371. | ||
Kaufman HL, Russell J, Hamid O, et al. Avelumab in patients with chemotherapy-refractory metastatic Merkel cell carcinoma: a multicentre, single-group, open-label, phase 2 trial. Lancet Oncol. 2016;17(10):1374–1385. | ||
Syed YY. Durvalumab: first global approval. Drugs. 2017;77(12):1369–1376. | ||
Ikeda S, Okamoto T, Okano S, et al. PD-L1 is upregulated by simultaneous amplification of the PD-L1 and JAK2 genes in non-small cell lung cancer. J Thorac Oncol. 2016;11(1):62–71. | ||
Budczies J, Mechtersheimer G, Denkert C, et al. PD-L1 (CD274) copy number gain, expression, and immune cell infiltration as candidate predictors for response to immune checkpoint inhibitors in soft-tissue sarcoma. Oncoimmunology. 2017;6(3):e1279777. | ||
Clave S, Pijuan L, Casadevall D, et al. CD274 (PDL1) and JAK2 genomic amplifications in pulmonary squamous-cell and adenocarcinoma patients. Histopathology. 2018;72(2):259–269. | ||
Giroux Leprieur E, Dumenil C, Julie C, et al. Immunotherapy revolutionises non-small-cell lung cancer therapy: results, perspectives and new challenges. Eur J Cancer. 2017;78:16–23. | ||
Apolo AB, Infante JR, Balmanoukian A, et al. Avelumab, an anti-programmed death-ligand 1 antibody, in patients with refractory metastatic urothelial carcinoma: results from a multicenter, phase Ib study. J Clin Oncol. 2017;35(19):2117–2124. | ||
Chow LQ, Haddad R, Gupta S, et al. Antitumor activity of pembrolizumab in biomarker-unselected patients with recurrent and/or metastatic head and neck squamous cell carcinoma: results from the phase Ib KEYNOTE-012 expansion cohort. J Clin Oncol. 2016;34(32):3838–3845. | ||
Maleki Vareki S, Garrigos C, Duran I. Biomarkers of response to PD-1/PD-L1 inhibition. Crit Rev Oncol Hematol. 2017;116:116–124. | ||
Balar AV, Castellano D, O’donnell PH, et al. First-line pembrolizumab in cisplatin-ineligible patients with locally advanced and unresectable or metastatic urothelial cancer (KEYNOTE-052): a multicentre, single-arm, phase 2 study. Lancet Oncol. 2017;18(11):1483–1492. | ||
Powles T, O’Donnell PH, Massard C, et al. Efficacy and safety of durvalumab in locally advanced or metastatic urothelial carcinoma: updated results from a phase 1/2 open-label study. JAMA Oncol. 2017;3(9):e172411. | ||
Sharma P, Retz M, Siefker-Radtke A, et al. Nivolumab in metastatic urothelial carcinoma after platinum therapy (CheckMate 275): a multicentre, single-arm, phase 2 trial. Lancet Oncol. 2017;18(3):312–322. | ||
Larkin J, Chiarion-Sileni V, Gonzalez R, et al. Combined nivolumab and ipilimumab or monotherapy in untreated melanoma. N Engl J Med. 2015;373(1):23–34. | ||
Srinivasan S, Clements JA, Batra J. Single nucleotide polymorphisms in clinics: fantasy or reality for cancer? Crit Rev Clin Lab Sci. 2016;53(1):29–39. | ||
Lee SY, Jung DK, Choi JE, et al. Functional polymorphisms in PD-L1 gene are associated with the prognosis of patients with early stage non-small cell lung cancer. Gene. 2017;599:28–35. | ||
Yeo MK, Choi SY, Seong IO, Suh KS, Kim JM, Kim KH. Association of PD-L1 expression and PD-L1 gene polymorphism with poor prognosis in lung adenocarcinoma and squamous cell carcinoma. Hum Pathol. 2017;68:103–111. | ||
Seetharamu N, Preeshagul IR, Sullivan KM. New PD-L1 inhibitors in non-small cell lung cancer – impact of atezolizumab. Lung Cancer (Auckl). 2017;8:67–78. | ||
Nomizo T, Ozasa H, Tsuji T, et al. Clinical impact of single nucleotide polymorphism in PD-L1 on response to nivolumab for advanced non-small-cell lung cancer patients. Sci Rep. 2017;7:45124. | ||
[No authors listed] First tissue-agnostic drug approval issued. Cancer Discov. 2017;7(7):656. | ||
Gelsomino F, Barbolini M, Spallanzani A, Pugliese G, Cascinu S. The evolving role of microsatellite instability in colorectal cancer: a review. Cancer Treat Rev. 2016;51:19–26. | ||
Dudley JC, Lin MT, Le DT, Eshleman JR. Microsatellite instability as a biomarker for PD-1 blockade. Clin Cancer Res. 2016;22(4):813–820. | ||
Overman MJ, Mcdermott R, Leach JL, et al. Nivolumab in patients with metastatic DNA mismatch repair-deficient or microsatellite instability-high colorectal cancer (CheckMate 142): an open-label, multicentre, phase 2 study. Lancet Oncol. 2017;18(9):1182–1191. | ||
Gong J, Wang C, Lee PP, Chu P, Fakih M. Response to PD-1 blockade in microsatellite stable metastatic colorectal cancer harboring a POLE mutation. J Natl Compr Canc Netw. 2017;15(2):142–147. | ||
Mehnert JM, Panda A, Zhong H, et al. Immune activation and response to pembrolizumab in POLE-mutant endometrial cancer. J Clin Invest. 2016;126(6):2334–2340. | ||
Santin AD, Bellone S, Buza N, et al. Regression of chemotherapy-resistant polymerase epsilon (POLE) ultra-mutated and MSH6 hyper-mutated endometrial tumors with nivolumab. Clin Cancer Res. 2016;22(23):5682–5687. | ||
Garcia-Diaz A, Shin DS, Moreno BH, et al. Interferon receptor signaling pathways regulating PD-L1 and PD-L2 expression. Cell Rep. 2017;19(6):1189–1201. | ||
Bellucci R, Martin A, Bommarito D, et al. Interferon-gamma-induced activation of JAK1 and JAK2 suppresses tumor cell susceptibility to NK cells through upregulation of PD-L1 expression. Oncoimmunology. 2015;4(6):e1008824. | ||
Shin DS, Zaretsky JM, Escuin-Ordinas H, et al. Primary resistance to PD-1 blockade mediated by JAK1/2 mutations. Cancer Discov. 2017;7(2):188–201. | ||
Zaretsky JM, Garcia-Diaz A, Shin DS, et al. Mutations associated with acquired resistance to PD-1 blockade in melanoma. N Engl J Med. 2016;375(9):819–829. | ||
Dong LQ, Shi Y, Ma LJ, et al. Spatial and temporal clonal evolution of intrahepatic cholangiocarcinoma. J Hepatol. Epub 2018 Mar 16. | ||
Li J, Yan S, Liu Z, et al. Multiregional sequencing reveals genomic alterations and clonal dynamics in primary malignant melanoma of the esophagus. Cancer Res. 2018;78(2):338–347. | ||
Schmidt F, Efferth T. Tumor heterogeneity, single-cell sequencing, and drug resistance. Pharmaceuticals (Basel). 2016;9(2):E33. | ||
Li R, Zhou M, Yue C, et al. Multiple single cell screening and DNA MDA amplification chip for oncogenic mutation profiling. Lab Chip. 2018;18(5):723–734. | ||
Vilain RE, Menzies AM, Wilmott JS, et al. Dynamic changes in PD-L1 expression and immune infiltrates early during treatment predict response to PD-1 blockade in melanoma. Clin Cancer Res. 2017;23(17):5024–5033. | ||
Das M, Zhu C, Kuchroo VK. Tim-3 and its role in regulating anti-tumor immunity. Immunol Rev. 2017;276(1):97–111. | ||
Koyama S, Akbay EA, Li YY, et al. Adaptive resistance to therapeutic PD-1 blockade is associated with upregulation of alternative immune checkpoints. Nat Commun. 2016;7:10501. | ||
Shayan G, Srivastava R, Li J, Schmitt N, Kane LP, Ferris RL. Adaptive resistance to anti-PD1 therapy by Tim-3 upregulation is mediated by the PI3K-Akt pathway in head and neck cancer. Oncoimmunology. 2017;6(1):e1261779. | ||
Hamilton G, Rath B. Avelumab: combining immune checkpoint inhibition and antibody-dependent cytotoxicity. Expert Opin Biol Ther. 2017;17(4):515–523. | ||
Donahue RN, Lepone LM, Grenga I, et al. Analyses of the peripheral immunome following multiple administrations of avelumab, a human IgG1 anti-PD-L1 monoclonal antibody. J Immunother Cancer. 2017;5:20. | ||
Huang AC, Postow MA, Orlowski RJ, et al. T-cell invigoration to tumour burden ratio associated with anti-PD-1 response. Nature. 2017;545(7652):60–65. | ||
Salem ML, El-Badawy A. Programmed death-1/programmed death-L1 signaling pathway and its blockade in hepatitis C virus immunotherapy. World J Hepatol. 2015;7(23):2449–2458. | ||
Jin Z, Yoon HH. The promise of PD-1 inhibitors in gastro-esophageal cancers: microsatellite instability vs. PD-L1. J Gastrointest Oncol. 2016;7(5):771–788. | ||
Goodman A, Patel SP, Kurzrock R. PD-1-PD-L1 immune-checkpoint blockade in B-cell lymphomas. Nat Rev Clin Oncol. 2017;14(4):203–220. | ||
Wherry EJ, Kurachi M. Molecular and cellular insights into T cell exhaustion. Nat Rev Immunol. 2015;15(8):486–499. | ||
Davar D, Wilson M, Pruckner C, Kirkwood JM. PD-1 blockade in advanced melanoma in patients with hepatitis C and/or HIV. Case Rep Oncol Med. 2015;2015:737389. | ||
Kwong YL, Chan TSY, Tan D, et al. PD1 blockade with pembrolizumab is highly effective in relapsed or refractory NK/T-cell lymphoma failing l-asparaginase. Blood. 2017;129(17):2437–2442. | ||
Ghoneim HE, Fan Y, Moustaki A, et al. De novo epigenetic programs inhibit PD-1 blockade-mediated T cell rejuvenation. Cell. 2017;170(1):142.e19–157.e19. |
 © 2018 The Author(s). This work is published and licensed by Dove Medical Press Limited. The
full terms of this license are available at https://www.dovepress.com/terms
and incorporate the Creative Commons Attribution
- Non Commercial (unported, 3.0) License.
By accessing the work you hereby accept the Terms. Non-commercial uses of the work are permitted
without any further permission from Dove Medical Press Limited, provided the work is properly
attributed. For permission for commercial use of this work, please see paragraphs 4.2 and 5 of our Terms.
© 2018 The Author(s). This work is published and licensed by Dove Medical Press Limited. The
full terms of this license are available at https://www.dovepress.com/terms
and incorporate the Creative Commons Attribution
- Non Commercial (unported, 3.0) License.
By accessing the work you hereby accept the Terms. Non-commercial uses of the work are permitted
without any further permission from Dove Medical Press Limited, provided the work is properly
attributed. For permission for commercial use of this work, please see paragraphs 4.2 and 5 of our Terms.