
Back to Journals » Infection and Drug Resistance » Volume 19
Drug Exposure Dictates Evolutionary Dynamics of Drug-Resistant Tuberculosis: A Longitudinal Cohort Study in Beijing, China
Authors Wen S  , Li H, Shi Y, Wei R, Ge F, Pang Y , Liu Y
Received 24 November 2025
Accepted for publication 16 March 2026
Published 23 March 2026 Volume 2026:19 580421
DOI https://doi.org/10.2147/IDR.S580421
Checked for plagiarism Yes
Review by Single anonymous peer review
Peer reviewer comments 2
Editor who approved publication: Dr Sandip Patil
Shufang Wen,1,* Haoran Li,2,* Yiheng Shi,3 Rongrong Wei,1 Fei Ge,1 Yu Pang,2 Yi Liu1
1Department of Biobank, Beijing Chest Hospital, Capital Medical University / Beijing Tuberculosis and Thoracic Tumor Research Institute, Beijing, People’s Republic of China; 2Department of Bacteriology and Immunology, Beijing Key Laboratory for Key Technologies in Tuberculosis Prevention and Control, Beijing Chest Hospital, Capital Medical University/Beijing Tuberculosis and Thoracic Tumor Research Institute, Beijing, People’s Republic of China; 3Department of Clinical Laboratory, Beijing Chest Hospital, Capital Medical University/Beijing Tuberculosis and Thoracic Tumor Research Institute, Beijing, People’s Republic of China
*These authors contributed equally to this work
Correspondence: Yi Liu, Department of Biobank, Beijing Tuberculosis and Thoracic Tumor Research Institute/Beijing Chest Hospital, Capital Medical University, No. 9 Beiguan Street, Tongzhou District, Beijing, 101149, People’s Republic of China, Tel +86-10-8950 9534, Email [email protected] Yu Pang, Department of Bacteriology and Immunology, Beijing Key Laboratory for Key Technologies in Tuberculosis Prevention and Control, Beijing Chest Hospital, Capital Medical University/Beijing Tuberculosis and Thoracic Tumor Research Institute, Postal No. 9, Beiguan Street, Tongzhou District, Beijing, 101149, People’s Republic of China, Email [email protected]
Background: Despite global efforts to combat drug-resistant tuberculosis (DR-TB), key gaps remain in understanding how resistance amplifies during treatment and the role of collateral drug effects in this process. Resistance amplification complicates management and undermines outcomes. This study aimed to identify the risk factors and collateral drug effects contributing to resistance amplification.
Methods: We conducted a retrospective, longitudinal cohort study of 133 DR-TB patients with paired phenotypic drug susceptibility tests (pDSTs) at Beijing Chest Hospital in Beijing, China, from January 2018 to January 2023. Patients were classified into “progression” and “non-progression” groups based on acquisition of new drug resistance. Multivariable logistic regression identified risk factors, and a restrictive cohort analysis assessed collateral drug effects.
Results: The median number of resistances per isolate increased significantly from 7.0 (IQR 5– 9) to 8.0 (IQR 6– 10) (P < 0.05), with 76 patients (57.1%) exhibiting resistance progression. A dominant trajectory was identified from isoniazid monoresistance (INH-Mono) to multidrug-/rifampicin-resistant TB (MDR/RR-TB) (9/14, 64.3%). In univariate analysis, bedaquiline (BDQ) use was associated with reduced progression (P=0.032), while pyrazinamide (PZA) use correlated with increased progression (P=0.035), though neither remained significant in multivariable models. Importantly, collateral effect analysis revealed that PZA exposure was strongly associated with acquired rifabutin (Rfb) resistance (OR, 5.94; 95% CI, 1.90– 18.53; P=0.001).
Conclusion: Resistance amplification during DR-TB treatment is frequent, with INH-Mono representing a high-risk transitional state. While BDQ may offer a protective effect, the strong collateral association between PZA and Rfb resistance highlights the need for careful regimen design. These findings underscore the importance of individualized, resistance-informed therapy to mitigate further resistance amplification in DR-TB patients.
Keywords: drug-resistant tuberculosis, acquired resistance, bedaquiline, pyrazinamide, collateral drug association
Introduction
Tuberculosis (TB), caused by the Mycobacterium tuberculosis (Mtb) complex, remains one of the most significant public health challenges worldwide. Globally, an estimated 10.8 million people fell ill with TB in 2023, resulting in approximately 1.25 million deaths.1 The emergence and spread of drug-resistant TB (DR-TB) pose a major threat to global health security. China represents a critical region in this landscape, ranking third globally in estimated TB incidence and fourth in new cases of MDR/RR-TB, accounting for 7.3% of the global total.1
The distribution and spread of DR-TB are influenced by a complex array of demographic and clinical determinants. Previous studies have identified factors such as male sex, older age, and socio-economic disparities as key variables affecting TB epidemiology. More importantly, clinical drivers such as a history of previous anti-TB treatment and poor treatment adherence represent primary risk factors for harboring resistant strains.2 The prolonged, multi-drug regimens required for treatment further promote the emergence of drug-resistant TB (DR-TB).3 Currently, the global treatment success rate for MDR/RR-TB remains under 70%, a stark contrast to the nearly 90% success rate for drug-susceptible TB, highlighting the inadequacy of existing strategies in halting resistance evolution.1
A key challenge in the management of MDR/RR-TB is not only the baseline resistance profile but also the dynamic resistance amplification that occurs during therapy. Isoniazid monoresistance (INH-Mono) serves as a quintessential starting point on this dangerous trajectory. Although often misperceived as a “mild” form of resistance in clinical practice,3,4 extensive research has confirmed that without precise and intensified treatment, INH-Mono cases are at a significantly elevated risk of progressing to MDR-TB.5,6 This stepwise evolution from lower- to higher-level resistance rapidly erodes the limited arsenal of effective drugs, markedly increasing the risk of treatment failure and mortality.1,5
While considerable attention has been paid to the mechanisms of resistance development and progression in DR-TB, the role of collateral drug effects, in which the use of one drug indirectly influences the susceptibility to others, has received limited exploration. Epidemiological studies have suggested that resistance to one drug (eg, INH) may predispose patients to resistance to other drugs (eg, RFP), but the specific interactions between anti-TB drugs and their collateral effects remain incompletely understood.7–14 This critical knowledge gap is particularly relevant in light of the increasingly complex regimens used to treat DR-TB, where drug interactions could play a significant role in resistance amplification.
Accordingly, the present study will commence with diverse initial resistance patterns, such as INH monoresistance, to systematically elucidate the evolutionary trajectories toward higher-level resistance. It will precisely identify and quantify the key clinical and population-based risk factors contributing to resistance amplification, while analyzing the synergistic effects of core therapeutic agents including PZA and BDQ on the acquisition of resistance to other anti-TB drugs. Through these endeavors, this study aims to systematically investigate the dynamic mechanisms and key drivers underlying resistance amplification in Mtb during treatment, with a focused emphasis on drug synergistic effects.
Materials and Methods
Study Setting
This study was conducted at Beijing Chest Hospital, Capital Medical University, in Beijing, China. As a national tertiary referral center specializing in tuberculosis and thoracic diseases, the hospital serves a diverse patient population referred from across the country, providing a comprehensive database for studying drug-resistant tuberculosis (DR-TB) evolutionary dynamics.
Study Design and Participant Selection
This study employed a retrospective, longitudinal cohort design. We reviewed the electronic medical records of patients with drug-resistant tuberculosis (DR-TB) hospitalized at Beijing Chest Hospital, Capital Medical University, between January 2018 and January 2023. The study protocol was approved by the Ethics Committee of Beijing Chest Hospital, Capital Medical University (Approval No. 2024 Clinical Review–Research–32). Due to the retrospective nature of the study and the use of de-identified data, the requirement for individual informed consent was waived by the Ethics Committee.
Initially, 553 DR-TB patients were screened from the hospital database. Through a consecutive sampling approach, 133 patients were ultimately included based on the following inclusion criteria: (i) At least two phenotypic drug susceptibility tests (pDSTs) for 16 anti-tuberculosis drugs during a single treatment episode; (ii) Complete data on the interim anti-TB treatment regimen; (iii) A baseline pDST result showing resistance to at least one drug. Exclusion criteria were: (i) the time interval between the two pDSTs was less than 18 months; (ii) Patients with exclusively extrapulmonary TB. The final cohort size was primarily determined by the strict requirement for paired longitudinal pDST results with a sufficient follow-up interval.
Based on the evolution of their resistance profiles between T1 and T2, patients were stratified into two groups: (i) the Resistance Progression Group, defined as patients who acquired phenotypic resistance to at least one additional drug at T2 to which they were susceptible at T1; and (ii) the Non-progression Group, defined as patients who demonstrated no newly acquired drug resistance at T2, including those with stable or de-escalating resistance profiles.
To isolate true collateral effects from direct selective pressures, we implemented a restrictive cohort design. When evaluating whether exposure to drug A influenced the acquisition of resistance to drug B, we restricted our analysis to patients who: (1) were susceptible to drug B at baseline (T1), and (2) did not receive drug B during the treatment interval between T1 and T2. This methodological approach eliminated the confounding effect of direct selection pressure from drug B, allowing us to identify genuine collateral effects where use of one drug (A) might influence susceptibility to another drug (B) through indirect mechanisms, such as metabolic alterations or selective evolutionary pressures on shared resistance pathways.
For all enrolled patients, we systematically collected demographic, clinical, and baseline laboratory data, as well as the complete results of the two pDSTs and the corresponding interim treatment regimens from the electronic medical record system.
Sample Size and Statistical Assumptions
As this was a retrospective cohort study utilizing all available eligible cases from a national referral center over a five-year period, a-priori sample size calculation (predefined alpha, beta, and confidence interval assumptions) was not performed. Instead, we employed a convenience sampling method, including all consecutive patients who met the stringent inclusion criteria to maximize the statistical power for identifying risk factors and collateral drug effects within this specific clinical setting.
Data Collection and Quality Control
Demographic, clinical, and laboratory data were extracted from the electronic medical record system by two independent researchers to ensure accuracy. The dataset was cleaned to resolve any inconsistencies or duplicates. To protect patient privacy, all clinical data were anonymized and de-identified prior to analysis, and access to the database was restricted to the research team.
Mycobacterial Identification and Drug-Susceptibility Testing
Species Identification
Isolates that failed to grow on p-nitrobenzoic acid medium and were presumptively identified as the Mtb complex underwent gene sequencing of 16S rRNA, rpoB, the 16S–23S rRNA internal transcribed spacer (ITS), and hsp65, per published protocols.15–17 Sequences were compared to the NCBI database via BLAST to confirm species.
Drug-Susceptibility Testing
Phenotypic susceptibility was determined using a commercial mycobacterial microdilution plate (Zhuhai YinKe Medical Engineering Co., Ltd.) employing the broth microdilution method. The minimum inhibitory concentration (MIC) for 16 anti-tuberculosis drugs was read per the manufacturer’s instructions. MIC was defined as the lowest drug concentration inhibiting 99% of bacterial growth, compared against drug-free negative controls and drug-containing positive controls of a reference susceptible strain. Susceptibility was interpreted against World Health Organization critical concentrations: MIC ≤ CC as susceptible (S) and MIC > CC as resistant (R). Drug panels and CCs are detailed in Supplementary Table S1.
Classification of Resistance Profiles
To characterize resistance evolution, we applied the 2021 WHO classification18 to T1 and T2 results, assigning each isolate to one of four categories: isoniazid-monoresistant (INH-Mono), poly-drug resistant (Poly-DR), multidrug-resistant/rifampicin-resistant (MDR/RR-TB), and pre–extensively drug-resistant (Pre-XDR-TB) (Supplementary Table S2). As pDST for BDQ and LZD was not performed, XDR-TB classification was not included.
Statistical Analysis
All analyses were conducted in R version 4.2.1. Categorical variables are presented as counts and percentages; between-group comparisons used the χ2-test or Fisher’s exact test. Continuous variables are reported as mean ± SD or median (IQR) and compared via Student’s t-test or Wilcoxon rank-sum test. Within-group changes in the number of resistant drugs were assessed by paired t-test, and shifts between S→R versus R→S by McNemar’s test.
Multivariable logistic regression was used to identify independent predictors of resistance progression. Variables with P < 0.10 in univariate analyses were included in the multivariate model. Adjusted odds ratios (aORs) with 95% confidence intervals (CIs) were calculated using the profile likelihood method.19 Collateral resistance effects were quantified using Fisher’s exact test to calculate odds ratios (ORs) and corresponding 95% CIs. For all analyses, a two-sided P value < 0.05 was considered statistically significant. Missing data (< 5% for all variables) were handled using complete case analysis.
Ethical Considerations
This study was conducted in accordance with the Declaration of Helsinki. All patient data were extracted from the hospital’s electronic database and fully anonymized prior to analysis. Access to the study database was restricted to authorized personnel to ensure participant confidentiality. As previously mentioned, the study was approved by the Ethics Committee of Beijing Chest Hospital, and informed consent was waived.
Results
Baseline Characteristics of the Study Cohort
A total of 133 patients with drug-resistant pulmonary tuberculosis (median age 52.0 years; 76.7% male) were included and stratified by phenotype progression into a progression group (n = 76) and a non-progression group (n = 57) (Figure 1). Demographic and clinical characteristics at baseline were comparable between the two groups (all P > 0.05). However, the non-progression group exhibited a significantly higher burden of baseline resistance: at timepoint 1 (T1), the mean number of drugs to which isolates were resistant was greater in the non-progression group than in the progression group (8.2 vs. 6.2; P = 0.005). Moreover, the proportions of patients with MDR/RR-TB and Pre-XDR-TB were higher in the non-progression group (51.0% [29/57] and 40.4% [23/57], respectively) (Table 1).
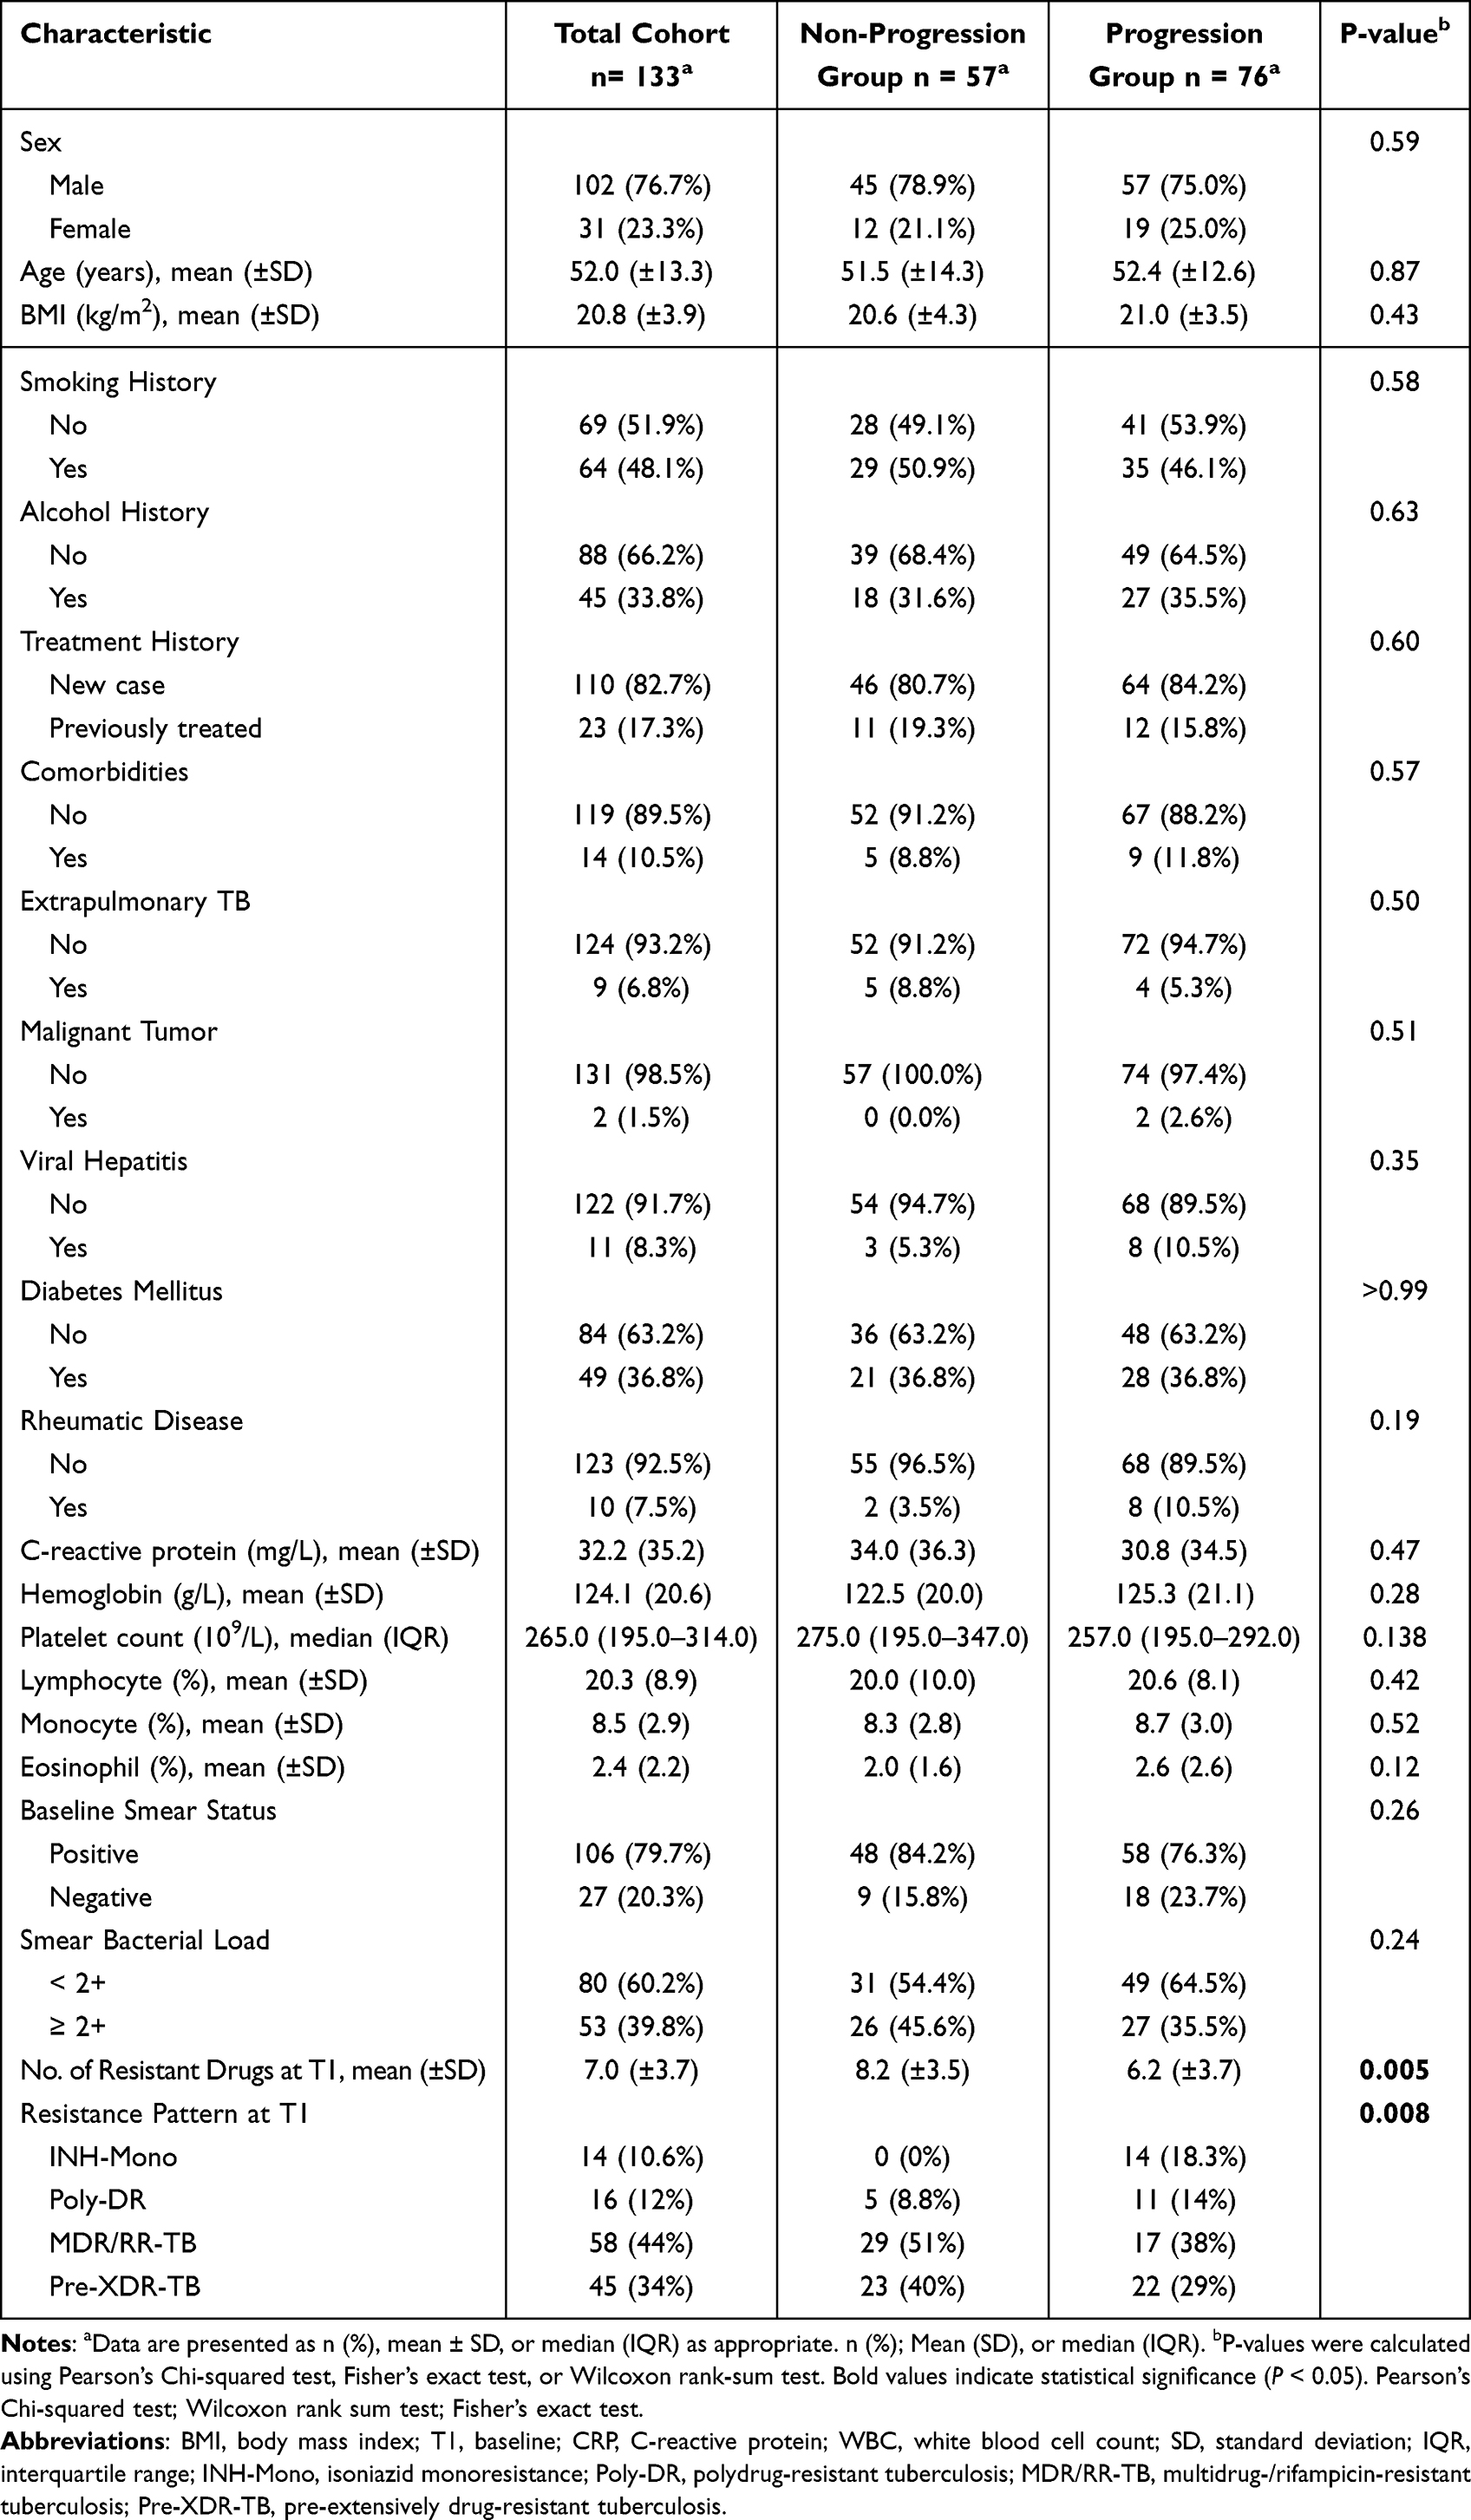 |
Table 1 Baseline Characteristics of the Drug-Resistant Tuberculosis Cohort, Stratified by Resistance Progression Status |
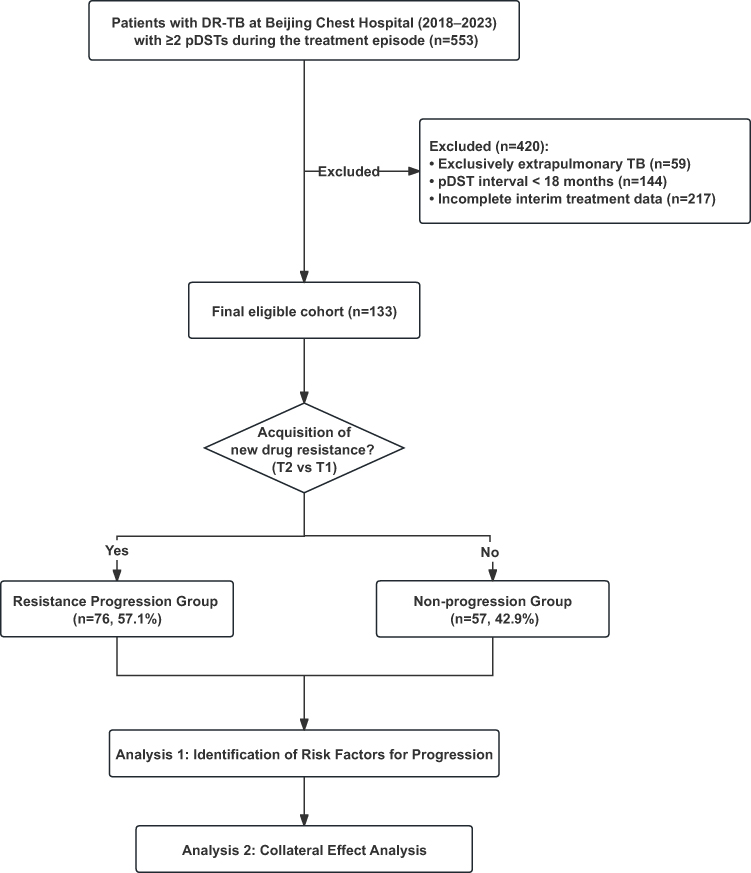 |
Figure 1 The workflow of this study. Analysis 1: Identification of Risk Factors for Progression; Analysis 2: Collateral Effect Analysis, Restrictive cohort analysis to assess the impact of specific drug exposures (e.g, BDQ, PZA) on resistance acquisition. Abbreviations: TB, tuberculosis; drug-resistant pulmonary TB, DR-TB; Drug Susceptibility Tests, pDSTs. |
Overall Increase in Drug-Resistance Burden During Treatment
Across all patients, the median number of resistant drugs increased from 7.0 at T1 to 8.0 at T2 (P < 0.05), indicating a significant rise in overall resistance during therapy (Figure 2A). Resistance rates for most individual drugs also increased post-treatment, with rifamycin-class antibiotics (rifampin, rifapentine, rifabutin) showing the steepest upward trends (Figure 2B). A longitudinal paired analysis of 16 drugs (Table 2) revealed that six agents, led by the rifamycins, demonstrated a strong unidirectional acquisition of resistance (Figure 2C). For example, the incidence of newly acquired rifampin resistance (S→R) was more than five times that of reversion (R→S) (16.5% vs. 3.0%, P < 0.001), and rifapentine and rifabutin showed similar patterns (both P < 0.05). Ethambutol, kanamycin, and levofloxacin also exhibited statistically significant rates of acquired resistance (all P < 0.05). In contrast, a minority of drugs (para-aminosalicylic acid, streptomycin, isoniazid) displayed higher reversion than acquisition rates, though none reached statistical significance.
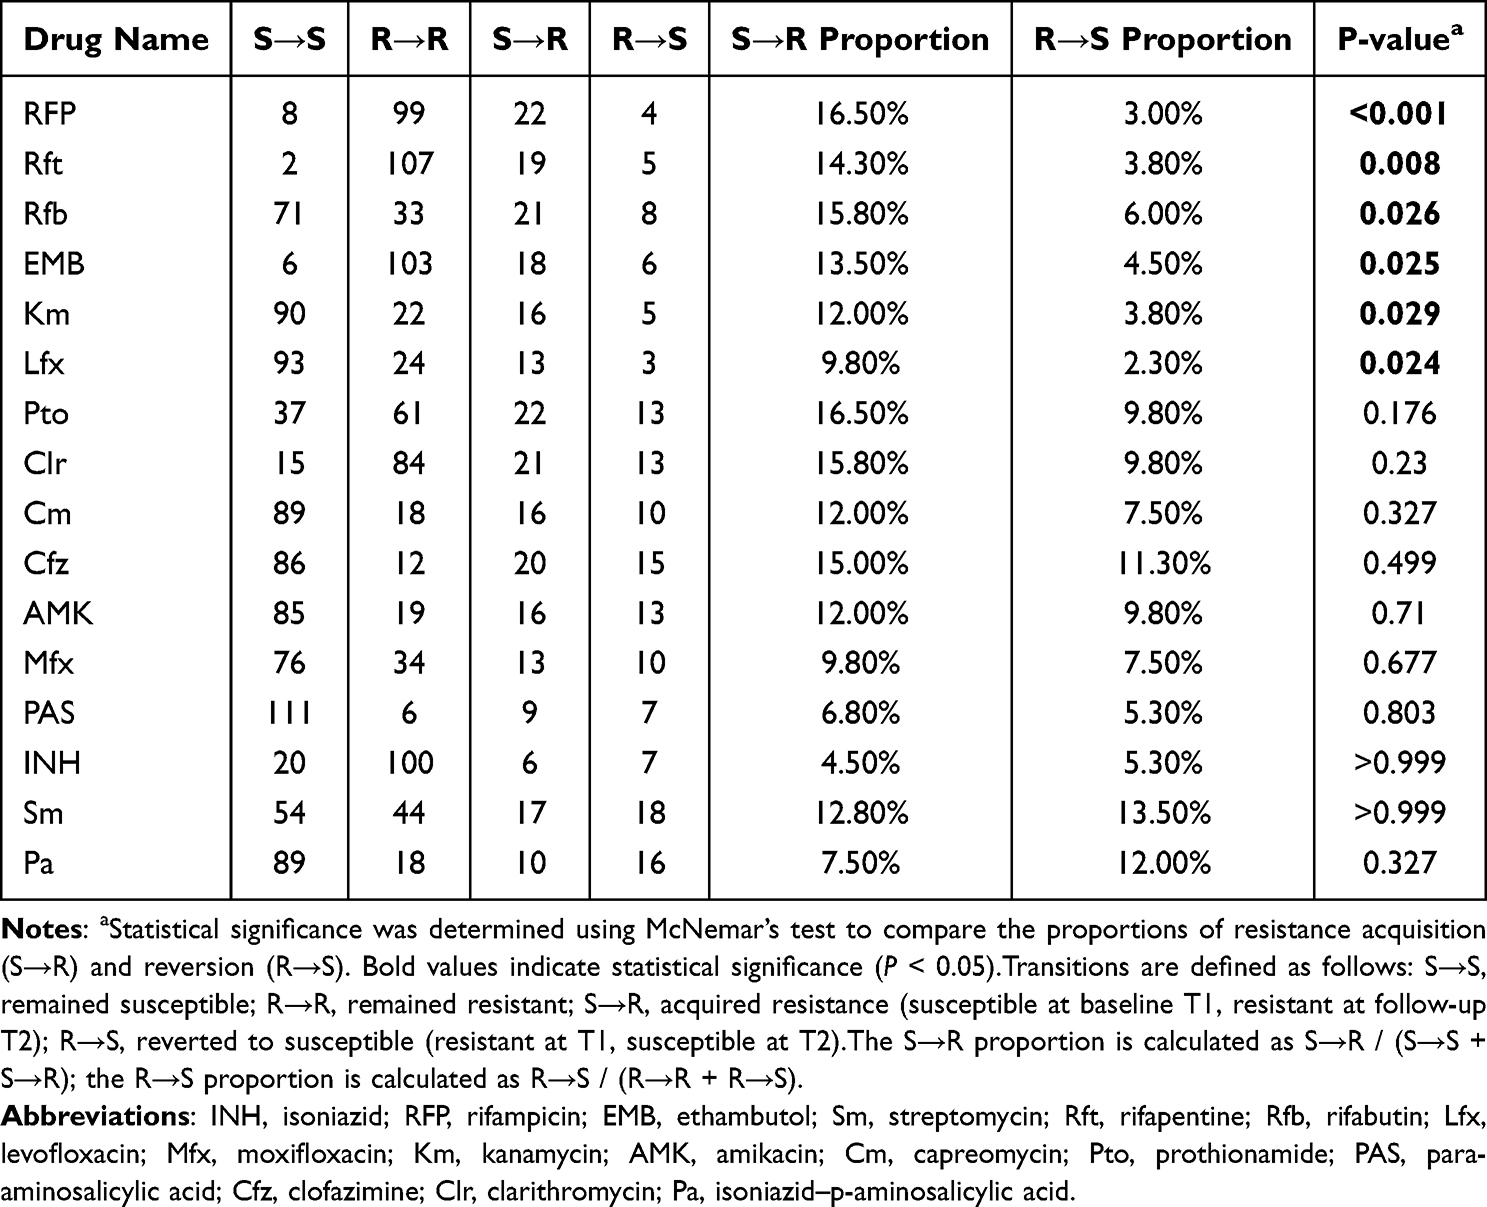 |
Table 2 Transitions in Drug Resistance Patterns Across Treatment in DR-TB Patients |
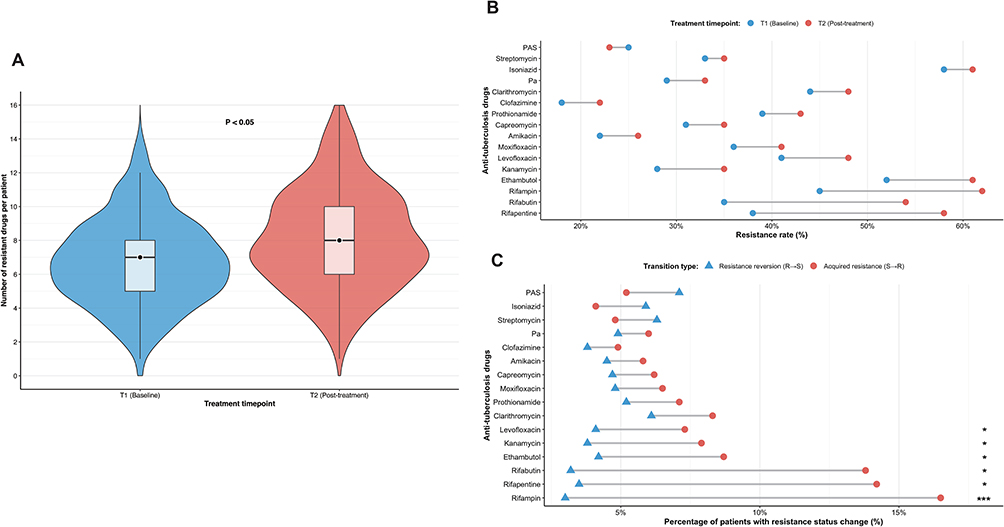 |
Figure 2 Dynamic Evolution of Drug-Resistance Burden and Profiles During Anti-Tuberculosis Treatment. (A) Distribution of the number of resistant drugs per isolate at baseline (T1) and post-treatment (T2). Median values increased significantly from 7.0 to 8.0 (Wilcoxon signed-rank test, P < 0.05). (B) Resistance rates for 16 anti-tuberculosis drugs at baseline (T1) and follow-up (T2). (C) The proportion of isolates showing resistance status changes for 16 drugs: acquired resistance (S→R, represented by red circles) and resistance reversion (R→S, represented by blue triangles). Statistical significance of transition patterns was determined using McNemar’s test. Abbreviations: T1, baseline; T2, post-treatment. Notes: P < 0.05; *P < 0.01; **P < 0.001. |
Dynamic Evolution of Resistance Patterns
Overall, for all patients, Table 3 shows the evolution of drug resistance patterns from T1 to T2. Among INH-Mono patients, most transitioned to MDR/RR-TB (9/14, 64.3%) or Pre-XDR-TB (4/14, 28.6%). Poly-DR patients showed relatively stable resistance, with 43.8% remaining in the same category and 43.8% progressing to MDR/RR-TB. The majority of MDR/RR-TB patients progressed to Pre-XDR-TB (9/58, 15.5%) or remained MDR/RR-TB (46/58, 79.3%). Pre-XDR-TB patients largely maintained their resistance category, with 80% remaining pre-XDR-TB at follow-up. When stratified by outcome group, these overall patterns diverged markedly. The non-progression cohort universally maintained stability or demonstrated resistance de-escalation (100%), whereas the progression cohort predominantly exhibited resistance spectrum amplification (76.3%). Stratified analysis further confirmed the distinct evolutionary trajectories between the two outcome groups (Figure 3).
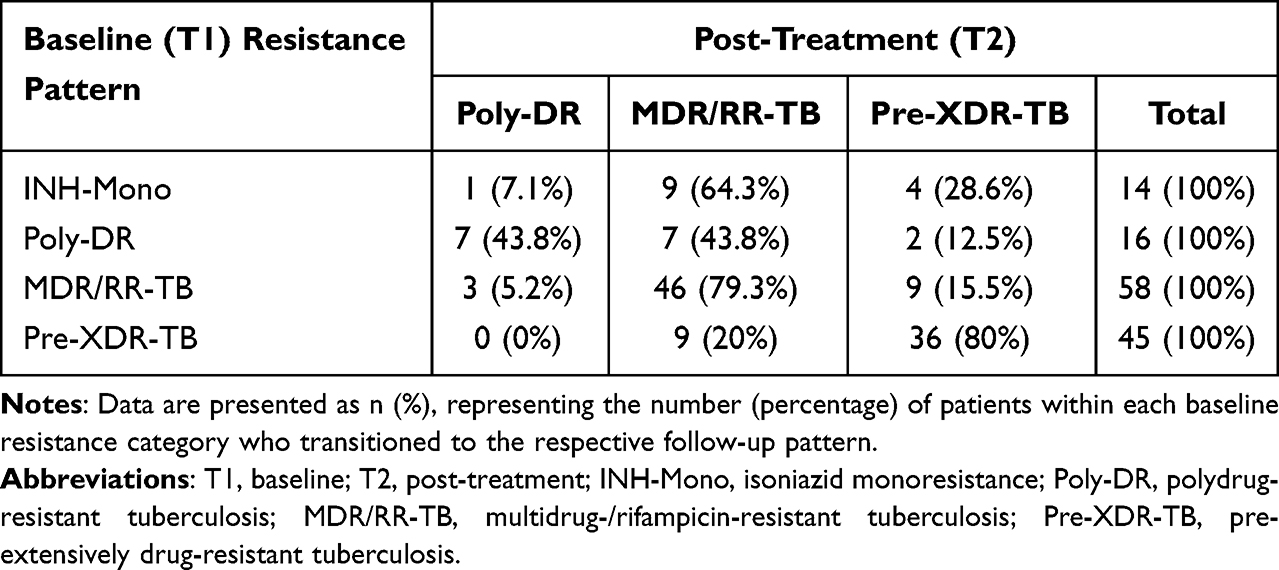 |
Table 3 Evolution of Drug Resistance Patterns |
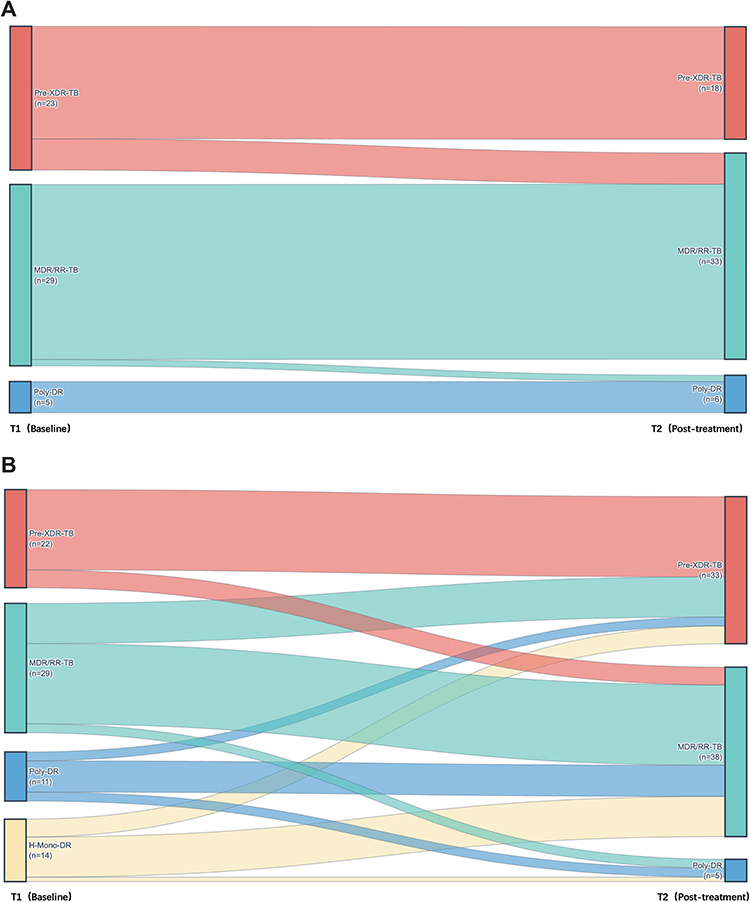 |
Figure 3 Evolution of drug resistance patterns from baseline (T1) to post-treatment (T2). (A) Sankey diagram illustrating resistance category transitions in the non-progression cohort, which demonstrated remarkable stability or partial resistance de-escalation. (B) Sankey diagram demonstrating the expansion of resistance spectrums in the progression cohort, characterized by a shift from lower-level resistance (e.g, INH monoresistance) toward more severe categories such as MDR/RR-TB and Pre-XDR-TB. Abbreviations: T1, baseline; T2, post-treatment; Pre-XDR-TB, pre-extensively drug-resistant tuberculosis; MDR/RR-TB, multidrug-resistant/rifampicin-resistant tuberculosis; Poly-DR, polydrug-resistant tuberculosis; H-Mono-DR, isoniazid-monoresistant tuberculosis. |
In the non-progression resistance cohort (Figure 3A), resistance patterns demonstrated remarkable stability with partial “downgrading”. Among MDR/RR-TB patients (n=29), 28 cases (96.6%) maintained the same resistance classification at T2, while among Pre-XDR-TB patients (n=23), 18 cases (78.3%) preserved their original classification, and 5 cases (21.7%) translated to MDR/RR-TB. Overall, resistance pattern transitions in this group were characterized predominantly by maintenance of the initial resistance profile or evolution toward less severe patterns, with no observed progression toward more severe resistance profiles.
In contrast, the progression resistance cohort (Figure 3B) exhibited a pronounced tendency toward resistance spectrum expansion. All patients with INH-Mono resistance at baseline (n=14, 100%) progressed to more severe resistance patterns, with 9 cases (64.3%) advancing to MDR/RR-TB, 4 cases (28.6%) to Pre-XDR-TB, and 1 case (7.1%) to Poly-DR. Similarly, among patients with poly-drug resistance (Poly-DR) at baseline, 9 cases (81.8%) progressed to MDR/RR-TB or Pre-XDR-TB (7 and 2 cases, respectively). Among patients with baseline MDR/RR-TB, the principal evolutionary pathway was further development to Pre-XDR-TB (9/29, 31.0%), while 18 cases (62.1%) maintained their original resistance pattern, underscoring the heterogeneous nature of drug resistance evolution even within clinically progressing cases.
Risk Factors for Resistance Progression
To identify factors associated with resistance progression, we first performed univariate comparisons of 19 anti-TB drugs used during the treatment interval between the progression and non-progression groups (Table 4). The usage frequencies of most drugs showed no significant differences. However, BDQ and PZA did differ significantly, BDQ was used more frequently in the non-progression group (26.3% vs. 11.8%, P = 0.032), whereas PZA was more common in the progression group (55.3% vs. 36.8%, P = 0.035).
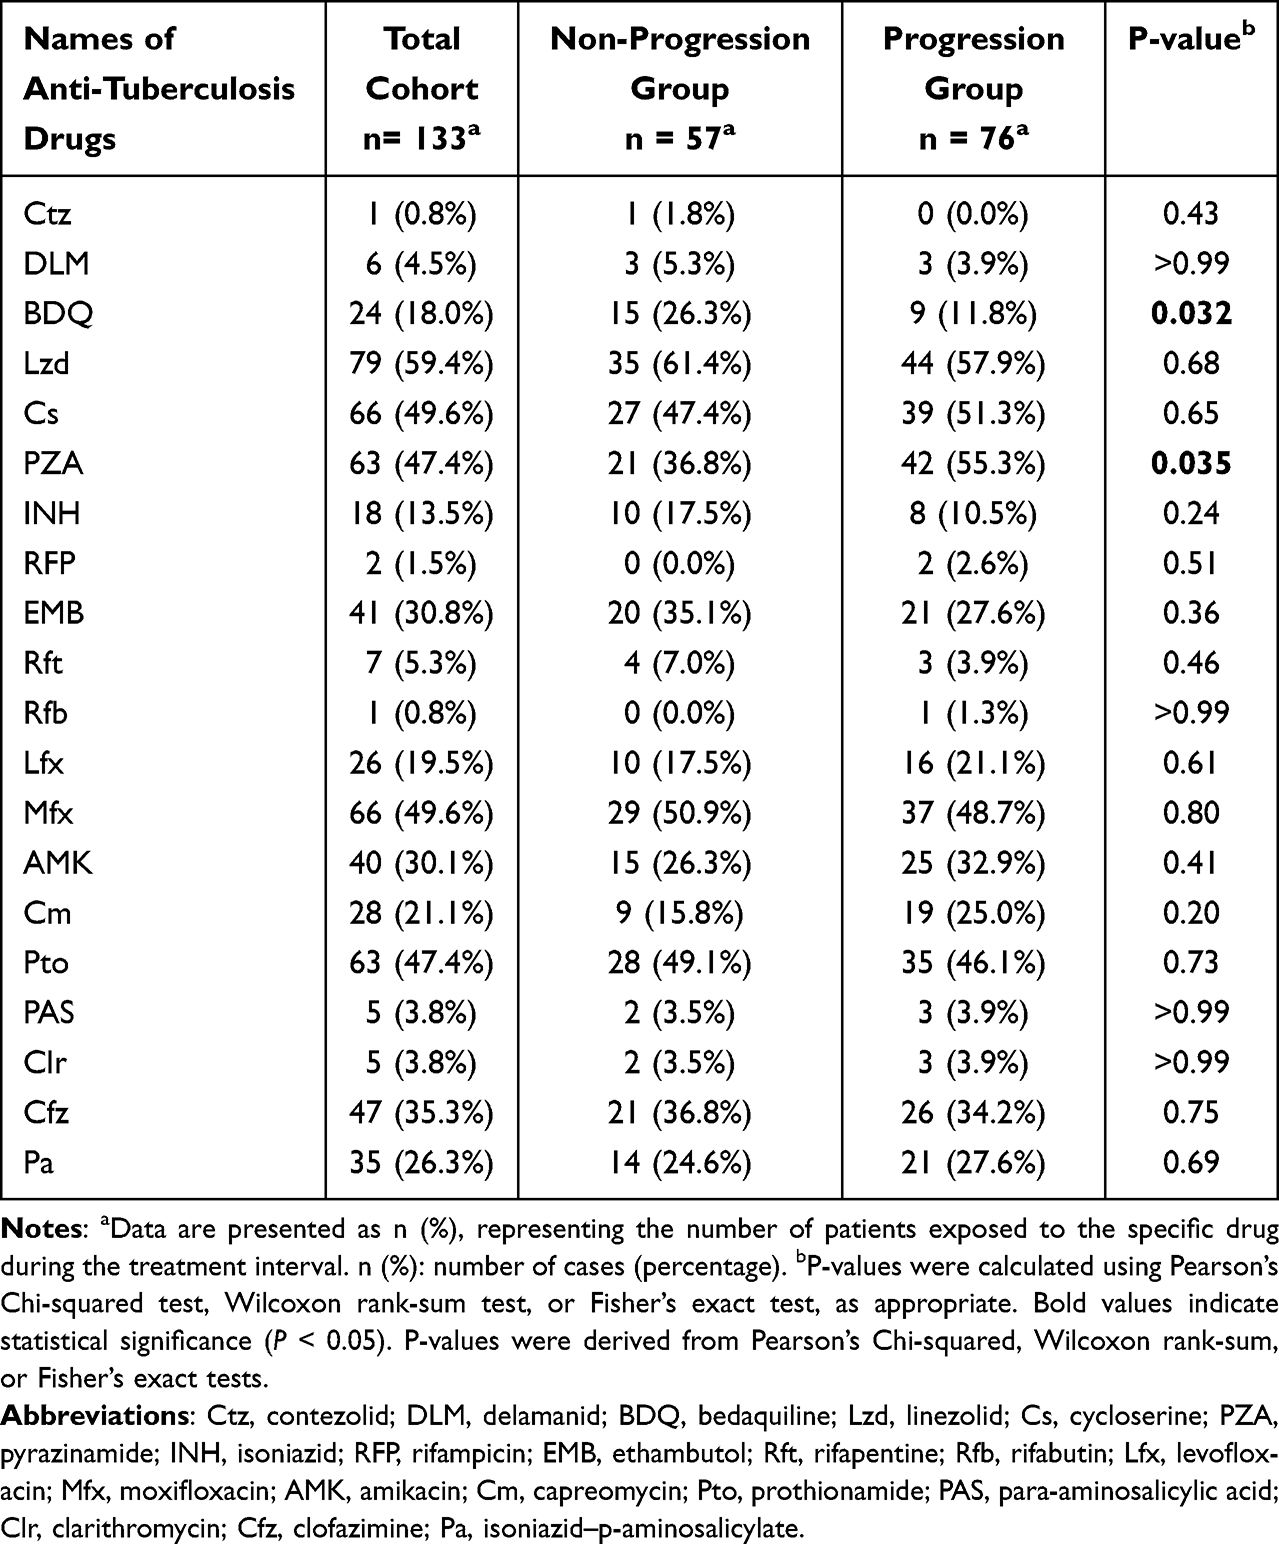 |
Table 4 Anti-Tuberculosis Drugs Used in Treatment Regimens for the Non-Progression and Progression Groups |
To assess the independence of these associations, we subsequently included these two drugs along with key baseline characteristics in a multivariable logistic regression model (Figure 4). After adjusting for potential confounders, neither of the associations observed in the univariate analysis remained statistically significant. Although BDQ use still showed a protective trend (aOR=0.47, 95% CI: 0.17–1.23, P=0.126), and PZA use a risk trend (aOR=1.74, 95% CI: 0.83–3.68, P=0.141), no independent predictors were identified. In summary, this analysis did not identify any single therapeutic or baseline factor that could independently predict resistance progression.
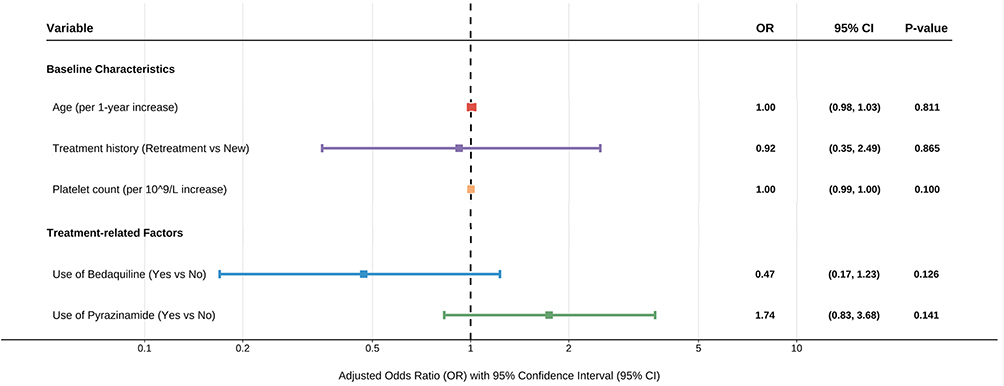 |
Figure 4 Multivariate logistic regression analysis of factors associated with resistance progression. The forest plot displays the adjusted odds ratios (aORs) for baseline clinical characteristics and specific drug exposures during treatment. Each square represents the point estimate of the aOR, and the horizontal bars represent the 95% confidence intervals (CIs). The dashed vertical line indicates the null effect (OR = 1). A P-value < 0.05 was considered statistically significant. Abbreviations: OR, odds ratio; aOR, adjusted odds ratio; CI, confidence interval. |
Collateral Effects of BDQ and PZA
Given that the multivariable analysis failed to identify independent risk factors for overall resistance progression, we focus on the micro-level interactions between drugs. To this end, we conducted an exploratory analysis using a restrictive cohort method to precisely evaluate whether BDQ and PZA exhibit collateral effects on resistance to other drugs (Figure 5).
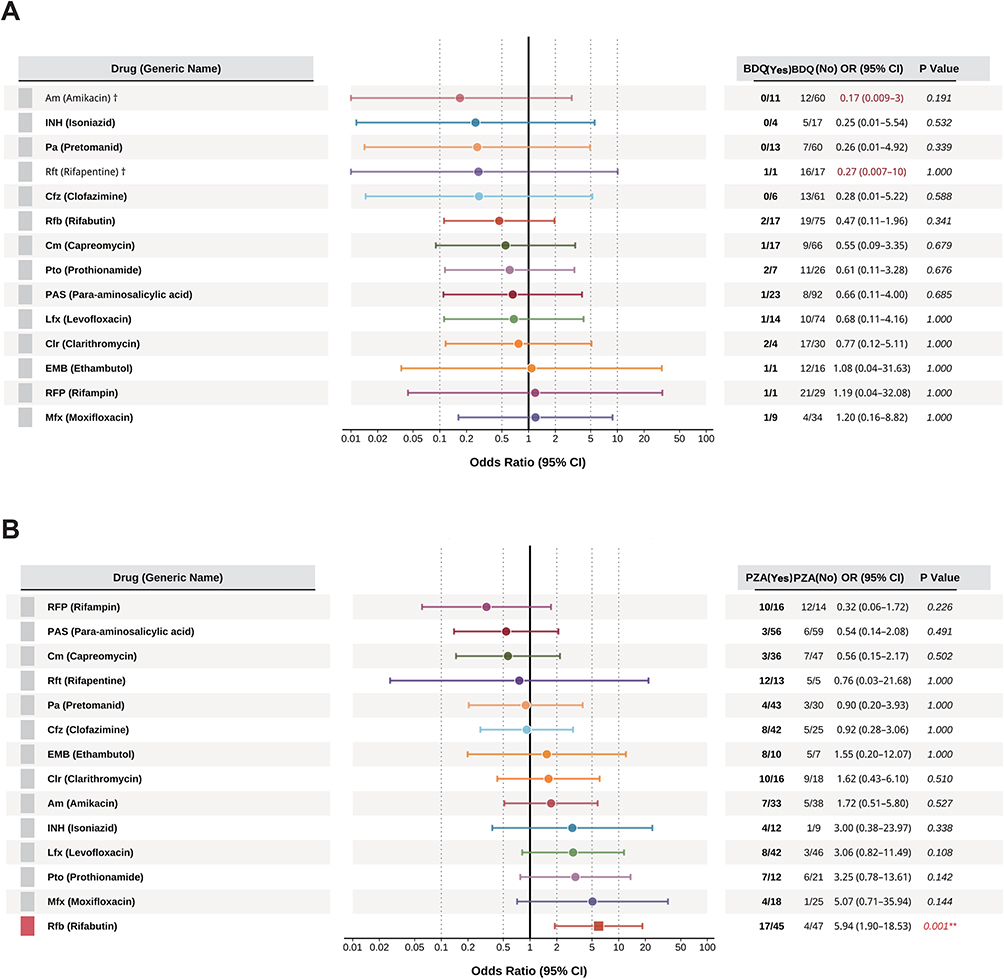 |
Figure 5 Collateral drug effects of bedaquiline (BDQ) and pyrazinamide (PZA) on resistance development. (A) Forest plot depicting the association between BDQ exposure and the subsequent acquisition of resistance to 13 companion drugs. (B) Forest plot showing the association between PZA exposure and acquired drug resistance. A significant collateral association was identified between PZA exposure and acquired rifabutin (Rfb) resistance (OR: 5.94; 95% CI: 1.90–18.53; P = 0.001). Abbreviations: BDQ, bedaquiline; PZA, pyrazinamide; Rfb, rifabutin; Am, amikacin; INH, isoniazid; Pa, pretomanid; Rft, rifapentine; Cfz, clofazimine; Cm, capreomycin; Pto, prothionamide; PAS, para-aminosalicylic acid; Lfx, levofloxacin; Clr, clarithromycin; EMB, ethambutol; RFP, rifampicin; Mfx, moxifloxacin. Notes: Odds ratios (ORs) and 95% confidence intervals (CIs) were estimated using a restrictive cohort approach. The dagger (†) indicates variables with extremely wide 95% CIs that were capped to fit the visual scale of the plot. Square symbols represent the point estimates of the OR. Statistical significance is indicated as follows: P < 0.05, *P < 0.01, **P < 0.001. |
First, we assessed the impact of these two drugs on the final resistance status at T2. The analysis for BDQ revealed no statistically significant effects on resistance to any of the other 13 drugs (Figure 5A). In sharp contrast, the analysis for PZA uncovered a strong synergistic effect with rifabutin (Rfb). After rigorously excluding patients treated with any rifamycin-class drug (RFP, Rft, Rfb) to control for cross-resistance, the results showed that the proportion of Rfb resistance among PZA users was 37.8% (17/45), significantly higher than in non-users (8.5%, 4/47), corresponding to a robust odds ratio (OR) of 5.94 (95% CI: 1.90–18.53, P=0.001) (Figure 5B).
To further investigate whether this synergy was directly manifested in the process of acquiring new resistance, we then analyzed the proportion of acquired resistance (S→R) for key drug pairs (Figure 6). This analysis strongly corroborated the PZA-Rfb synergistic relationship: among patients susceptible to Rfb at baseline (n=92) and not treated with any rifamycins, the proportion who subsequently acquired Rfb resistance was significantly higher among PZA users (17/45, 37.8%) compared to non-users (4/47, 8.5%, P=0.001) (Figure 6A). Furthermore, this analysis revealed a non-significant trend of synergy between PZA and moxifloxacin (Mfx) (6/27, 22.2% vs. 1/25, 4.0%, P=0.144) (Figure 6B), a non-significant trend of collateral sensitivity between BDQ and amikacin (AMK) (0/14, 0.0% vs. 3/15, 20.0%, P=0.191) (Figure 6C).
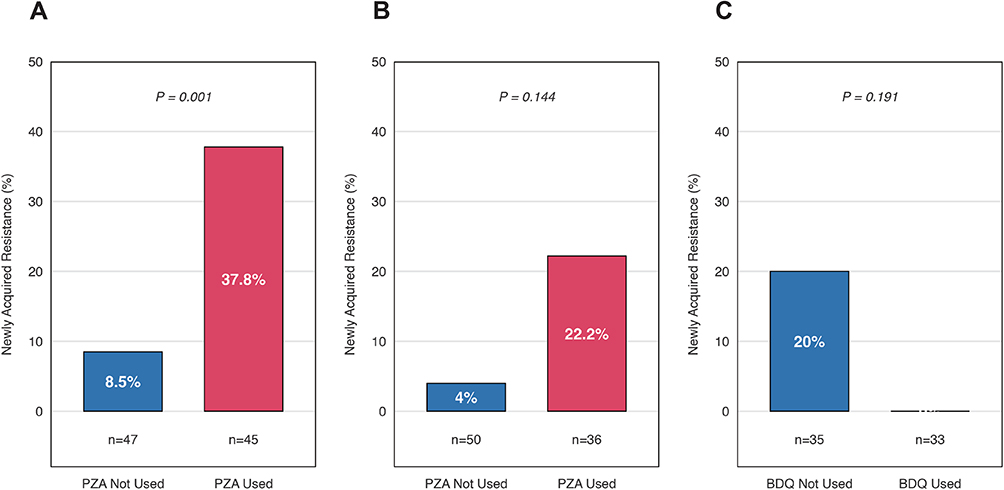 |
Figure 6 Impact of anti-tuberculosis drug usage on the acquisition of resistance to companion agents. (A) Effect of PZA usage on newly acquired Rfb resistance. (B) Effect of PZA usage on newly acquired Mfx resistance. (C) Effect of BDQ usage on newly acquired AMK resistance. Abbreviations: PZA, pyrazinamide; Rfb, rifabutin; Mfx, moxifloxacin; BDQ, bedaquiline; AMK, amikacin. Notes: Data are presented as the percentage of patients who acquired resistance during treatment. The analysis was restricted to patients who were phenotypically susceptible to the respective companion drugs at baseline (T1). P-values were calculated using Fisher’s exact test. |
Discussion
Our study provides a comprehensive analysis of the complex, nonlinear evolution of drug-resistant tuberculosis (DR-TB), highlighting two distinct evolutionary paths. Consistent with the growing recognition that resistance evolution is multifaceted and non-linear,20,21 our longitudinal cohort analysis demonstrates that DR-TB often acquires additional resistances during treatment. However, these evolutionary trajectories are not uniform or strictly cumulative. Instead, they exhibit significant heterogeneity and bifurcation, which has important clinical implications. The expansion of resistance reduces therapeutic options, leading to higher risks of treatment failure, relapse, and increased mortality, while also enhancing community transmission of resistant strains.22–24
Our data reveal two diverging outcomes for DR-TB strains. In the progression cohort, INH-Mono isolates were particularly unstable, with 100% evolving to more extensive resistance and 64.3% progressing to MDR/RR-TB. This rate significantly exceeds those reported in previous studies, such as a meta-analysis by Gegia et al, which found a progression rate of only 15%.5 These findings underscore that INH-Mono may represent a more significant threat than previously appreciated. They also support the World Health Organization’s post-2018 focus on the “early identification and aggressive intervention for INH-Mono cases”,18,25 suggesting that existing guidelines may not fully capture the urgency of intervention in these cases.
By contrast, the non-progression cohort, which had a higher baseline resistance burden, showed remarkable stability, with occasional reversion observed. Notably, 17.4% (4/23) of Pre-XDR-TB cases downgraded to MDR/RR-TB. This stabilization, or “downgrade”, likely reflects the fitness cost associated with highly resistant strains, which limits their ability to acquire additional mutations while maintaining viability.26–31 These findings point to distinct drivers of resistance evolution, which we explore further in the context of collateral drug effects.
Our multivariable regression analysis did not identify any specific treatment or baseline factor that independently predicted overall resistance progression. This suggests that the underlying drivers of resistance evolution may involve subtler drug–drug interactions. Inspired by the known phenomenon of INH resistance promoting rifampin resistance,24,25 we focused on collateral effects across different drug regimens. Contrary to our initial hypothesis of a broad synergistic effect of PZA on rifamycin resistance, we observed a highly specific association. PZA exposure did not correlate with resistance to RFP or Rft, but it was strongly linked to newly acquired Rfb resistance. After excluding cross-resistant cases, PZA exposure increased the odds of Rfb resistance nearly six-fold (37.8% vs. 8.5%, OR = 5.94; P = 0.001).
This PZA-Rfb association appears to arise from the distinct pharmacodynamics of PZA and rifabutin within mycobacterial cells. While all rifamycins target RNA polymerase, rifabutin has unique structural properties that enhance its intracellular penetration and accumulation.32,33 As a prodrug, PZA is converted to pyrazinoic acid, which acidifies the intracellular environment.34 We hypothesize that this acidification selectively alters efflux pump activity or modulates specific rpoB gene mutations responsible for Rfb resistance, while sparing other rifamycins.35–37 The clinical implications of this PZA-Rfb association are substantial. Rifabutin has become a critical treatment option for TB-HIV co-infected patients due to its reduced interaction with antiretroviral medications.38–42 Our findings suggest that TB patients with extensive PZA exposure, particularly those treated for MDR-TB with PZA-containing regimens and later developing recurrent disease, should undergo careful rifabutin susceptibility testing prior to retreatment. This is especially important in settings where routine rifabutin susceptibility testing is not performed, as failure to detect resistance could lead to ineffective treatment and further resistance amplification.
In contrast to PZA’s collateral effect, BDQ exhibited a potential protective trend against resistance progression. Although not statistically significant (aOR = 0.47, 95% CI: 0.17–1.23, P = 0.126), BDQ use was associated with no new amikacin resistance, compared to 20.0% in non-users (P = 0.191). This “protective signal” supports BDQ’s established role as a cornerstone in MDR-TB therapy.43–49 BDQ targets ATP synthase subunit c, encoded by the atpE gene,50 disrupting energy metabolism by inhibiting ATP synthesis.51 Unlike most anti-TB drugs that affect cell wall synthesis or nucleic acids, BDQ’s unique mechanism likely reduces cross-resistance with other drug classes. Furthermore, BDQ’s long half-life (5.5 months) ensures sustained bactericidal activity, creating an “immunological window” that may allow the host immune system to clear remaining pathogens before resistance can emerge.52–54
This study has several strengths, including its longitudinal cohort design and novel exploration of drug collateral effects. However, it also has limitations. As a single-center retrospective analysis with a modest sample size, the generalizability of our findings may be limited, and certain comparisons may be underpowered. Moreover, the reliance on phenotypic susceptibility testing for only 16 drugs, excluding newer agents such as BDQ and linezolid, restricts our ability to fully assess resistance evolution under contemporary all-oral regimens. Future studies should validate these findings in larger multicenter cohorts and integrate whole-genome sequencing to elucidate the molecular basis of the PZA-Rfb synergy and BDQ’s protective effect, ultimately refining treatment regimens.
In summary, our study systematically characterizes the diverse evolutionary paths of DR-TB during treatment, emphasizing the high-risk nature of INH-Mono cases. We also present the first clinical evidence of a specific collateral effect between PZA and rifabutin. These insights contribute to the precision-medicine framework, highlighting that individualized TB care must go beyond static susceptibility profiles and consider the dynamic risk of resistance evolution and inter-drug interactions. This approach will more effectively curb spectrum expansion and improve patient outcomes.
AI Usage Statement
Generative artificial intelligence tools (e.g, GPT-4) were used to assist in [e.g, language refinement, grammatical correction, suggesting stylistic improvements, or drafting parts of the cover letter and submission guidance based on the scientific content provided by the authors]. The authors thoroughly reviewed, edited, and verified all AI-generated content to ensure accuracy and scientific integrity, and take full responsibility for the final content of the manuscript.
Ethical Statement
The study was conducted in accordance with the Declaration of Helsinki. The study protocol was approved by the Ethics Committee of Beijing Chest Hospital, Capital Medical University (Approval No. 2024 Clinical Review–Research–32). The requirement for informed consent was waived by the Ethics Committee due to the retrospective nature of the study and the anonymity of the data. All patient data were treated with strict confidentiality and were anonymized prior to analysis.
Author Contributions
All authors made a significant contribution to the work reported, whether that is in the conception, study design, execution, acquisition of data, analysis and interpretation, or in all these areas; took part in drafting, revising or critically reviewing the article; gave final approval of the version to be published; have agreed on the journal to which the article has been submitted; and agree to be accountable for all aspects of the work.
Funding
This work was supported by grants from the Beijing Nova Program (20230484295, 20250484980), The Science and Technology Plan Project of Tongzhou District, Beijing (KJ2024CX028), and the Beijing Municipal Public Welfare Development and Reform Pilot Project for Medical Research Institutes (JYY2023-15). The funders had no role in the design and conduct of the study; collection, management, analysis, and interpretation of the data; preparation, review, or approval of the manuscript; and decision to submit the manuscript for publication.
Disclosure
All authors declare no competing interests.
References
1. World Health Organization. Global Tuberculosis Report 2024. Geneva: World Health Organization; 2024. Licence: CC BY-NC-SA 3.0 IGO.
2. Wang L, Zhang H, Ruan Y, et al. Tuberculosis prevalence in China, 1990–2010; a longitudinal analysis of national survey data. Lancet. 2014;383(9934):2057–16. doi:10.1016/S0140-6736(13)62639-2
3. Karo B, Kohlenberg A, Hollo V, et al. Isoniazid (INH) mono-resistance and tuberculosis (TB) treatment success: analysis of European surveillance data, 2002 to 2014. EuroSurveill. 2019;24(12):1800392. doi:10.2807/1560-7917.ES.2019.24.12.1800392
4. van der Werf MJ, Ködmön C, Hollo V, Sandgren A, Zucs P. Drug resistance among tuberculosis cases in the European Union and European Economic Area, 2007 to 2012. Euro Surveill. 2014;19(10):20733. doi:10.2807/1560-7917.es2014.19.10.20733
5. Gegia M, Winters N, Benedetti A, van Soolingen D, Menzies D. Treatment of isoniazid-resistant tuberculosis with first-line drugs: a systematic review and meta-analysis. Lancet Infect Dis. 2017;17(2):223–234. doi:10.1016/S1473-3099(16)30407-8
6. Hong Kong Chest Service/British Medical Research Council. Controlled trial of four thrice-weekly regimens and a daily regimen all given for 6 months for pulmonary tuberculosis. Lancet. 1981;317:171–4.
7. Pasipanodya JG, McIlleron H, Burger A, Wash PA, Smith P, Gumbo T. Serum drug concentrations predictive of pulmonary tuberculosis outcomes. J Infect Dis. 2013;208:1464–1473. doi:10.1093/infdis/jit352
8. Chigutsa E, Pasipanodya JG, Visser ME, et al. Impact of nonlinear interactions of pharmacokinetics and MICs on sputum bacillary kill rates as a marker of sterilizing effect in tuberculosis. Antimicrob Agents Chemother. 2015;59:38–45. doi:10.1128/AAC.03931-14
9. Zignol M, Dean AS, Alikhanova N, et al. Population-based resistance of Mycobacterium tuberculosis isolates to pyrazinamide and fluoroquinolones: results from a multicountry surveillance project. Lancet Infect Dis. 2016;16(10):1185–1192. doi:10.1016/S1473-3099(16)30190-6
10. Zhang Y, Shi W, Zhang W, Mitchison D. Mechanisms of Pyrazinamide Action and Resistance. Microbiol Spectr. 2014;2(4):MGM2–2013. doi:10.1128/microbiolspec.MGM2-0023-2013
11. Pang Y, Zhang Z, Wang Y, et al. Genotyping and prevalence of pyrazinamide- and moxifloxacin-resistant tuberculosis in China, 2000 to 2010. Antimicrob Agents Chemother. 2017;61(2):e02170–16. doi:10.1128/AAC.02170-16
12. Law S, Benedetti A, Oxlade O, Schwartzman K, Menzies D. Comparing cost-effectiveness of standardised tuberculosis treatments given varying drug resistance. Eur Respir J. 2014;43(2):566–581. doi:10.1183/09031936.00005613
13. Pradipta IS, Forsman LD, Bruchfeld J, Hak E, Alffenaar JW. Risk factors of multidrug-resistant tuberculosis: a global systematic review and meta-analysis. J Infect. 2018;77(6):469–478. doi:10.1016/j.jinf.2018.10.004
14. Tiberi S, Zumla A, Migliori GB. Multidrug and extensively drug-resistant tuberculosis: epidemiology, clinical features, management and treatment. Infect Dis Clin North Am. 2019;33(4):1063–1085. doi:10.1016/j.idc.2019.09.002
15. Pokam BDT, Yeboah-Manu D, Ofori S, et al. Prevalence of non-tuberculous mycobacteria among previously treated TB patients in the Gulf of Guinea, Africa. IJID Reg. 2022;3:287–292. doi:10.1016/j.ijregi.2022.05.003
16. Turenne CY, Tschetter L, Wolfe J, Kabani A. Necessity of quality-controlled 16S rRNA gene sequence databases: identifying nontuberculous Mycobacterium species. J Clin Microbiol. 2001;39(10):3637–3648. doi:10.1128/JCM.39.10.3638-3648.2001
17. Turenne C, Chedore P, Wolfe J, et al. Mycobacterium lacus sp. nov. a novel slowly growing, non-chromogenic clinical isolate. Int J Syst Evol Microbiol. 2002;52(Pt 6):2135–2140. doi:10.1099/00207713-52-6-2135
18. World Health Organization. WHO consolidated guidelines on tuberculosis. Module 4: treatment-drug-resistant tuberculosis treatment. World Health Organization; 2021. Available from: https://www.who.int/publications/i/item/9789240037591.
19. Cole SR, Chu H, Greenland S. Maximum likelihood, profile likelihood, and penalized likelihood: a primer. Am J Epidemiol. 2014;179(2):252–260. doi:10.1093/aje/kwt245
20. Nimmo C, Millard J, Faulkner V, Monteserin J, Pugh H, Johnson EO. Evolution of Mycobacterium tuberculosis drug resistance in the genomic era. Front Cell Infect Microbiol. 2022;12:954074. doi:10.3389/fcimb.2022.954074
21. Brynildsrud OB, Pepperell CS, Suffys P, et al. Global expansion of Mycobacterium tuberculosis lineage 4 shaped by colonial migration and local adaptation. Sci Adv. 2018;4:eaat5869. doi:10.1126/sciadv.aat5869
22. Ektefaie Y, Dixit A, Freschi L, Farhat MR. Globally diverse Mycobacterium tuberculosis resistance acquisition: a retrospective geographical and temporal analysis of whole genome sequences. Lancet Microbe. 2021;2:e96–e104. doi:10.1016/s2666-5247(20)30195-6
23. Hakamata M, Takihara H, Iwamoto T, et al. Higher genome mutation rates of Beijing lineage of Mycobacterium tuberculosis during human infection. Sci Rep. 2020;10(1). doi:10.1038/s41598-020-75028-2
24. Naghavi M, Vollset SE, Ikuta KS, et al; GBD 2021 antimicrobial resistance collaborators. Global burden of bacterial antimicrobial resistance 1990–2021: a systematic analysis with forecasts to 2050. Lancet. 2024;404(10459):1199–1226. doi:10.1016/S0140-6736(24)01867-1
25. Wang TY, Lin SM, Shie SS, et al. Clinical characteristics and treatment outcomes of patients with low- and high-concentration isoniazid-monoresistant tuberculosis. PLoS One. 2014;9(1):e86316. doi:10.1371/journal.pone.0086316
26. World Health Organization. WHO treatment guidelines for isoniazid-resistant tuberculosis - supplement to the WHO treatment guidelines for drug-resistant tuberculosis. Geneva: WHO; 2018. Available from: http://www.who.int/tb/publications/2018/WHO_guidelines_isoniazid_resistant_TB/en/.
27. Alame Emane AK, Guo X, Takiff HE, Liu S. Drug resistance, fitness and compensatory mutations in Mycobacterium tuberculosis. Tuberculosis. 2021;129:102091. doi:10.1016/j.tube.2021.102091
28. Pečerska J, Kühnert D, Meehan CJ, et al. Quantifying transmission fitness costs of multi-drug resistant tuberculosis. Epidemics-Neth. 2021;36:100471. doi:10.1016/j.epidem.2021.100471
29. Perdigao J, Silva C, Maltez F, et al. Emergence of multidrug-resistant Mycobacterium tuberculosis of the Beijing lineage in Portugal and Guinea-Bissau: a snapshot of moving clones by whole-genome sequencing. Emerg Microb Infect. 2020;9:1342–1353. doi:10.1080/22221751.2020.1774425
30. Reta MA, Alemnew B, Abate BB, Fourie PB. Prevalence of drug resistance-conferring mutations associated with isoniazid- and rifampicin-resistant Mycobacterium tuberculosis in Ethiopia: a systematic review and meta-analysis. J Glob Antimicrob Resist. 2021;26:207–218. doi:10.1016/j.jgar.2021.06.009
31. Pym AS, Saint-Joanis B, Cole ST. Effect of katG mutations on the virulence of Mycobacterium tuberculosis and the implication for transmission in humans. Infect Immun. 2002;70(9):4955–4960. doi:10.1128/IAI.70.9.4955-4960.2002
32. Lamont EA, Dillon NA, Baughn AD. The bewildering antitubercular action of pyrazinamide. Microbiol Mol Biol Rev. 2020;84(2):e00070–19. doi:10.1128/MMBR.00070-19
33. Scorpio A, Zhang Y. Mutations in pncA, a gene encoding pyrazinamidase/nicotinamidase, cause resistance to the antituberculous drug pyrazinamide in tubercle bacillus. Nat Med. 1996;2:662–667. doi:10.1038/nm0696-662
34. Allana S, Shashkina E, Mathema B, et al. pncA gene mutations associated with pyrazinamide resistance in drug-resistant tuberculosis, South Africa and Georgia. Emerg Infect Dis. 2017;23:491–495. doi:10.3201/eid2303.161034
35. Zheng X, Ning Z, Drobniewski F, et al. pncA mutations are associated with slower sputum conversion during standard treatment of multidrug-resistant tuberculosis. Int J Antimicrob Agents. 2017;49:183–188. doi:10.1016/j.ijantimicag.2016.10.012
36. Huy NQ, Lucie C, Hoa TTT, et al. Molecular analysis of pyrazinamide resistance in Mycobacterium tuberculosis in Vietnam highlights the high rate of pyrazinamide resistance-associated mutations in clinical isolates. Emerg Microbes Infect. 2017;6(10):e86. doi:10.1038/emi.2017.73
37. Lanoix JP, Ioerger T, Ormond A, et al. Selective inactivity of pyrazinamide against tuberculosis in C3HeB/FeJ mice is best explained by neutral pH of caseum. Antimicrob Agents Chemother. 2016;60:735–743. doi:10.1128/AAC.01370-15
38. Lanoix JP, Lenaerts AJ, Nuermberger EL. Heterogeneous disease progression and treatment response in a C3HeB/FeJ mouse model of tuberculosis. Dis Model Mech. 2015;8:603–610. doi:10.1242/dmm.019513
39. Zimhony O, Cox JS, Welch JT, Vilcheze C, Jacobs WR. Pyrazinamide inhibits the eukaryotic-like fatty acid synthetase I (FASI) of Mycobacterium tuberculosis. Nat Med. 2000;6:1043–1047. doi:10.1038/79558
40. Zimhony O, Vilcheze C, Arai M, Welch JT, Jacobs WR. Pyrazinoic acid and its n-propyl ester inhibit fatty acid synthase type I in replicating tubercle bacilli. Antimicrob Agents Chemother. 2007;51:752–754. doi:10.1128/AAC.01369-06
41. Shi W, Zhang X, Jiang X, et al. Pyrazinamide inhibits trans-translation in Mycobacterium tuberculosis. Science. 2011;333:1630–1632. doi:10.1126/science.1208813
42. Zhang S, Chen J, Shi W, Liu W, Zhang W, Zhang Y. Mutations in panD encoding aspartate decarboxylase are associated with pyrazinamide resistance in Mycobacterium tuberculosis. Emerg Microbes Infect. 2013;2:e34. doi:10.1038/emi.2013.38
43. Chopra S, Pai H, Ranganathan A. Expression, purification, and biochemical characterization of Mycobacterium tuberculosis aspartate decarboxylase, PanD. Protein Expr Purif. 2002;25:533–540. doi:10.1016/s1046-5928(02)00039-6
44. Zhang Y, Lai Y, Zhou S, et al. Inhibition of M. tuberculosis and human ATP synthase by BDQ and TBAJ-587. Nature. 2024;631(8020):409–414. doi:10.1038/s41586-024-07605-8
45. Koul A, Dendouga N, Vergauwen K, et al. Diarylquinolines target subunit c of mycobacterial ATP synthase. Nat Chem Biol. 2007;3(6):323–324. doi:10.1038/nchembio884
46. Guo H, Courbon GM, Bueler SA, Mai J, Liu J, Rubinstein JL. Structure of mycobacterial ATP synthase bound to the tuberculosis drug bedaquiline. Nature. 2021;589(7840):143–147. doi:10.1038/s41586-020-3004-3
47. Montgomery MG, Petri J, Spikes TE, Walker JE. Structure of the ATP synthase from Mycobacterium smegmatis provides targets for treating tuberculosis. Proc Natl Acad Sci U S A. 2021;118(47):e2111899118. doi:10.1073/pnas.2111899118
48. Preiss L, Langer JD, Yildiz Ö, et al. Structure of the mycobacterial ATP synthase Fo rotor ring in complex with the anti-TB drug bedaquiline. Sci Adv. 2015;1(4):e1500106. doi:10.1126/sciadv.1500106
49. Courbon GM, Palme PR, Mann L, Richter A, Imming P, Rubinstein JL. Mechanism of mycobacterial ATP synthase inhibition by squaramides and second generation diarylquinolines. EMBO J. 2023;42(15):e113687. doi:10.15252/embj.2023113687
50. Harikishore A, Saw WG, Ragunathan P, et al. Mutational analysis of mycobacterial F-ATP synthase subunit δ leads to a potent δ enzyme inhibitor. ACS Chem Biol. 2022;17(3):529–535. doi:10.1021/acschembio.1c00766
51. Tantry SJ, Markad SD, Shinde V, et al. Discovery of Imidazo(1,2-a]pyridine ethers and squaramides as selective and potent inhibitors of mycobacterial Adenosine Triphosphate (ATP) SYNTHESIS. J Med Chem. 2017;60(4):1379–1399. doi:10.1021/acs.jmedchem.6b01358
52. Wong CF, Lau AM, Harikishore A, et al. A systematic assessment of mycobacterial F1 -ATPase subunit ε’s role in latent ATPase hydrolysis. FEBS J. 2021;288(3):818–836. doi:10.1111/febs.15440
53. Hotra A, Ragunathan P, Ng PS, et al. Discovery of a novel mycobacterial F-ATP synthase inhibitor and its potency in combination with diarylquinolines. Angew Chem Int Ed Engl. 2020;59(32):13295–13304. doi:10.1002/anie.202002546
54. Furin J, Cox H, Pai M. Tuberculosis. Lancet. 2019;393(10181):1642–1656. doi:10.1016/S0140-6736(19)30308-3
 © 2026 The Author(s). This work is published and licensed by Dove Medical Press Limited. The
full terms of this license are available at https://www.dovepress.com/terms
and incorporate the Creative Commons Attribution
- Non Commercial (unported, 4.0) License.
By accessing the work you hereby accept the Terms. Non-commercial uses of the work are permitted
without any further permission from Dove Medical Press Limited, provided the work is properly
attributed. For permission for commercial use of this work, please see paragraphs 4.2 and 5 of our Terms.
© 2026 The Author(s). This work is published and licensed by Dove Medical Press Limited. The
full terms of this license are available at https://www.dovepress.com/terms
and incorporate the Creative Commons Attribution
- Non Commercial (unported, 4.0) License.
By accessing the work you hereby accept the Terms. Non-commercial uses of the work are permitted
without any further permission from Dove Medical Press Limited, provided the work is properly
attributed. For permission for commercial use of this work, please see paragraphs 4.2 and 5 of our Terms.