Back to Journals » Risk Management and Healthcare Policy » Volume 13
Drinking Frequency but not Years may be Associated with Lower Urinary Tract Symptoms: Result from a Large Cross-Sectional Survey in Chinese Men
Authors Lu Z, Wu C, Zhang J, Ye Y, Zhang Z, Liao M, Huang L, Tian J ![]() , Tan A, Mo Z
, Tan A, Mo Z
Received 17 November 2019
Accepted for publication 19 May 2020
Published 23 June 2020 Volume 2020:13 Pages 633—642
DOI https://doi.org/10.2147/RMHP.S238012
Checked for plagiarism Yes
Review by Single anonymous peer review
Peer reviewer comments 2
Editor who approved publication: Dr Kent Rondeau
Zheng Lu,1,* Chunlei Wu,2,3,* Jiange Zhang,2,4,* Yu Ye,2,5 Zhifu Zhang,2,6 Ming Liao,2 Lin Huang,2 Jiarong Tian,2 Aihua Tan,2 Zengnan Mo1,2
1Department of Urology, First Affiliated Hospital of Guangxi Medical University, Nanning, Guangxi Zhuang Autonomous Region, People’s Republic of China; 2Center for Genomic and Personalized Medicine, Guangxi Medical University, Nanning, Guangxi Zhuang Autonomous Region, People’s Republic of China; 3Urology Department, First Affiliated Hospital of Xinxiang Medical University, Weihui City, Henan Province, People’s Republic of China; 4Department of Urology, Second Affiliated Hospital of Guangxi Medical University, Nanning, Guangxi Zhuang Autonomous Region, People’s Republic of China; 5Emergency Department, Second Affiliated Hospital of Guangxi Medical University, Nanning, Guangxi Zhuang Autonomous Region, People’s Republic of China; 6Department of Urology, Minzu Hospital of Guangxi Zhuang Autonomous Region, Nanning, People’s Republic of China
*These authors contributed equally to this work
Correspondence: Zengnan Mo
Department of Urology, First Affiliated Hospital of Guangxi Medical University, 6 Shuangyong Road, Nanning 530021, Guangxi Zhuang Autonomous Region, People’s Republic of China
Tel/ Fax +86 0771-5353342
Email [email protected]
Objective: To evaluate the effect of the drinking frequency and years on lower urinary tract symptoms (LUTS) in a large Chinese male population.
Methods: The current data were obtained from a consecutive series of 3,229 men aged 18– 79 who participated in a routine physical examination in Fangchenggang First People’s Hospital, Guangxi, China. During a face-to-face interview, the detailed demographic variables about alcohol consumption, potential confounding factors were collected. LUTS were assessed by International Prostate Symptom Score (IPSS) and defined as total LUTS, irritative (IRR) and obstructive (OBS) symptoms, respectively. Multivariate logistic regression analysis was used to evaluate the risk of total LUTS, IRR and OBS symptoms affected by alcohol consumption.
Results: The prevalence of moderate to severe LUTS was 8.3% and apparently increased with age (P< 0.001). A significant distribution presented in age, alcohol consumption, BMI, cigarette smoking, education attainment and hypertension among different strata of LUTS severity (P< 0.05). Men who drank 1– 2 times per week were less likely to have OBS symptoms (OR=0.45, 95% CI=0.29– 0.70) regardless of age (OR=0.52, 95% CI=0.33– 0.82) or multivariate adjusted (OR=0.52, 95% CI=0.33– 0.83). Nevertheless, we did not observe a significant negative or positive association presented between drinking years and the risk of total LUTS, OBS and IRR symptoms.
Conclusion: The current results imply that moderate drinking frequency may be protective against LUTS, and drinking years did not relate to worsening or improving LUTS.
Keywords: observational study, alcohol consumption, urinary tract, epidemiology
Introduction
Lower urinary tract symptoms (LUTS) are greatly prevalent disorders among different age groups of men, and have become the main component of urology and andrology outpatients.1 The etiologies are complex so that LUTS usually cannot be treated thoroughly and have become a heavy burden for most of these patients. To date, perhaps age is the only risk factor which has been well established for LUTS due to the evidence that LUTS develop with increasing age,2–4 maybe it can mainly be accounted for by benign prostatic enlargement with increasing age, but not all men have an enlarged prostate when suffering LUTS.
Recently, systemic metabolic disturbances (such as obesity,5,6 diabetes,7,8 and dyslipidemia5) have been considered as important risk factors for LUTS. Changes in lifestyle can modulate the systemic metabolic perturbations. Alcohol consumption as an important lifestyle factor could improve insulin sensitivity9 and decrease the risk of benign prostatic hyperplasia.10 Additionally it still constitutes the indispensable element of dining customs of people. So it can be inferred there should be some associations present between alcohol consumption and LUTS, and this topic is very important to investigate.
Several epidemiological studies have investigated the effect of alcohol consumption on LUTS,11–15 but the results were inconsistent. Two studies reported that the amount of alcohol consumption was related positively with LUTS,11,13 but the other two studies showed that drinking frequency was inversely related with LUTS,12,14 whereas there were no significant association s between alcohol consumption and the deterioration of LUTS in a Korean male study.15 However, we observed that previous researches rarely involved the number of drinking years. Furthermore, there is a lack of evidence of an association between alcohol consumption and LUTS from Chinese men. Thus, using the data from the Fangchenggang Area Male Health and Examination Survey (FAMHES), we aimed to evaluate the association between the drinking frequency and number of drinking years and total LUTS, irritative (IRR) and obstructive (OBS) symptoms in a large Chinese male population.
Materials and Methods
Overall Design and Study Population
The current study was based on the Fangchenggang Area Male Health and Examination Survey (FAMHES), which was designed to investigate the effects of environmental and genetic factors and their interaction with the development of age-related chronic diseases.16 Briefly, the FAMHES was a population-based study which was conducted among non-institutionalized Chinese men aged from 17 to 88 years old in Guangxi. A comprehensive demographic and health survey was conducted among a series of 4,303 men who participated in a large-scale routine physical examination at the Medical Centre in Fangchenggang First People’s Hospital from September 2009 to December 2009. A total of 3,593 people completed the data collection interviews. The response rate was 83.5%.3 All the participants provided written informed consents. The survey had received approval from the ethics committee of the First Affiliated Hospital of Guangxi Medical University (Approval number: 2008-KY-004) and was conducted in accordance with the Declaration of Helsinki.
In the current study, the participants we enrolled were relatively healthy, but those who had obvious causes of LUTS were excluded. The details were as follow: 1) 138 men did not give complete questionnaire information, so lacked the information about alcohol consumption and other biochemical indicators; 2) 36 men who had a medical history of pelvic, prostate or other surgery who needed a plug in ureter; 3) 86 men were currently troubled by chronic prostatitis (CP); 4) 104 men were treated with medication such as non-steroidal anti-inflammatory drugs, antibiotics and glucocorticoid which might affect the evaluation of LUTS. Finally, 3,229 participants were enrolled in the current study.
Data Collection
All subjects came from those who participated in a large-scale routine health examination in the Medical Examination Centre of Fangchenggang First People’s Hospital. Data about demographic characteristics, lifestyle characteristics, health status, medical history, urologic symptoms and medication use in the past month were collected using a standardized questionnaire and conducted during a face-to-face interview by the trained physician. Anthropometrics (height, body weight, and waist circumference) were measured using a standardized protocol which had been described elsewhere.3 About 15 mL fasting venous blood specimens were collected between 8:00 and 10:00 in the morning, then the relevant biochemical indicators were measured in the clinical laboratory of Fangchenggang First People’s Hospital.
The Definition of Lower Urinary Tract Symptoms
LUTS was evaluated by the Chinese translation version of the International Prostate Symptoms Score (IPSS). The IPSS questionnaire contains two parts. The first part is the prior seven items, the symptoms evaluation of LUTS, with an ordered answer in each item which can be scored from 0 to 5 and have an overall score of 0 to 35. The other part is the eighth item that is used to assess the quality of life (QoL). In the current study, prevalence of moderate or severe total LUTS, OBS and IRR symptoms were used to evaluate the risk degree of LUTS. The detailed definitions are as follows: overall IPSS ≥8, obstructive symptoms (incomplete emptying, intermittency, weak stream and straining) ≥5 and irritative symptoms (frequency, urgency and nocturia) ≥4.13,17
The Assessment of Alcohol Consumption and Covariates
In the current study, we mainly investigated the effect of alcohol consumption on LUTS according to the drinking frequency and years. All subjects were asked “have you ever drunk at least one type of alcohol (including beer, wine and distillate spirit) in your lifetime?”, and those who answered “yes” were further required to provide the drinking frequency and when they drank alcohol the first time. Then the drinking frequency was defined as never, <1 time per week, 1–2 times per week, 3–4 times per week and ≥5 times per week and calculated the drinking years from the first time of alcohol consumption to the present. In the current study, the number of never, <1 time per week, 1–2 times per week, 3–4 times per week and ≥5 times per week alcohol consumption were 362, 1,340, 798, 402 and 327 respectively. The drinking years ranged from 0 years to 64.4 years, and the average was 17.1 years.
In addition, potential confounding factors were collected and controlled in our analyses. Detailed contents were as follow: age (years) was divided into five classes (18–29; 30–39; 40–49; 50–59 and ≥60); BMI was categorized as <24.0, 24.0–27.9, or ≥28.0 kg/m2, then all the participants were defined as one of three types: normal weight (BMI <24.0 kg/m2), overweight (BMI =24.0–27.9 kg/m2), or obese (BMI ≥28.0 kg/m2);18 Cigarette smoking habit was defined as never, current (daily smoking, >6 months), and former (cessation of smoking, >6 months); Physical activity were those who reported having regular exercise (eg, walking, playing ball, running, and so on) every week, and then defined as none, 1–2, 3–4 and ≥5 times per week; Due to the 9 years of compulsory education in the People's Republic of China, the educational attainment of subjects was divided into two groups according to the years of education (0–9 and ≥10 years). Then hypertension was defined as contractive pressure ≥140 mmHg or diastolic pressure ≥90 mmHg or self-reported a history of hypertension. Detailed information about the method of anthropometric measurements has been described elsewhere.19
All the subjects were required to offer about 15 mL fasting venous blood specimens in the morning between 8:00 and 10:00, then relevant biochemical indicators were measured on the same day. Triglycerides, high-density lipoprotein (HDL), cholesterol, low-density lipoprotein (LDL), and serum glucose were measured enzymatically on an automatic chemistry analyzer (Dade Behring, Newark, DE, USA) with original reagents in the clinical laboratory of Fangchenggang First people’s hospital. The definition of dyslipidemia was total cholesterol >6.22 mmol/L or LDL >4.14 mmol/L or triglycerides >2.26 mmol/L or HDL <1.04 mmol/L, and those who had a fasting blood glucose level ≥7.0 mmol/L or self reported history of diabetes were considered as diabetic.20,21
Statistical Analysis
The chi square test (χ2) was used to compare the constituent ratio of subjects’ characteristics based on the different strata of LUTS severity: none (IPSS=0); mild (IPSS=1–7); moderate or severe (IPSS≥8). All subjects were categorized into five groups according to their drinking frequency (never, <1 time per week, 1–2 times per week, 3–4 times per week and ≥5 times per week). Then every category was divided into three groups based on their tertile value of the number of drinking years when comparing the risk of total LUTS, IRR and OBS symptoms (moderate or severe symptoms vs none or mild symptoms) with the drinking years, but it was based on the quartile value for the overall number of subjects due to the large number of samples (Tables 1 and 2). Then separate binary logistic regression models were created to assess the effect of the drinking frequency and years on total LUTS, IRR and OBS symptoms. Potential confounding factors included age, physical activity, BMI, cigarette smoking, education, diabetes mellitus, hypertension and dyslipidemia were controlled in multivariate logistic regression models. Odds ratios (ORs) and 95% confidence intervals (CIs) were used to describe the magnitude of the association, and A P-value <0.05 was considered statistically significant (two-tailed). All data analyses were performed with SPSS 17.0 (SPSS, Chicago, IL, USA).
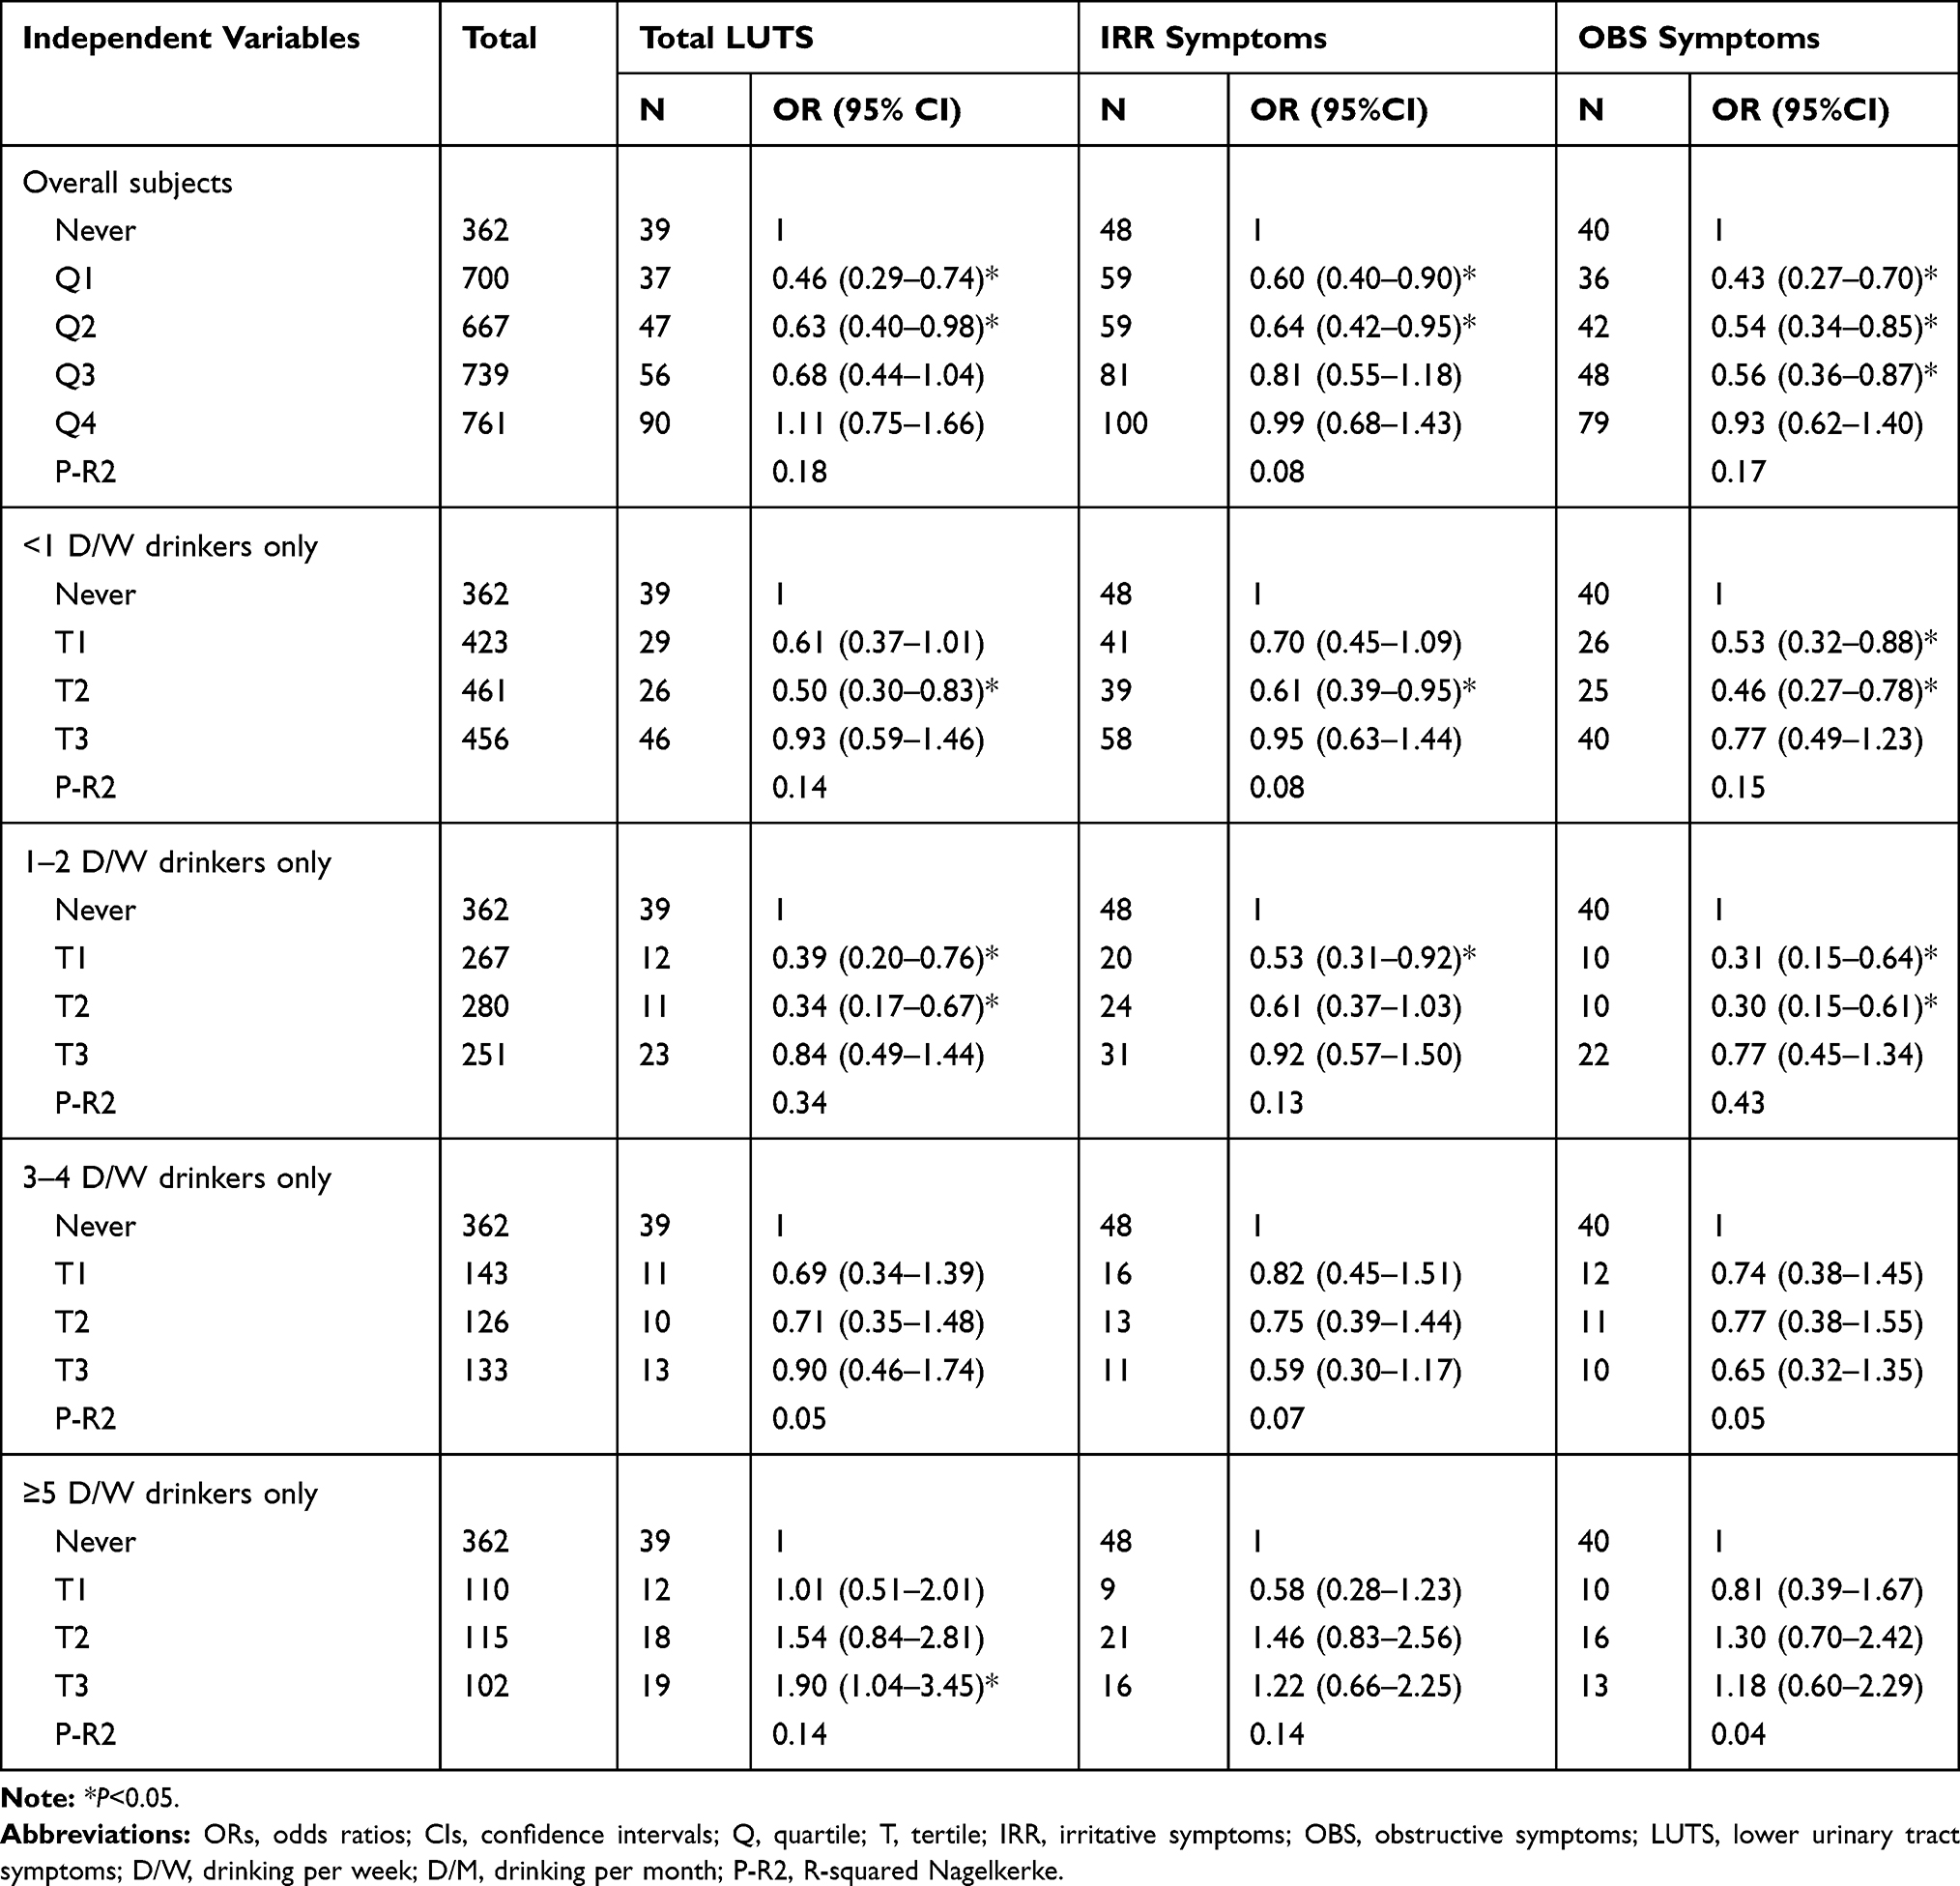 |
Table 1 Unadjusted ORs and 95%CIs for Total LUTS, IRR and OBS Symptoms by the Drinking Years |
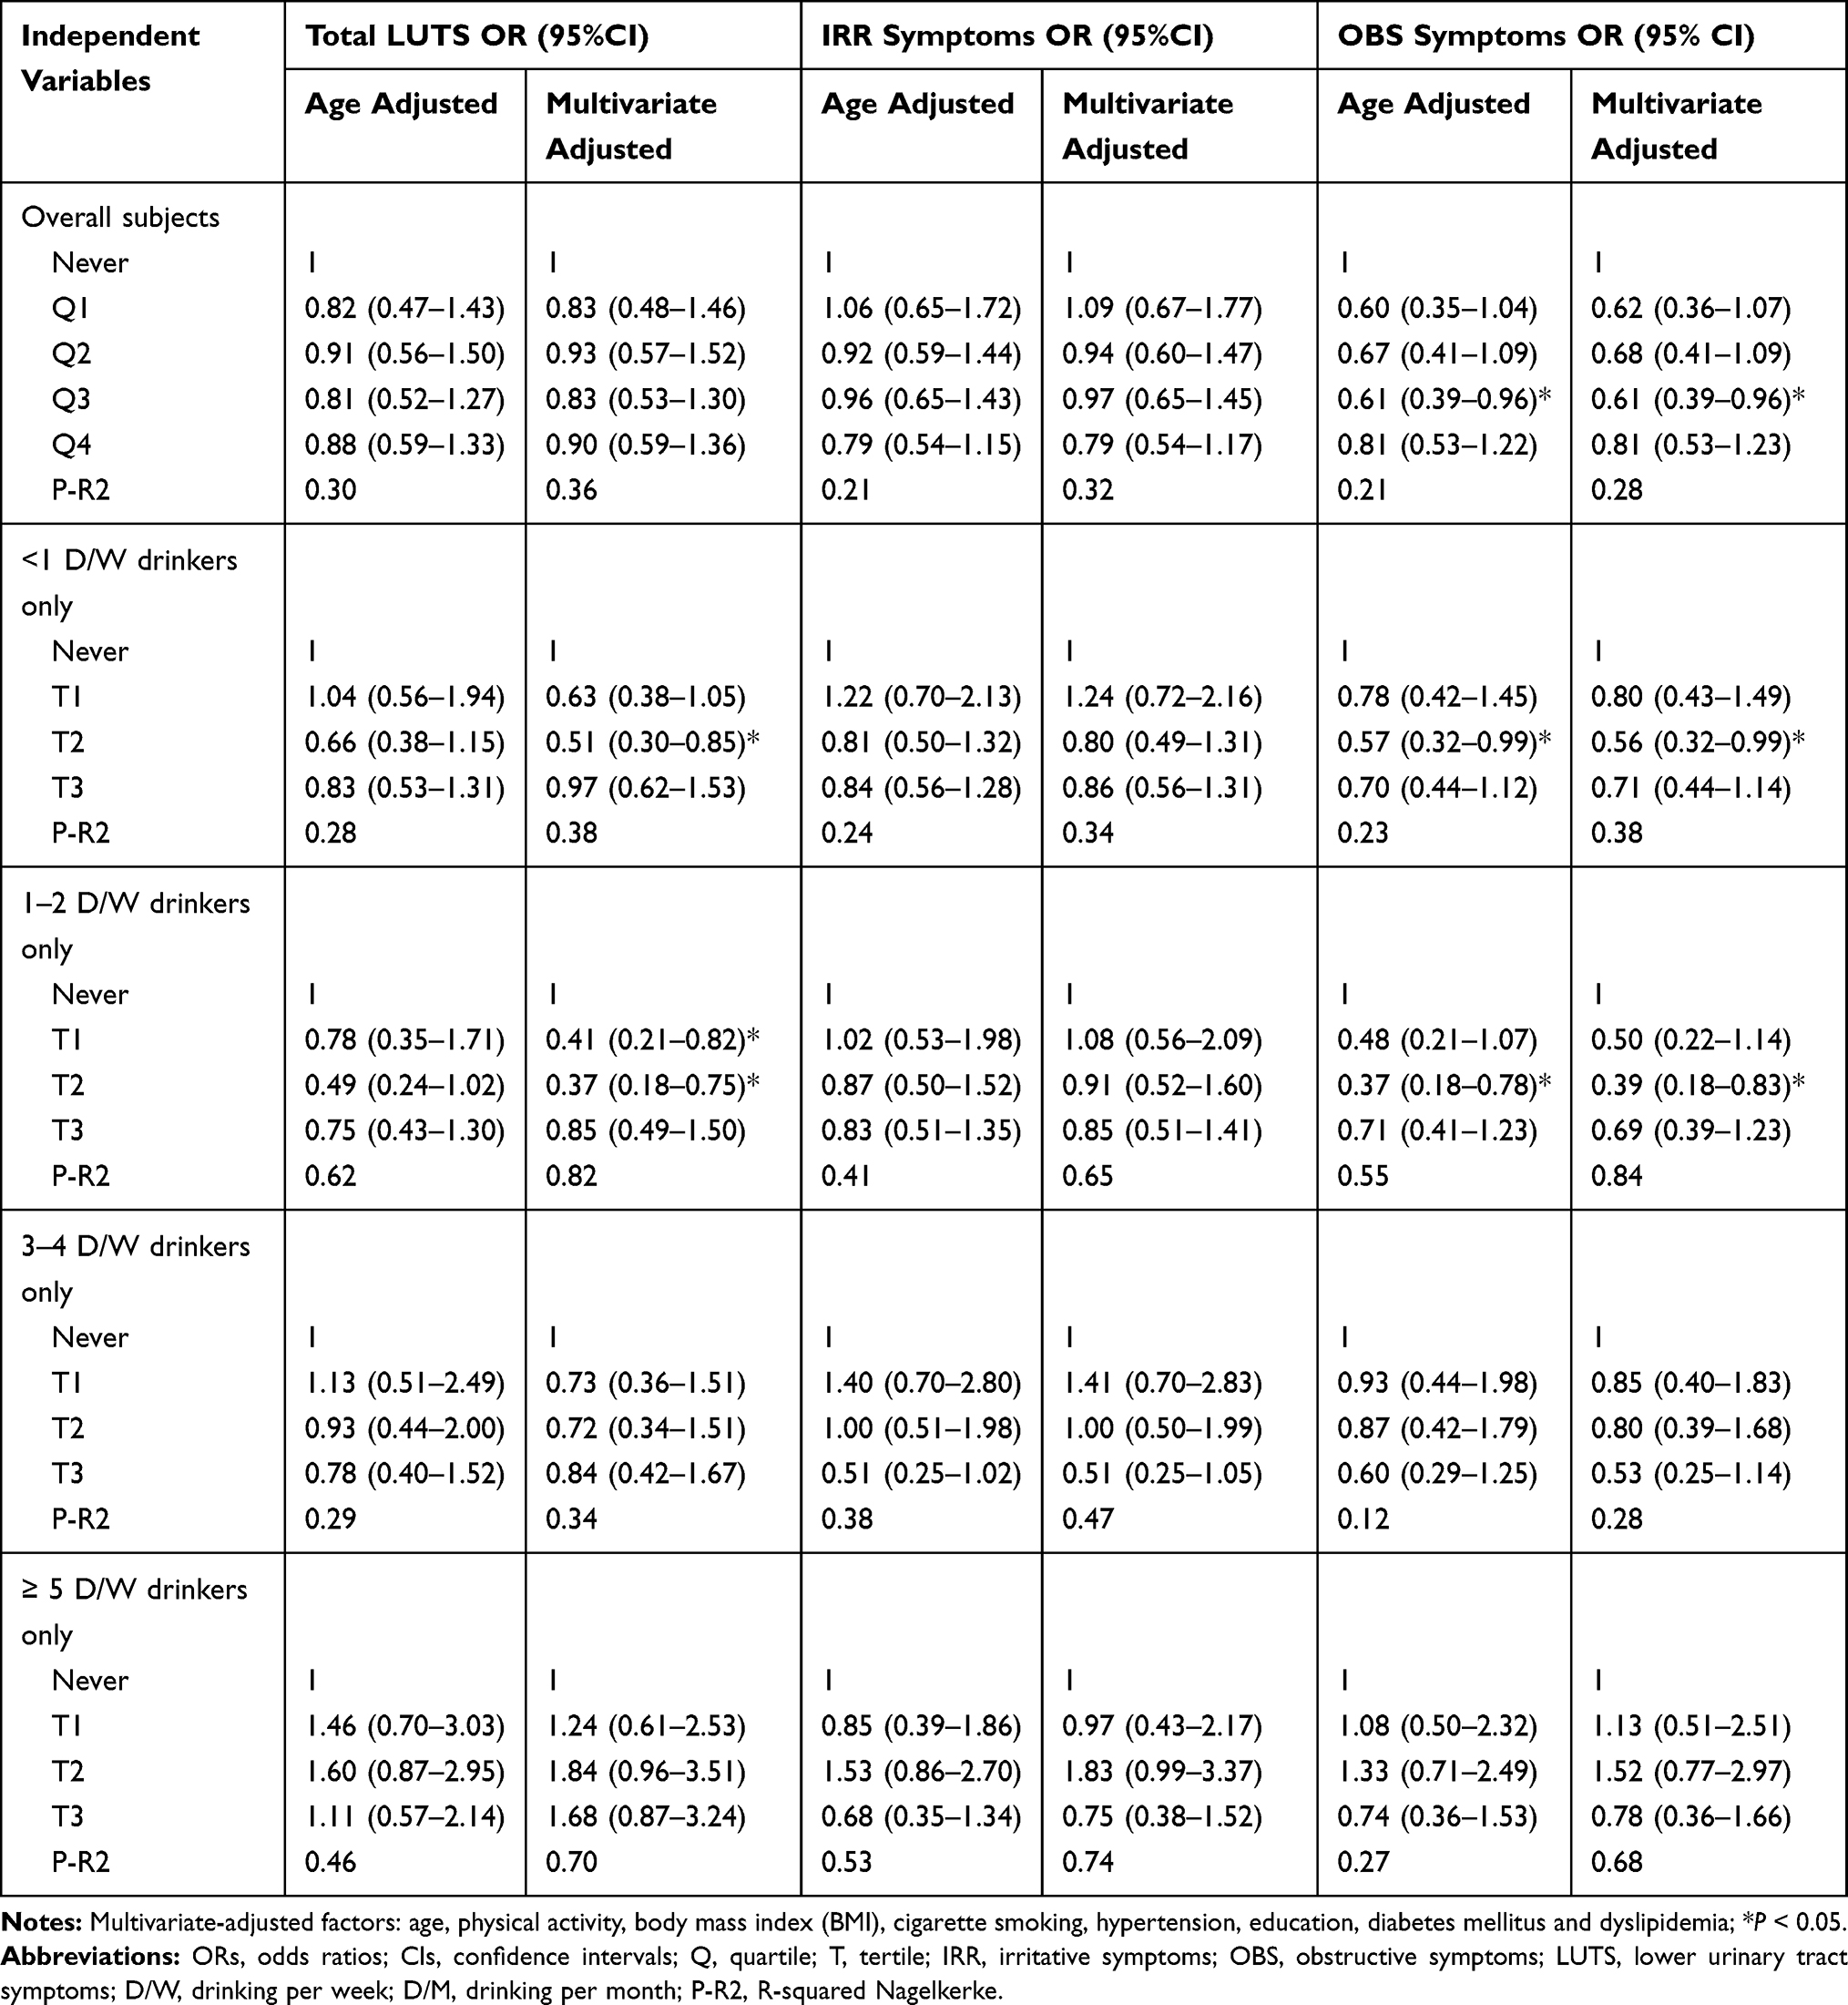 |
Table 2 Age- and Multivariate-Adjusted ORs and 95%CIs for Total LUTS, IRR and OBS Symptoms by the Drinking Years |
Results
Characteristics of 3,229 subjects stratified by LUTS severity (None: IPSS=0; Mild: IPSS=1–7; Moderate or severe: IPSS≥8) are presented in Table 3. Over 8.3% of men reported moderate or severe LUTS. The prevalence of moderate or severe LUTS increased with age growth (P<0.001, Figure 1), and there were statistically significant differences between the distribution of different age groups among LUTS severity (P<0.01). Additionally, we still observed that a significant number presented with alcohol consumption, BMI, cigarette smoking, education attainment and hypertension among different strata of LUTS severity (P<0.01).
 |
Table 3 Characteristics of the Study Population Stratified by the Severity of LUTS |
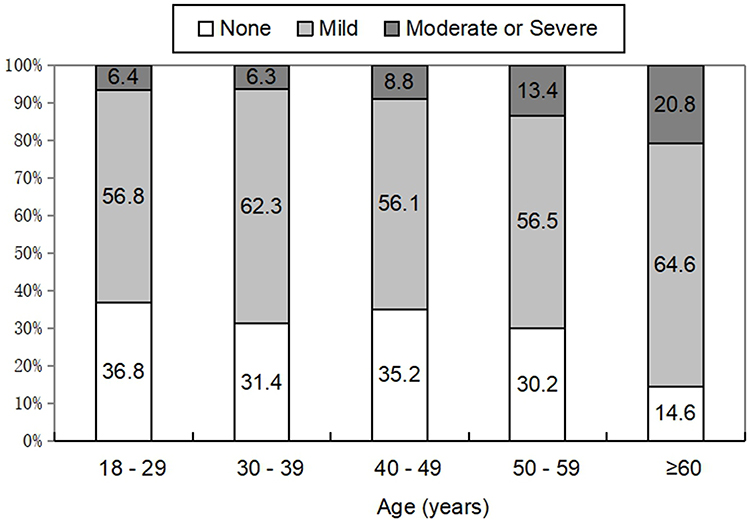 |
Figure 1 The prevalence of moderate or severe LUTS increases apparently with age growth. |
Table 4 show the unadjusted, age- and multivariate-adjusted relationship of total LUTS, IRR and OBS symptoms compared to the drinking frequency. It can be observed that men with 1–2 times per week alcohol consumption had an inverse association with total LUTS (OR=0.51, 95%CI=0.32–0.79), IRR (OR=0.68, 95%CI=0.46–0.99) and OBS (OR=0.45, 95%CI=0.29–0.70) symptoms in unadjusted logistic regression model when compared with never drinkers. Though the associations attenuated to a certain extent in age- or multivariate-adjusted models, OBS symptoms (age-adjusted models: OR=0.52, 95%CI=0.33–0.82; multivariate-adjusted models: OR=0.52, 95%CI=0.33–0.83) and total LUTS (age-adjusted models: OR=0.62, 95%CI=0.39–0.97) associated with 1–2 times per week alcohol consumption were still significant. Additionally, an inverse relationship presented between OBS symptoms (OR=0.59, 95%CI=0.40–0.87) and <1 time per week alcohol consumption in unadjusted models compared with never drinkers, but the relationship no longer had significance when adjusted for age and other confounding factors. In contrast, though the results were not significant, men with ≥ 5 times per week drinking were more likely to have LUTS compared with never drinkers.
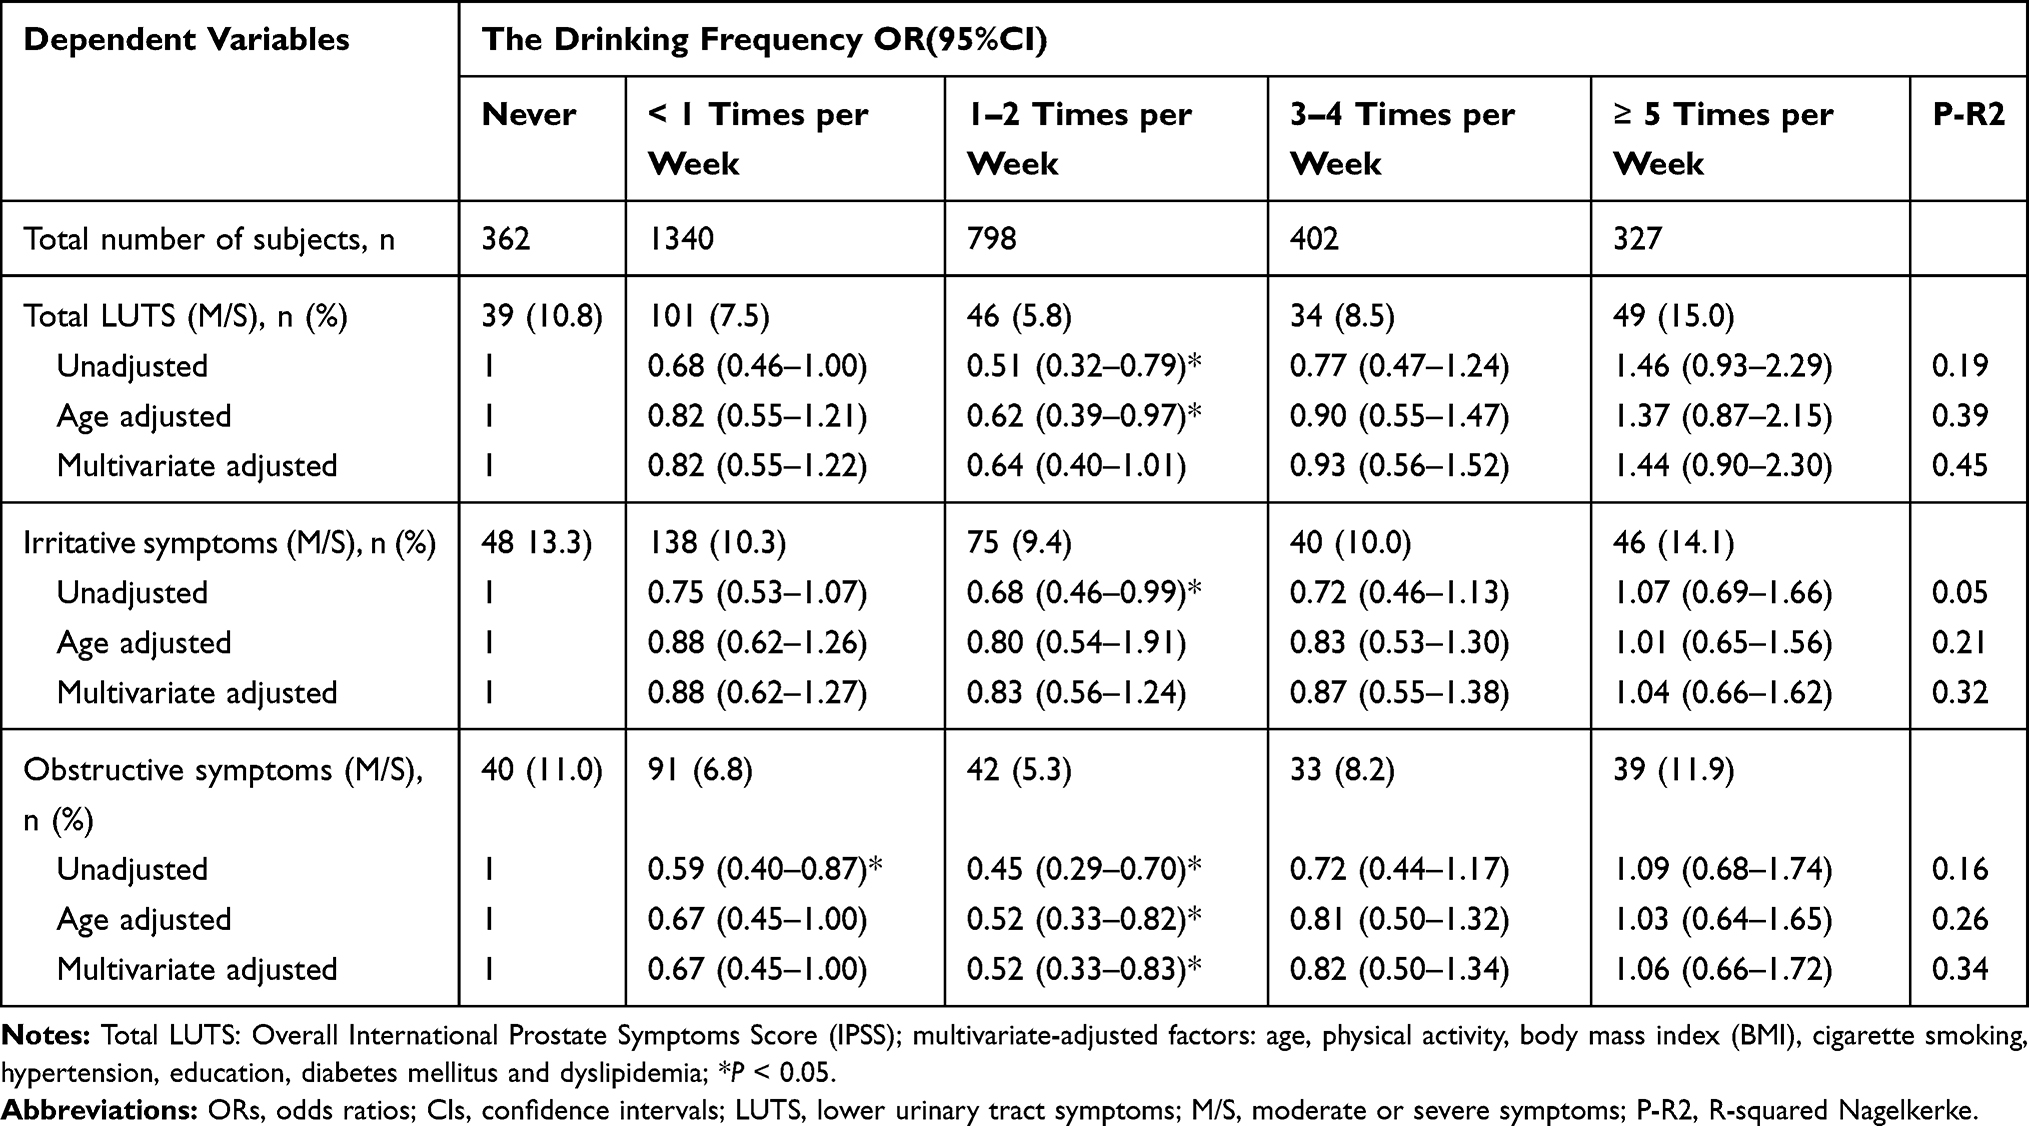 |
Table 4 ORs and 95%CIs for Total LUTS, Irritative and Obstructive Symptoms Score by the Drinking Frequency |
Tables 1 and 2 describe the unadjusted, age- and multivariate-adjusted associations between the years of every drinking frequency subtype and total LUTS, IRR and OBS symptoms. Compared with never drinkers, men who were in the third quartile of overall subjects (OR=0.56, 95%CI=0.36–0.87), the second tertile of 1–2 times per week (OR=0.30, 95%CI=0.15–0.61) and <1 times per week (OR=0.46, 95%CI=0.27–0.78) alcohol consumption were less likely to have OBS symptoms. Also, similar associations presented in <1 times and 1–2 times per week alcohol consumption compared to total LUTS, but these associations attenuated greatly after adjustment for age. Additionally, it could be observed that almost all subtypes of drinking frequency were inversely related with LUTS except for ≥ 5 times per week drinkers though the associations were not significant.
Discussion
The current observational study was based on a large series of the Chinese male population and showed that the prevalence of moderate or severe LUTS was 8.3% which was close to our previous study22 and increased apparently with increasing age that had been considered as the only well-established risk factor for LUTS.2–4 Men who drank alcohol only 1–2 times per week were much less likely to have obstructive symptoms (OBS) compared with nondrinkers; OBS symptoms were partially associated with the drinking years for all subjects, 1–2 times per week and <1 time per week alcohol consumption, however the associations did not present as significant positive or inverse relationships in the logistic regression model. In contrast, it could not be observed that significant relationships presented between LUTS and other subtypes of drinking frequency and years, or these associations attenuated remarkably when adjusted for age and other confounding factors.
The association of alcohol consumption and the risk of LUTS had been investigated by several epidemiological studies, but these results were also contradictory. In two studies related to Korean11 and African American men,13 the authors observed that those who reported to have 40 gm or greater and more than 72 gm daily drinking were more likely to have LUTS. Then in a 4-year follow-up study, it could be seen that the risk of moderate or severe LUTS increased among those who drank daily.23 However, Platz et al14 reported that alcohol consumption was inversely related with BPH/LUTS in a cohort study, and findings from the third National Health and Nutrition Examination Survey also indicated that men with daily alcohol consumption were less likely to have LUTS.12 Even more in a 7-year follow-up cohort study, the authors concluded that heavier drinking decreased the risk of high-moderate to severe LUTS or medically treated BPH.24 Also, researchers recently noticed that light-moderate alcohol consumption was associated with decreased likelihood of moderate-severe LUTS, whereas heavy alcohol consumption was associated with increased risk for LUTS in a dose-dependent manner in Korean males.25
The current results shared partial consistency (Table 4) with previous studies in which daily alcohol consumption presented as a positive trend with LUTS and its subtypes though the associations did not reach to significance,11,23 and men with 1–2 times per week drinking were much less likely to have OBS symptoms of LUTS.12,14 Additionally, we also evaluated the association between the drinking years and LUTS (Table 1) which often was ignored in others studies. The results were unclear; however the inverse association trend was similar with previous studies.14,24
Regarding the mechanism of alcohol consumption with LUTS, the sympathetic nerve activity, insulin sensitivity and serum testosterone metabolism might explain the association. It is plausible that light to moderate alcohol intake may help to make a diuretic effect,26 decrease testosterone concentration27 and increase sympathetic nervous activity.28 All these results may produce an inverse effect on LUTS which is concurrent with the present results, however administration of alcohol in these studies were all fixed quantity, so it could not be excluded the alternative explanation that inverse association of moderate frequency of alcohol consumption (1–2 times per week drinking) with obstructive symptoms of LUTS observed in our study was caused by avoidance of diuretic effect. Furthermore, alcohol consumption is still related with improving insulin sensitivity,9 and then decreased the risk of LUTS according to improving metabolism syndrome which have been widely confirmed as being strongly associated with LUTS.29–31
Apparently, all the above studies presented incomplete consistent results between alcohol consumption and LUTS or its subtypes. It could be attributed to the difference in lifestyle, race, definition of alcohol consumption (quantity or frequency), the range of the subjects (age and number) and adjustment of confounding factors. In the present study, the included subjects were all from those who voluntarily participated in a physical examination, and defining the alcohol consumption from the frequency was consistent with people’s daily dietary habit in which most of the subjects generally drank at dinner and work in the daytime. Additionally, we also investigated the effect of drinking years in overall subjects and its subtypes on LUTS. It showed the association between not only the drinking frequency but also drinking years and LUTS. Furthermore, lots of confounding factors had been reported to be associated with LUTS and were included and adjusted in the statistical analysis, example for age,2,4 hypertension,32 BMI,29 diabetes,33 living habit34 (smoking and physical activity), etc. Due to the dominant status in the etiology of LUTS, age was even still considered as an independent adjustment factor in the logistic regression models, and the results were clearly presented in current logistic regression models in which most of the associations changed remarkably when adjusted for age, but changed slightly in multivariate logistic regression models. Therefore, the current study was rational and believable.
Though there were some aspects of the study design merit in our study, several limitations need to be mentioned. Firstly, due to the difficulty and uncertainty in making a unified standard on many different kinds of alcohol concentration and amount of alcohol intake, we only analyzed the association of the drinking frequency and years with LUTS but were not involved in the quantity of drinking. Secondly, the evaluation of LUTS, alcohol consumption and the other demographic characteristics (age, education, physical activity, comorbidities, etc) were all collected by questionnaires and might produce recall bias. However the interview was carried out by a technically trained physician and so the bias could be controlled to a low level. Finally, the cross-sectional study precludes an establishment of causality but only the association between alcohol consumption and LUTS. We will pay attention to this topic in the FAMHES follow-up cohort study.
Conclusions
The present observational study implied that moderate drinking frequency (1–2 times drinking per week) might be protective against LUTS (mainly presented as OBS symptoms) in Chinese men. Whether LUTS could be worsened or improved by the number of drinking years were not clarified. If the current observational results are confirmed by more and more well-designed cohort studies, clinical trials or experimental studies in the future, then moderate drinking frequency might be recommended as a protection factor of LUTS prevention.
Ethics Approval and Informed Consent
The FAMHES survey had received the approval from ethics committee in First Affiliated Hospital of Guangxi Medical University (Approval number: 2008 -KY-004) and was conducted in accordance with the Declaration of Helsinki.
Acknowledgments
We express our sincere thanks to the local research teams from Fangchenggang First People’s Hospital, Fangchenggang, China, for their contribution to the survey and all study subjects for participating in this study.
Author Contributions
All authors contributed to data analysis, drafting or revising the article, gave final approval of the version to be published, and agree to be accountable for all aspects of the work.
Funding
This study was funded by Guangxi Natural Science Foundation Program (2017JJA140780y), Basic Ability Promotion Project for Young and Middle-aged Teachers of Guangxi College (2017KY0125), National Key Research and Development Program of China (2017YFC0908000).
Disclosure
The authors report no conflicts of interest in this work.
References
1. Wu MP, Weng SF, Hsu YW, Wang JJ, Kuo HC. Medical attendance for lower urinary tract symptoms is associated with subsequent increased risk of outpatient visits and hospitalizations based on a nationwide population-based database. PLoS One. 2013;8(3):e57825. doi:10.1371/journal.pone.0057825
2. Coyne KS, Sexton CC, Bell JA, et al. The prevalence of lower urinary tract symptoms (LUTS) and overactive bladder (OAB) by racial/ethnic group and age: results from OAB-POLL. Neurourol Urodyn. 2013;32(3):230–237. doi:10.1002/nau.22295
3. Lu Z, Gao Y, Tan A, et al. Increased high-sensitivity C-reactive protein predicts a high risk of lower urinary tract symptoms in Chinese male: results from the Fangchenggang area male health and examination survey. Prostate. 2012;72(2):193–200. doi:10.1002/pros.21421
4. Apostolidis A, Kirana PS, Chiu G, Link C, Tsiouprou M, Hatzichristou D. Gender and age differences in the perception of bother and health care seeking for lower urinary tract symptoms: results from the hospitalised and outpatients’ profile and expectations study. Eur Urol. 2009;56(6):937–947. doi:10.1016/j.eururo.2009.07.050
5. Martin S, Lange K, Haren MT, Taylor AW, Wittert G. Members of the Florey Adelaide Male Ageing Study. Risk factors for progression or improvement of lower urinary tract symptoms in a prospective cohort of men. J Urol. 2014;191(1):130–137. doi:10.1016/j.juro.2013.06.018
6. Penson DF, Munro HM, Signorello LB, Blot WJ, Fowke JH, Urologic Diseases in America Project. Obesity, physical activity and lower urinary tract symptoms: results from the Southern Community Cohort Study. J Urol. 2011;186(6):2316–2322. doi:10.1016/j.juro.2011.07.067
7. Tam CA, Helfand BT, Erickson BA. The relationship between diabetes, diabetes severity, diabetes biomarkers, and the presence of lower urinary tract symptoms: findings from the national health and nutrition examination survey. Urology. 2017;105:141–148. doi:10.1016/j.urology.2017.03.040
8. Bang WJ, Lee JY, Koo KC, Hah YS, Lee DH, Cho KS. Is type-2 diabetes mellitus associated with overactive bladder symptoms in men with lower urinary tract symptoms? Urology. 2014;84(3):670–674. doi:10.1016/j.urology.2014.05.017
9. Sierksma A, Patel H, Ouchi N, et al. Effect of moderate alcohol consumption on adiponectin, tumor necrosis factor-alpha, and insulin sensitivity. Diabetes Care. 2004;27(1):184–189. doi:10.2337/diacare.27.1.184
10. Parsons JK, Im R. Alcohol consumption is associated with a decreased risk of benign prostatic hyperplasia. J Urol. 2009;182(4):1463–1468. doi:10.1016/j.juro.2009.06.038
11. Oh MJ, Eom CS, Lee HJ, Choi HC, Cho B, Park JH. Alcohol consumption shows a J-shaped association with lower urinary tract symptoms in the general screening population. J Urol. 2012;187(4):1312–1317. doi:10.1016/j.juro.2011.11.085
12. Rohrmann S, Crespo CJ, Weber JR, Smit E, Giovannucci E, Platz EA. Association of cigarette smoking, alcohol consumption and physical activity with lower urinary tract symptoms in older American men: findings from the third National Health And Nutrition Examination Survey. BJU Int. 2005;96(1):77–82. doi:10.1111/j.1464-410X.2005.05571.x
13. Joseph MA, Harlow SD, Wei JT, et al. Risk factors for lower urinary tract symptoms in a population-based sample of African-American men. Am J Epidemiol. 2003;157(10):906–914. doi:10.1093/aje/kwg051
14. Platz EA, Rimm EB, Kawachi I, et al. Alcohol consumption, cigarette smoking, and risk of benign prostatic hyperplasia. Am J Epidemiol. 1999;149(2):106–115. doi:10.1093/oxfordjournals.aje.a009775
15. Choo MS, Han JH, Shin TY, et al. Alcohol, smoking, physical activity, protein, and lower urinary tract symptoms: prospective longitudinal cohort. Int Neurourol J. 2015;19(3):197–206. doi:10.5213/inj.2015.19.3.197
16. Liao M, Huang X, Gao Y, et al. Testosterone is associated with erectile dysfunction: a cross-sectional study in Chinese men. PLoS One. 2012;7(6):e39234. doi:10.1371/journal.pone.0039234
17. Barry MJ, Fowler FJ, O’Leary MP, The Measurement Committee of the American Urological Association, et al. The American Urological Association symptom index for benign prostatic hyperplasia. J Urol. 1992;148(5):
18. Chen C, Lu FC. Department of Disease Control Ministry of Health, PR China. The guidelines for prevention and control of overweight and obesity in Chinese adults. Biomed Environ Sci. 2004;17(Suppl):1–36.
19. Tan A, Gao Y, Yang X, et al. Low serum osteocalcin level is a potential marker for metabolic syndrome: results from a Chinese male population survey. Metabolism. 2011;60(8):1186–1192. doi:10.1016/j.metabol.2011.01.002
20. Joint Committee for Developing Chinese guidelines on Prevention and Treatment of Dyslipidemia in Adults. Chinese guidelines on prevention and treatment of dyslipidemia in adults. Zhonghua Xin Xue Guan Bing Za Zhi. 2007;35(5):390–419.
21. Expert Committee on the Diagnosis and Classification of Diabetes Mellitus. Report of the expert committee on the diagnosis and classification of diabetes mellitus. Diabetes Care. 2003;26(Suppl 1):S5–20. doi:10.2337/diacare.26.2007.S5
22. Gao Y, Wang M, Zhang H, et al. Are metabolic syndrome and its components associated with lower urinary tract symptoms? Results from a Chinese male population survey. Urology. 2012;79(1):194–201. doi:10.1016/j.urology.2011.07.1399
23. Wong SY, Woo J, Leung JC, Leung PC. Depressive symptoms and lifestyle factors as risk factors of lower urinary tract symptoms in Southern Chinese men: a prospective study. Aging Male. 2010;13(2):113–119. doi:10.3109/13685530903440432
24. Kristal AR, Arnold KB, Schenk JM, et al. Dietary patterns, supplement use, and the risk of symptomatic benign prostatic hyperplasia: results from the prostate cancer prevention trial. Am J Epidemiol. 2008;167(8):925–934. doi:10.1093/aje/kwm389
25. Suh B, Shin DW, Hwang SS, et al. Alcohol is longitudinally associated with lower urinary tract symptoms partially via high-density lipoprotein. Alcohol Clin Exp Res. 2014;38(11):2878–2883. doi:10.1111/acer.12564
26. Eggleton MG. The diuretic action of alcohol in man. J Physiol. 1942;101(2):172–191. doi:10.1113/jphysiol.1942.sp003973
27. Sierksma A, Sarkola T, Eriksson CJ, van der Gaag MS, Grobbee DE, Hendriks HF. Effect of moderate alcohol consumption on plasma dehydroepiandrosterone sulfate, testosterone, and estradiol levels in middle-aged men and postmenopausal women: a diet-controlled intervention study. Alcohol Clin Exp Res. 2004;28(5):780–785. doi:10.1097/01.ALC.0000125356.70824.81
28. van de Borne P, Mark AL, Montano N, Mion D, Somers VK. Effects of alcohol on sympathetic activity, hemodynamics, and chemoreflex sensitivity. Hypertension. 1997;29(6):1278–1283. doi:10.1161/01.HYP.29.6.1278
29. Barbosa JA, Muracca E, Nakano E, et al. Risk factors for male lower urinary tract symptoms: the role of metabolic syndrome and androgenetic alopecia in a Latin American population. Urology. 2013;82(1):182–188. doi:10.1016/j.urology.2013.03.001
30. Kupelian V, McVary KT, Kaplan SA, et al. Association of lower urinary tract symptoms and the metabolic syndrome: results from the Boston Area Community Health Survey. J Urol. 2009;182(2):616–625. doi:10.1016/j.juro.2009.04.025
31. Tai HC, Chung SD, Ho CH, et al. Metabolic syndrome components worsen lower urinary tract symptoms in women with type 2 diabetes. J Clin Endocrinol Metab. 2010;95(3):1143–1150. doi:10.1210/jc.2009-1492
32. Sugaya K, Kadekawa K, Ikehara A, et al. Influence of hypertension on lower urinary tract symptoms in benign prostatic hyperplasia. Int J Urol. 2003;10(11):
33. Sarma AV, Parsons JK, McVary K, Wei JT. Diabetes and benign prostatic hyperplasia/lower urinary tract symptoms–what do we know. J Urol. 2009;182(6 Suppl):S32–37. doi:10.1016/j.juro.2009.07.088
34. Haidinger G, Temml C, Schatzl G, et al. Risk factors for lower urinary tract symptoms in elderly men. For the prostate study group of the Austrian Society of Urology. Eur Urol. 2000;37(4):413–420. doi:10.1159/000020162
 © 2020 The Author(s). This work is published and licensed by Dove Medical Press Limited. The
full terms of this license are available at https://www.dovepress.com/terms
and incorporate the Creative Commons Attribution
- Non Commercial (unported, 3.0) License.
By accessing the work you hereby accept the Terms. Non-commercial uses of the work are permitted
without any further permission from Dove Medical Press Limited, provided the work is properly
attributed. For permission for commercial use of this work, please see paragraphs 4.2 and 5 of our Terms.
© 2020 The Author(s). This work is published and licensed by Dove Medical Press Limited. The
full terms of this license are available at https://www.dovepress.com/terms
and incorporate the Creative Commons Attribution
- Non Commercial (unported, 3.0) License.
By accessing the work you hereby accept the Terms. Non-commercial uses of the work are permitted
without any further permission from Dove Medical Press Limited, provided the work is properly
attributed. For permission for commercial use of this work, please see paragraphs 4.2 and 5 of our Terms.