Back to Journals » OncoTargets and Therapy » Volume 12
Downregulation of the Helicase Lymphoid-Specific (HELLS) Gene Impairs Cell Proliferation and Induces Cell Cycle Arrest in Colorectal Cancer Cells
Authors Liu X ![]() , Hou X, Zhou Y
, Hou X, Zhou Y ![]() , Li Q, Kong F, Yan S, Lei S, Xiong L, He J
, Li Q, Kong F, Yan S, Lei S, Xiong L, He J ![]()
Received 18 July 2019
Accepted for publication 19 November 2019
Published 26 November 2019 Volume 2019:12 Pages 10153—10163
DOI https://doi.org/10.2147/OTT.S223668
Checked for plagiarism Yes
Review by Single anonymous peer review
Peer reviewer comments 2
Editor who approved publication: Dr Jianmin Xu
Xi Liu,* Xuyang Hou,* Yan Zhou, Qinglong Li, Fanhua Kong, Shichao Yan, Sanlin Lei, Li Xiong, Jun He
Department of General Surgery, Second Xiangya Hospital, Central South University, Changsha, Hunan, People’s Republic of China
*These authors contributed equally to this work
Correspondence: Li Xiong; Jun He
Department of General Surgery, Second Xiangya Hospital, Central South University, Changsha, Hunan, People’s Republic of China
Tel +86-13787782059; +86-15084740259
Fax +86-731-85295163
Email [email protected]; [email protected]
Aim: Colorectal cancer (CRC) is the fourth most frequently diagnosed cancer worldwide. Despite the decrease in mortality of CRC patients, further investigation of the molecular pathogenesis of CRC could unveil new therapeutic targets and offer better prognosis predictions, which might direct attention to epigenetic regulators.
Methods: Publicly available data from the Gene Expression Omnibus (GEO) database and clinical samples were collected. Bioinformatics methods were used to screen hub genes expressed in CRC. qRT-PCR and Western blotting were used to experimentally determine the expression of one gene of interest, the helicase lymphoid-specific (HELLS) gene, at the RNA and protein levels. Immunohistochemical (IHC) assays were used to correlate the stained HELLS proteins to survival data. Cell proliferation levels were assayed by a CCK-8 kit, a colony formation assay was performed, and flow cytometry was used to quantify the cells at each stage of the cell cycle.
Results: A total of 225 overlapping genes were screened, including 14 hub genes. Analysis through a protein-protein interaction (PPI) network and the Gene Ontology database was performed by using the Cytoscape and DAVID online tools, respectively. HELLS RNA and protein expression levels in tumor tissues were 2.09-fold higher and 1.46-fold higher, respectively, than in the peritumoral tissues (p < 0.001, p<0.001). HELLS expression was significantly associated with the T stage (p=0.0027), M stage (p=0.0119), and TNM clinical stage (p = 0.0312) and a higher pathological grade (p=0.049). Highly expressed HELLS was reversibly associated with overall survival (log-rank p = 0.027). HELLS siRNA impaired cell proliferation and colony generation in vitro. HELLS siRNA induced significant G2+M arrest in HT29 and HCT116 cells compared with the respective negative controls (82.29% vs 25.85% and 35.41% vs 15.26%, respectively).
Conclusion: Our data revealed that HELLS was significantly upregulated in CRC and correlated with clinicopathological parameters. High expression of HELLS indicated poor prognosis for CRC patients. HELLS knockdown led to impaired cell proliferation, colony generation, and G2+M cell cycle arrest.
Keywords: HELLS, colorectal cancer, cell cycle, pathological significance
Introduction
Although the incidence of CRC has decreased every year since 2003, it remains the fourth most frequently diagnosed cancer worldwide.1,2 In China, the incidence of CRC increased at a rate of approximately 1% between 2006 and 2010, especially in urban areas such as Shanghai, where CRC became the second most common cancer.3 Because of the robust promotion of cancer prevention and earlier diagnosis, CRC mortality dramatically decreased in developed countries and moderately decreased in China.2–4 However, surgery is the only modality for radically removing cancer in most cases.5 Many patients diagnosed with metastasis, a common cause for poor prognosis, most likely lose the opportunity for beneficial surgery. Thus, further exploration of the molecular pathogenesis of CRC will offer beneficial new findings for developing therapy targets and accurately predicting prognosis.
Accumulation of gene variants leads to CRC initiation and progression, according to the evolution theory of cancer development.6,7 Several genes and pathways have been identified as drivers for these gene alterations, which comprise suppressive genes (such as TP53 and SMAD family member 4) and oncogenes (such as RAS and PIK3CA).8 Epigenomic research found that, in CRC with microsatellite instability, MLH1 is hypermethylated, which results in tumor development.9 In recent years, several enzymes, such as EZH2 and G9a, which function as histone modifiers and epigenetic regulatory factors, have been recognized and implicated as oncogenes in multiple cancers.10 Along with histone modification, the CpG island methylation phenotype (CIMP) has been repeatedly cited and verified as one of the major pathways for CRC development.8,11 In addition, other mechanisms of epigenetic regulation have also been determined. Among them, the helicase lymphoid-specific (HELLS) protein, a member of the SNF2 family of chromatin remodeling ATPases, is important for DNA methylation and is dramatically upregulated in various cancers.12,13 Dysfunction of HELLS led to a decrease in approximately 20% of all methylated promoter sequences in normal cells.12 In hepatocellular carcinoma, downregulation of HELLS led to metabolic reprogramming and reversed the Warburg effect through activation of several tumor suppressor genes.14 In colorectal cancer, a decrease in HELLS expression was associated with metastasis by affecting 5-methylcytosine levels.15 However, the role of HELLS in CRC initiation and progression remains unclear.
In the present study, we first screened hub genes found in CRC by accessing publicly available data from the Gene Expression Omnibus (GEO) database, and the search resulted in 14 genes, including HELLS. We demonstrated that the expression of HELLS was significantly upregulated in CRC tissues compared with peritumoral tissues at the RNA level and protein level. High expression of HELLS was correlated with clinicopathological parameters, including T stage, M stage, clinical TNM stage, and pathological grade. High expression of HELLS also indicated poor overall survival in CRC patients. Functionally, the inactivation of HELLS impaired cell proliferation, colony generation, and the cell cycle. Thus, our results, as obtained through bioinformatics and experimental methods, revealed that CRC increased HELLS expression, which promoted CRC growth in vitro.
Materials and Methods
Identification of the Hub Genes
Four GEO data sets (GSE8671, GSE24514, GSE32323, and GSE126092) were selected and downloaded for analysis. The differentially expressed genes (DEGs) of tumor and peritumoral tissues were identified by GEO2R. The adjusted P-values and fold change were 0.01 and ±0.75, respectively. The Search Tool for the Retrieval of Interacting Genes (STRING) was used for predicting genes in a protein-protein interaction network (PPI) constructed by Cytoscape. The hub genes were predicted by the plug-in application (APP), Molecular Complex Detection (MCODE). The number of potential genes was narrowed down by applying the following parameters: MCODE scores > 10, degree cut-off = 2, node score cut-off = 0.2, maximum depth = 100 and k-score = 2. The Gene Ontology analysis was performed by DAVID.
Human CRC Samples and CRC Cell Lines
This study was approved by the Ethics Committee for Human Research, Central South University and was conducted according to the approved guidelines. The patients whose tissues were used had provided written informed consent, in accordance with the Declaration of Helsinki. A total of 153 pairs of tumor tissue and peritumoral tissues were obtained at the Second Xiangya Hospital. Among them, 110 pairs were collected in 2018 and frozen at −80°C, and 53 pairs were collected in 2016 and were maintained in paraffin packaging. The CRC cell lines HT29 and HCT116 were purchased from the Keygentec Company (China). Cell identification was performed and qualified by the same provider. The cells were grown in RPMI 1640 medium (Biological Industries, Israel) supplemented with 10% fetal bovine serum (Biological Industries, Israel) and 1% penicillin/streptomycin. The cells were grown at 37°C in a humidified incubator with 5% CO2.
Cell Proliferation Assay
The cells were plated in a density series (10, 102, 103 and 104) per well in a 96-well plate with 4 replicates. The cells were cultured for 3 days at 37°C in a humidified incubator with 5% CO2. The CCK-8 kit (GeneView, America) was used to determine the OD values at 450 nm by a microplate spectrophotometer (Thermo Fisher, America). All data were normalized to the control well, which contained no cells, and presented as the mean ± SD.
Colony Formation
The cells were diluted through a dilution gradient, and 2500 cells were plated per well in 6-well plates. The size and number of colonies were determined every day and at 7 days and 10 days. For use in the experiments, the cells were washed with PBS, fixed with 4% paraformaldehyde, and stained with Crystal violet staining solution (Beyotime, China). The pictures of colonies were taken by a digital camera.
Protein Extraction and Western Blotting
The cells were collected and lysed in RIPA buffer mixed with protease inhibitors (TargetMol, America) and incubated on ice for 30 min. The lysates were centrifuged at 14,000 g for 10 min at 4°C, and the supernatant was collected. A BCA assay was used to determine the protein concentration. After consistent quantification of each sample, the proteins were mixed with SDS loading buffer and then heated at 100°C for 10 min. Then, the denatured proteins were added into the chamber for electrophoresis conducted for proper length of time, followed by transfer onto PVDF membranes. The membranes were blocked in 3% BSA for 1 h at room temperature. Then, the membranes were cultured with HELLS antibody (molecular weight 120 kDa) and GAPDH (molecular weight 36 kDa) antibody (Abclonal, China) overnight. The next day, the primary antibody was washed with TBST solution, and the second antibody (Abclonal, China) was added for 1 h at room temperature. Finally, the immune complexes were detected by enhanced chemiluminescence (Life Tec, America). Quantification of the bands was carried out with ImageJ (Version 11).
RNA Extraction and Quantitative Real-Time PCR
Tissues and cells were treated with TRIzol reagent (Invitrogen, America) for 10 min, followed by centrifugation at 12,000 g for 15 min at 4°C. Then, the RNA to be suppressed was collected and mixed with isopropanol for the isolation of RNA. After obtaining RNA, RNA purity and concentration were analyzed by using a Nanodrop 1000 spectrophotometer (Thermo Fisher, America). The cDNA was synthesized using a high-capacity cDNA reverse transcription kit (Life Tec, America). HELLS is located on 10q23.33 with 26 exons. The primers for HELLS are as follows: 5ʹ-TAGAGAGTCGACAGAAATTCGG-3ʹ (forward) and 5ʹ-CCTCATAACTGGCTTCTCTTCA-3ʹ (reverse). qRT-PCR was performed with 2X Universal SYBR Green Fast qPCR mix (Abclonal, China) on a LightCycler 96 system (Roche, America).
Immunohistochemical Staining
Briefly, 4 μm-thick sections were cut from paraffin-embedded tissues. The sections were deparaffinized and then incubated with 3% H2O2 in the dark for 15 min. Heat-induced epitope retrieval was conducted with sodium citrate buffer (10 mM sodium citrate and 0.05% Tween 20 at pH 6.0) at 96°C for 30 min. The sections were incubated with rabbit anti-human HELLS primary antibody (1:100 dilution) for 2 h after they were soaked in PBS for 3 × 5 min. The sections were incubated with several drops of Solution A (ChemMateTMEnVision+/HRP) for 30 min followed by DAB staining and hematoxylin counterstaining. The sections were dehydrated, soaked in xylene, and mounted with neutral balsam.
Cell Cycle Phase Analysis
The cell cycle distribution was determined by flow cytometry of cells stained by PI and followed by manufacturer’s instructions (GeneView, America). The cells treated with siRNA or a negative control by transfection were prepared two days in advance. Then, the cells were harvested and fixed with precooled 70% ethyl alcohol for 2 h, followed by centrifuging at 1000 g for 5 min, staining with the PI solution and cultivation for 30 min at room temperature. Finally, samples were sent for flow cytometry analysis.
siRNA Transfection
For transfection, the cells were seeded in 6-well plates at a confluence of 50%. After 24 h of incubation, the transfection of the siRNAs and negative controls were carried out using Lipofectamine™ RNAiMAX transfection reagent (Invitrogen™). The sequences of the HELLS siRNA were as follows: 5ʹ-GAAGUGAAUAUCCCUGUAGdTdT-3ʹ for the sense strand and 5ʹ- CUACAGGGAUAUUCACUUCdTdT-3ʹ for the antisense strand. Negative control siRNA targets nonsense sequences. After another incubation of 48 h, the cells were subjected to the assay described above. The knockdown efficiency of the siRNA was confirmed by qRT-PCR and Western blot analysis.
Statistical Analysis
All statistical analyses were performed using Prism software (GraphPad). A 2-tailed Student’s t test was used to assess the statistical significance between two groups. For more than two groups, one-way ANOVA was used. Kaplan-Meier survival curves for the CRC patients were generated, and the log rank test was used to assess significant differences between two groups.
Results
Identification of Hub Genes in Colorectal Cancer by Bioinformatics Methods
To recognize the potential genes playing vital roles in colorectal cancer, we used publicly available data from the GEO (GSE8671, GSE24514, GSE32323, and GSE126092 data sets). Based on these data sets, we identified 2861, 286, 819, and 1660 DEGs of tumor tissues and peritumoral tissues, respectively, which included 225 overlapping genes, as shown in the Venn diagram (Figure 1A). To visualize the functional linkages among these genes, a PPI network was constructed by Cytoscape (Figure 1B). The plug-in APP of Cytoscape, MCODE, was used to select the significant module in the PPI network and generate the most likely of the potential function cluster, which comprised 14 genes (CENPK, CENPI, NUF2, KIF18A, KNSTRN, ANLN, NEIL3, KIF23, HELLS, E2F7, DEPDC1, ERCC6L, PARPBP, and FBXO5), as shown in Figure 1C. Further, a network of these genes and functionally associated genes was constructed by the cBioPortal online tools (Figure 1D). The Gene Ontology analysis of these hub genes was conducted by the DAVID online tool, and the biological process analysis showed that these genes were significantly enriched during sister chromatid cohesion, mitotic nuclear division and cell division (Figure 1E). Thus, we identified a series of hub genes in colorectal cancer by bioinformatics methods.
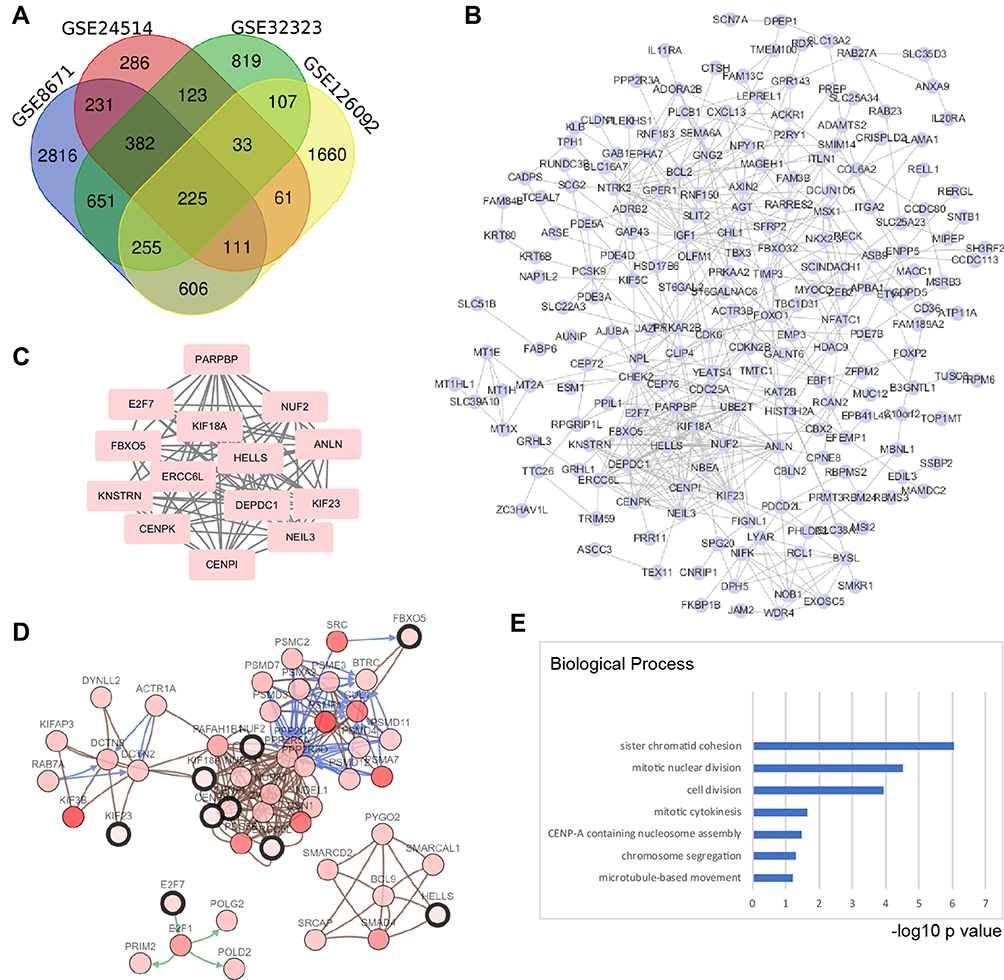 |
Figure 1 Screening hub genes in colorectal cancer by bioinformatics methods based on GEO data sets. (A) Four data sets were selected: GSE8671, GSE24514, GSE32323, and GSE126092. For screening the DEGs, the GEO2R tool was used, the cut-off value for adjusted p-value was 0.01, and the fold change (Log2) was ±0.75. A total of 225 overlap genes were found in the four data sets. (B) The protein-protein interaction network (PPI) was predicted by the STRING online tool, and then the interactions among the 225 genes were reconstructed by Cytoscape (Version 3.7.1). (C) Hub genes were screened by the Cytoscape plug-in APP MCODE (Version 1.4.1); an MCODE score > 10 was selected, which resulted in 14 hub genes. (D) These hub genes were correlated with TCGA data by cBioPortal (TCGA, colorectal adenocarcinoma, provisional), which were used to reconstruct the coexpression network; five functional clusters were found. (E) Gene Ontology analysis of hub genes was performed by DAVID online tool. The top 4 biological processes were sister chromatid cohesion, mitotic nuclear division, cell division and mitotic cytokinesis. The X axis shows the rank by the -log10 p value of each enriched process. |
HELLS Was Upregulated in Colorectal Cancer
Among these hub genes identified by bioinformatics, HELLS attracted our attention. Emerging evidence suggested that HELLS is an active epigenetic regulator and functions in regulation of many genes in cancers. We analyzed its expression in tumor tissues and the corresponding peritumoral tissues. Samples from 110 patients with recently diagnosed colorectal cancer were included in our research. These patients had been treated with neither chemotherapy nor other internal medicine therapies prior to surgery. Frozen section and pathological analysis of these samples confirmed that the putative tumor samples were derived from an adenoma and that the peritumoral tissues were from normal colorectal gland tissues. To compare the expression levels of HELLS in tumor tissue with those of the peritumoral tissues, qRT-PCR was performed. As indicated in Figure 2A, the average expression levels of HELLS in the tumor tissue was 2.09-fold higher than it was in the peritumoral tissue. In our analysis, ΔCq refers to the Cq of the target gene minus that of the reference gene; thus, we used -ΔCq to represent the expression level of HELLS in each sample. As shown in Figure 2B, HELLS expression was significantly upregulated in the tumor tissue compared with that of peritumoral tissue (p < 0.001). We used Western blotting to examine the HELLS expression in each sample. A representative result is illustrated in Figure 2C (upper). The results from the semiquantitative analysis of the bands are presented in Figure 2C (lower). After normalization by the reference protein, tumor tissue was found to express significantly higher HELLS protein compared with corresponding normal tissue (2.2 vs 1.5, p < 0.001, Figure 2D). Thus, we revealed that HELLS is significantly upregulated in colorectal cancer based on fresh samples.
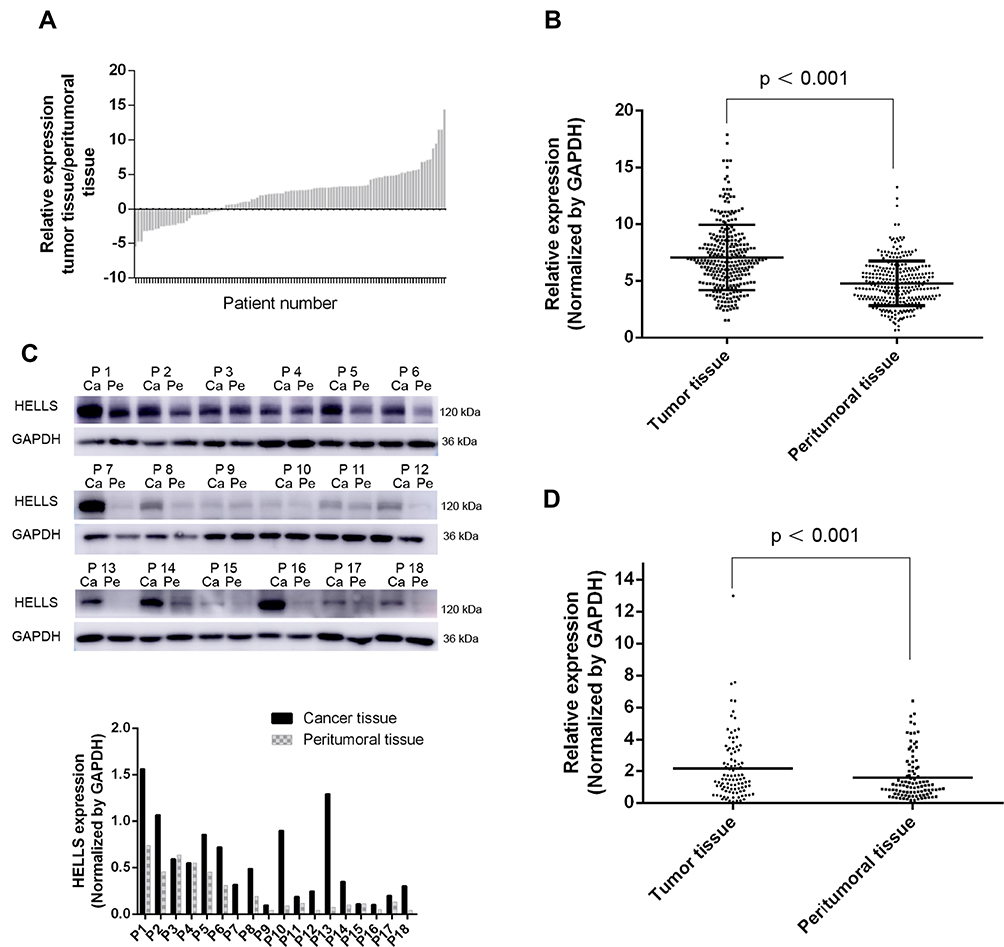 |
Figure 2 The expression of HELLS was upregulated in colorectal cancer. (A) RNA was extracted from each sample, and the cDNA was generated and used for semiquantitative analysis by qRT-PCR. After normalization by a reference gene (GADPH), the relative expression of HELLS in tumor tissues compared with that of the corresponding peritumoral tissue was calculated. Each column represents data from distinct patients. (B) ΔCq refers to the Cq of the target gene minus that of reference gene; thus, -ΔCq represents HELLS expression level normalized by GAPDH; result of unpaired t test between the tumor tissues and peritumoral tissues was 7.07 (SEM ± 0.166) and 4.77 (SEM ± 0.144) in, respectively (p < 0.001). Each sample was tested three times, and each dot represents one sample. (C) Western blotting was used to assay the protein expression of HELLS in the collected samples. (Upper) GAPDH was the reference protein; P refers to patient; Ca refers to tumor tissue; Pe refers to peritumoral tissue. (Lower) Binding intensity was analyzed by ImageJ; HELLS level was normalized by GAPDH. (D) The scatter plot values were 2.158 ± 0.2096 and 1.548 ± 0.148 for the tumor tissue (n=110) and peritumoral tissue (n=110), respectively. p < 0.001. |
HELLS Was Correlated with the Clinical Significance and Prognosis of Colorectal Cancer
To investigate the clinical significance of HELLS in colorectal cancer, we analyzed the HELLS expression level with respect to various clinicopathological parameters of 110 patients. We found that HELLS expression was significantly associated with the T stage (p<0.01, Figure 3A), M stage (p<0.05, Figure 3C), and TNM clinical stage (p < 0.05, Figure 3D) but exhibited no correlation with the N stage (Figure 3B). Because nerve infiltration is also an important pathological characteristic of colorectal cancer, we analyzed the association of HELLS expression with it. The results indicated that there was no significant correlation between HELLS expression and nerve invasion (Figure 3E). The tumor samples were designated with various grades (low, low-intermediate, intermediate, intermediate-high, and high grade) by pathologists. We ranked the low and low-intermediate grades as G1, intermediate as G2, and intermediate-high and high grade as G3. Our results showed that HELLS expression was reversibly correlated with pathological grade (G1 vs G3, p <0.05 and G1 or G3 vs G2 > 0.05, Figure 3F). In addition, other clinicopathological variables with HELLS are shown in Table 1.
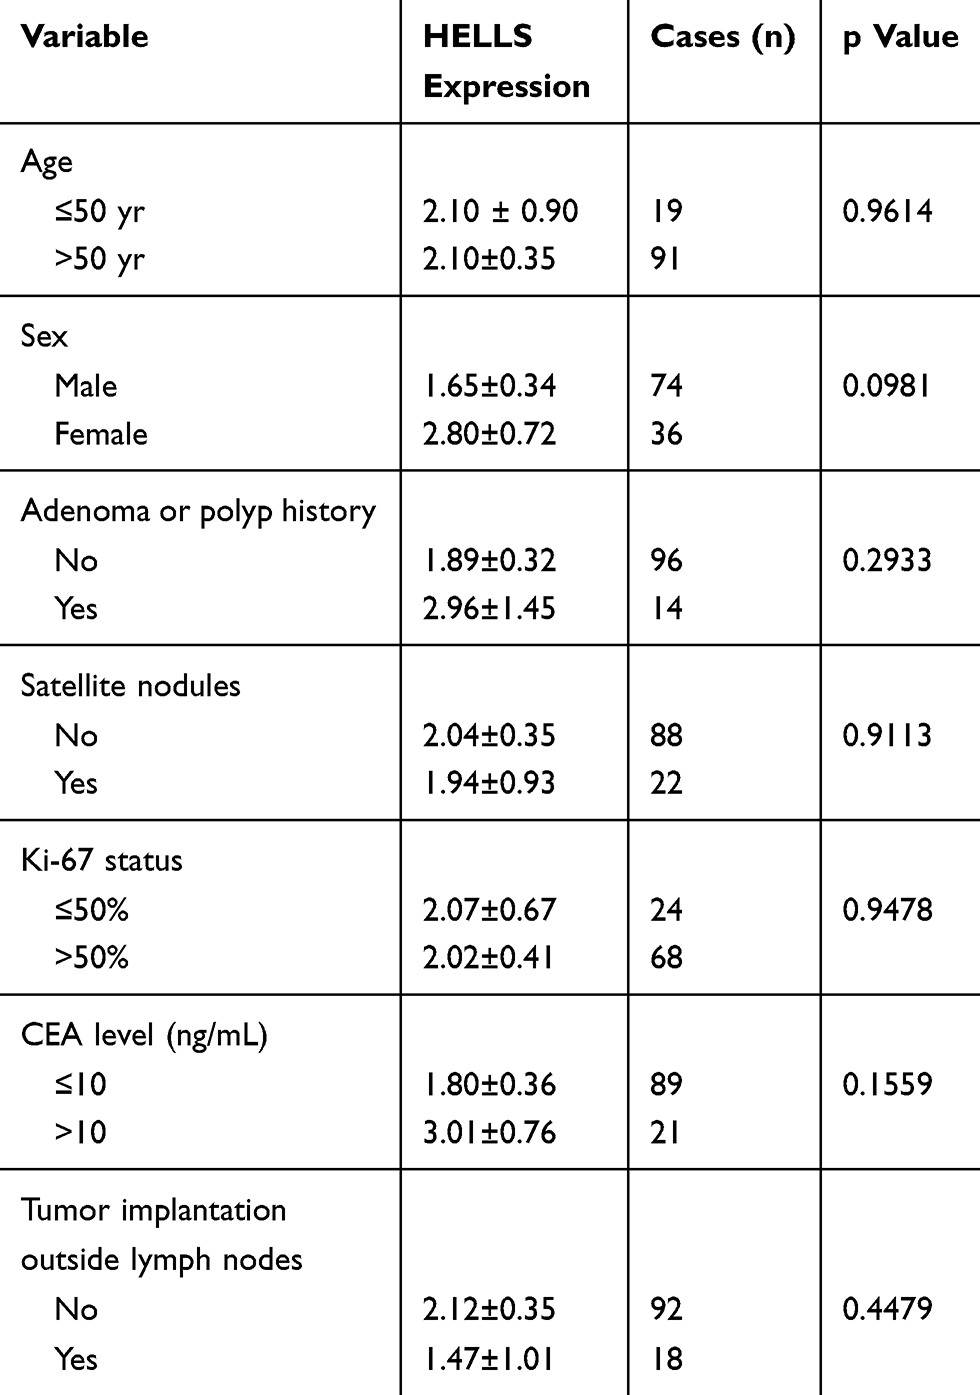 |
Table 1 Correlation of Other Clinicopathological Variables with HELLS Expression |
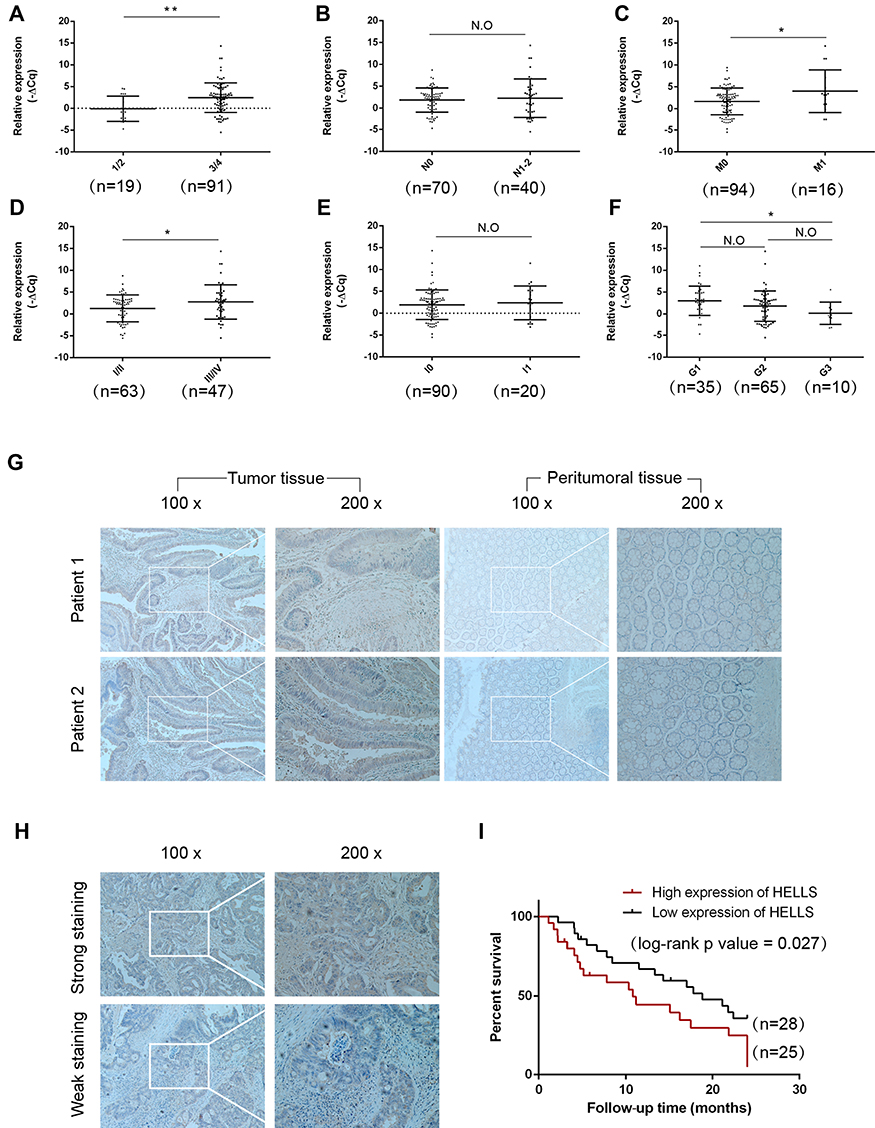 |
Figure 3 Correlation of HELLS expression with clinical significance and prognosis in colorectal cancer. (A) Scatter plot analysis of the relative expression of HELLS mRNA in tumor tissues at different T stages. HELLS was upregulated in stage 3/4 (right, n=91) vs stage 1/2 (left, n=19), p=0.0027. (B) The relative expression of HELLS mRNA in tumor tissues at different N stages. The expression for group N 0 (n=70) showed no significant difference with group N 1–2 (n=40). N.O indicates no significant difference. (C) The relative expression of HELLS mRNA in tumor tissues for different M stages. The M 1 group (n=94) had upregulated HELLS expression compared with that of the M 0 group (n=16), p=0.0119. (D) The relative expression of HELLS mRNA in tumor tissues t different clinical TNM stages. The stage III/IV (n=47) group had increased HELLS expression compared with that of stage I/II (n=63), p = 0.0312. The TNM stage determined was according to the UICC/AJCC TNM staging system (8th edition). (E) The relative expression of HELLS mRNA in tumor tissues with nerve infiltration (n=90) or without nerve infiltration (n=20), N.O. (F) Pathological grade reversely correlated with HELLS expression (G1 vs G3), p=0.049. The tumor samples were of various grades (low, low-intermediate, intermediate, intermediate-high, and high grade), as determined by pathologists. Low- and low-intermediate grades were clustered in G1, intermediate in G2, and intermediate-high and high grades in G3. (G) Representative images of immunostained HELLS in tumor tissue and peritumoral tissue. (H) Representative images of stained HELLS in tumor tissue showing distinct intensity. (I) The Kaplan-Meier survival curve for overall survival. Statistics were evaluated by the p log rank test. The follow-up time was 2 years; intense staining of HELLS (n=25) shows poor overall survival compared with the less intensely stained HELLS (n=28); the log-rank p value = 0.027. *p < 0.05, **p < 0.01. |
We further explored the role of HELLS in the prognosis of colorectal cancer patients. We collected 53 tumor and peritumoral samples from patients who had received surgery as therapy in 2017 and assessed the HELLS the IHC staining intensity. The representative results are shown in Figure 3G and H. High expression of HELLS was inversely associated with overall survival (Figure 3I). Collectively, our results indicated that the HELLS expression level was associated with clinical significance and could serve as a biomarker for the prognosis of colorectal cancer.
Downregulation of HELLS Inhibited Cell Proliferation, Colony Generation, and the Cell Cycle
On the basis of the results of bioinformatics and experimental research, we further determined the function of HELLS in colorectal cancer. We used siRNA to knock down HELLS in two colorectal cancer cell lines, HT29 and HCT116. As shown in Figure 4A, siRNA successfully inhibited HELLS expression in these cell lines at the RNA and protein levels. In the HT29 cells, the RNA and protein expression levels in the siRNA group were 22% and 41%, respectively, compared with the NC group. Similarly, in the HCT116 cells, the RNA and protein expression levels were 27% and 24%, respectively. Cell proliferation was tested by CCK-8 assay. The cells in the siRNA group exhibited a significantly impaired growth rate (p<0.001, Figure 4B). A colony generation assay showed that HELLS siRNA dramatically inhibited the size and number of colonies in both cell lines compared with the cells in the NC group (Figure 4C). We further examined whether the cell cycle was affected by the downregulation of HELLS. Cell cycle distribution was analyzed by flow cytometry using PI stained cells. A significant increase in the G2+M fraction was observed in the HELLS siRNA group in both cell lines (Figure 4E–G and I–K). In the HT29 cells, 82.29% of the HELLS siRNA cells were in G2+M compared to 23.12% and 25.85% of the control and negative control cells. In the HCT116 cells, 35.41% of the transfectants were in G2+M, and only 16.08% and 15.26% of control and negative control cells were in that phase category (Figure 4H and L). Thus, the cell cycle was significantly inhibited by G2/M arrest after HELLS knockdown. Taken together, our results showed that downregulation of HELLS inhibits cell proliferation, colony generation and the cell cycle by G2/M arrest in colorectal cancer cells.
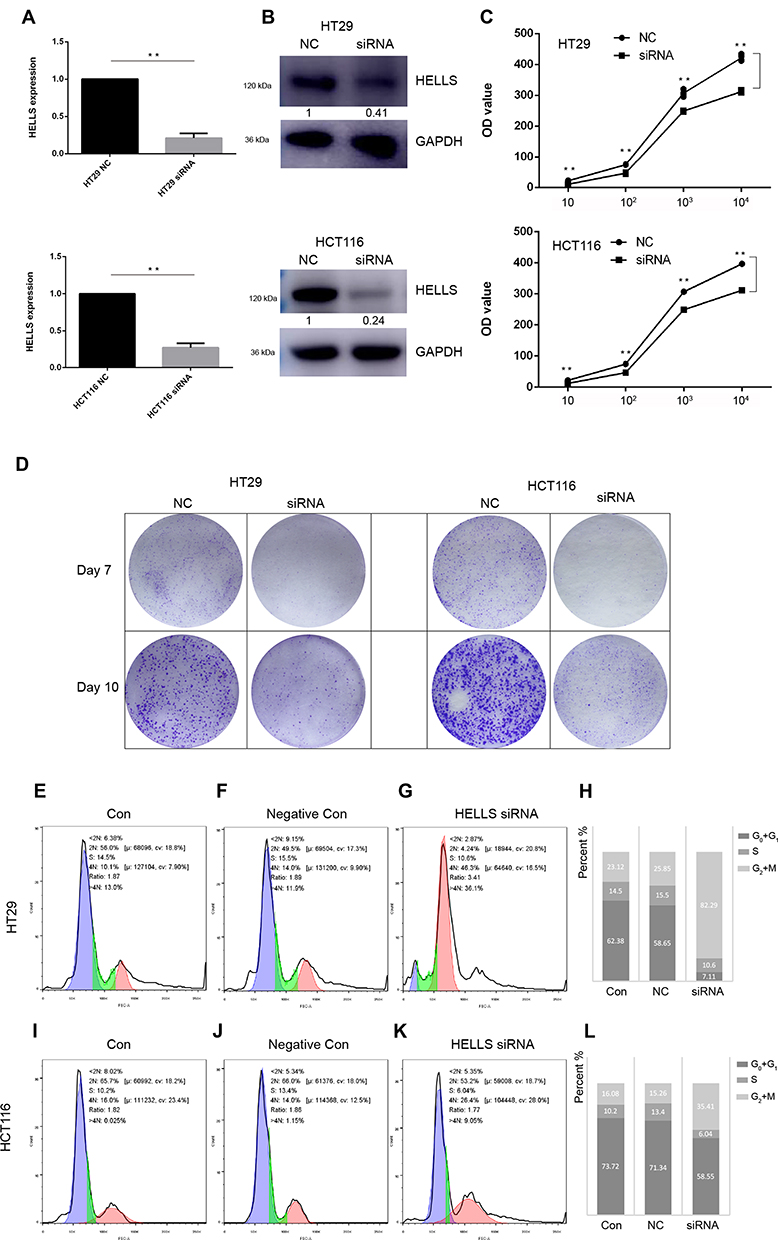 |
Figure 4 HELLS functions in proliferation, colony generation and the cell cycle in colorectal cancer cells. (A, B) qRT-PCR and Western blotting were used to determine whether siRNA successfully decreased HELLS expression at the RNA and protein levels, respectively. **p < 0.01. (C) Cell proliferation after siRNA transfection was significantly decreased in HT29 cells and HCT116 cells, as determined by CCK-8 assay. The initial cell density was 10, 102, 103, and 104 cells per well. The cells were cultured for 3 days before the CCK-8 assay was performed. **p < 0.01. (D) Results from the colony generation assay for the HELLS siRNA cells and the negative control (NC) cells. After the first transfection, siRNA or NC was added on Day 3. (E–G) and (I–K). The cell cycle status after transfection of the HELLS siRNA was tested by flow cytometry of cells stained by PI. (H) and (L) Quantification of each stage is shown in the stacked histogram. In HT29, 82.29% of the HELLS siRNA cells were in G2+M, and 23.12% and 25.85% in control and negative control cells. In HCT116, 35.41% of the transfectants were in G2+M, and only 16.08% and 15.26% of control and negative control cells in G2+M. |
Discussion
HELLS, initially identified as an essential protein required for lymphoma growth, participates in the establishment and maintenance of DNA methylation with chromatin remodeling through its ATPase activity.16 Recent advances have indicated that HELLS exerts great influence on the cell biology of multiple cancer cells. Several lines of evidence also suggested the significance of HELLS in clinicopathology, prognosis, and the development of therapeutic targets. In hepatocellular carcinoma, highly expressed HELLS was associated with liver invasion, venous invasion, and advanced pathological grade.14 Overexpressed HELLS might regulate multiple bioprocesses, such as cell proliferation, cell migration, and antiapoptosis in hepatocellular carcinoma cells. In glioblastoma, HELLS was also associated with low pathological grades, advanced clinical stages and poor prognoses.17 Downregulated HELLS led to impaired cell proliferation, low survival and little self-renewal, as well as increased DNA damage in the glioblastoma cells in vitro and in vivo. A study also suggested that HELLS was correlated with CRC metastasis.15 In our study, on the basis of the bioinformatics and experimental evidence, we determined that HELLS was significantly increased in CRC tissues compared with that in matched normal tissues. We also correlated HELLS expression with many clinicopathological parameters in CRC and found that a high correlation of it with the T stage, M stage, and clinical TNM stage, as well as a pathological grade. Furthermore, our results implicated highly expressed HELLS as a correlate in overall survival of patients with CRC.
DNA methylation is an essential epigenetic regulation pathway, which is defined as a spectrum of expression variations that do not change the DNA sequence.18–21 DNA methylation of CpG islands or non-CpG islands can influence the activities of gene promoters, thus leading to epigenetic regulation of targeted genes.22 The methylation process is realized by a series of enzymes, named DNA methyltransferases (DNMTs).23 In addition to these routine factors, recent advances have suggested that HELLS also plays a role in de novo DNA methylation.12 Silencing of stable genes through their promoters is mediated by HELLS and requires G9a to form the HELLS/G9a histone methylase complex. Similarly, another study showed that HELLS could cooperate with DNMTs and histone deacetylases (HDACs) epigenetic regulation of genes.24 However, HELLS-mediated epigenetic silencing is also realized by a DNA methylation-independent pathway.25 For example, HELLS recruits G9a to alter the methylation levels of the histones, which results in decreased expression of factors that contribute to cancer metabolism.26 Furthermore, it was also suggested that HELLS might be involved in nucleosome occupation and thus alters the nucleosome position in hepatocellular carcinoma.14 These observations pinpointed the mechanisms of HELLS-mediated epigenetic regulation.
Current studies have demonstrated that cancer cells use HELLS to regulate multiple biological processes in cancer development and progression. Knocking down HELLS led to suppressed cell growth and migration, which was accompanied by inhibited glycolysis.14 Further analysis revealed that HELLS might promote oncogenic phenotypes in cancers via inhibition of multiple tumor suppressor genes. A study also suggested that HELLS could control stemness gene expression to promote stem cell proliferation and maintain self-renewal by interacting with two transcriptional factors, E2F3 and MYC.17 In CRC, HELLS induces the expression of TET2 and TET3, which significantly impair metastasis, whereas in most reported cases, HELLS served as a positive regulator of metastasis.15 Our results demonstrated that knocking down HELLS significantly decreased CRC proliferation, colony generation and the cell cycle by inducing G2/M arrest. However, the scratch test suggested that HELLS knockdown by siRNA transfection could decrease the migration ability of the HT29 and HCT116 cells (data not presented). This discrepancy might be explained by the fact that DNA methylation varies depending on the context.22
In summary, our results suggest an oncogenic role of HELLS in CRC in vitro. Publicly available data sets and clinical samples were collected, and highly expressed HELLS was demonstrated in tumor tissue compared with that of peritumoral tissue. Functionally, HELLS is responsible for maintaining cell proliferation, colony generation and the cell cycle in CRC cells.
Abbreviations
HELLS, helicase lymphoid-specific; CRC, Colorectal cancer; GEO, Gene Expression Omnibus; IHC, Immunohistochemical; PPI, protein-protein interaction; DNMTs, DNA methyltransferases; HDACs, histone deacetylases; CIMP, CpG island methylation phenotype.
Ethics Approval and Informed Consent
This study was approved by the Ethics Committee for Human Research, Central South University and was conducted according to the approved guidelines. The patients whose tissues were used had provided written informed consent, in accordance with the Declaration of Helsinki.
Disclosure
The authors declare no conflicts of interest.
References
1. Benson AB, Venook AP, Cederquist L, et al. Colon cancer, version 1.2017, NCCN clinical practice guidelines in oncology. J Natl Compr Canc Netw. 2017;15(3):370–398. doi:10.6004/jnccn.2017.0036
2. Bray F, Ferlay J, Soerjomataram I, Siegel RL, Torre LA, Jemal A. Global cancer statistics 2018: GLOBOCAN estimates of incidence and mortality worldwide for 36 cancers in 185 countries. CA Cancer J Clin. 2018;68(6):394–424. doi:10.3322/caac.v68.6
3. Chen W, Zheng R, Baade PD, et al. Cancer statistics in China, 2015. CA Cancer J Clin. 2016;66(2):115–132. doi:10.3322/caac.21338
4. Siegel RL, Miller KD, Jemal A. Cancer statistics, 2016. CA Cancer J Clin. 2010;60(5):277–300. doi:10.3322/caac.20073
5. Van CE, Cervantes A, Nordlinger B, Arnold D, Group EGW. Metastatic colorectal cancer: ESMO clinical practice guidelines for diagnosis, treatment and follow-up. Ann Oncol. 2014;111(3):330–339.
6. Migliore L, Migheli F, Spisni R, Coppedè F. Genetics, cytogenetics, and epigenetics of colorectal cancer. J Biomed Biotechnol. 2011;2011(Suppl 2):792362. doi:10.1155/2011/792362
7. You JS, Jones P. Cancer genetics and epigenetics: two sides of the same coin?. Cancer Cell. 2012;22(1):9–20. doi:10.1016/j.ccr.2012.06.008
8. Puccini A, Berger MD, Naseem M, et al. Colorectal cancer: epigenetic alterations and their clinical implications. Biochim Biophys Acta. 2017;1868(2):439–448.
9. Jin B, Robertson KD. DNA methyltransferases, DNA damage repair, and cancer. Adv Exp Med Biol. 2013;754(754):3–29.
10. Au SL, Wong CC, Lee JM, et al. Enhancer of zeste homolog 2 epigenetically silences multiple tumor suppressor microRNAs to promote liver cancer metastasis. Hepatology. 2012;56(2):622–631.
11. Jiamu D, Johnson LM, Jacobsen SE, Patel DJ. DNA methylation pathways and their crosstalk with histone methylation. Nat Rev Mol Cell Biol. 2015;16(9):519–532. doi:10.1038/nrm4043
12. Myant K, Termanis A, Sundaram AYM, et al. LSH and G9a/GLP complex are required for developmentally programmed DNA methylation. Genome Res. 2011;21(1):83–94. doi:10.1101/gr.108498.110
13. Muegge K. Lsh, a guardian of heterochromatin at repeat elements. Biochem Cell Biol. 2005;83(4):548–554. doi:10.1139/o05-119
14. Law CT, Wei L, Tsang FHC, et al. HELLS regulates chromatin remodeling and epigenetic silencing of multiple tumor suppressor genes in human hepatocellular carcinoma. Hepatology. 2019;69(5):2013–2030. doi:10.1002/hep.30414
15. Jia J, Shi Y, Chen L, et al. Decrease in lymphoid specific helicase and 5-hydroxymethylcytosine is associated with metastasis and genome instability. Theranostics. 2017;7(16):3920–3932. doi:10.7150/thno.21389
16. Geiman T, Muegge K. Lsh, an SNF2/helicase family member, is required for proliferation of mature T lymphocytes. Proc Natl Acad Sci U S A. 2000;97(9):4772–4777. doi:10.1073/pnas.97.9.4772
17. Zhang G, Dong Z, Prager BC, et al. Chromatin remodeler HELLS maintains glioma stem cells through E2F3 and MYC. JCI Insight. 2019;4(7):e126140. doi:10.1172/jci.insight.126140
18. Pogribny I. Epigenetic events in tumorigenesis: putting the pieces together. Exp Oncol. 2010;32(3):132–136.
19. Du J, Johnson LM, Jacobsen SE, Patel DJ. DNA methylation pathways and their crosstalk with histone methylation. Nat Rev Mol Cell Biol. 2015;16(9):519–532. doi:10.1038/nrm4043
20. Jin B, Robertson KD. DNA methyltransferases, DNA damage repair, and cancer. In: Karpf AR, editor. Epigenetic Alterations in Oncogenesis. New York, NY: Springer; 2013:3–29.
21. Tsai H-C, Baylin SB. Cancer epigenetics: linking basic biology to clinical medicine. Cell Res. 2011;21(3):502–517. doi:10.1038/cr.2011.24
22. Jones PA. Functions of DNA methylation: islands, start sites, gene bodies and beyond. Nat Rev Genet. 2012;13(7):484–492. doi:10.1038/nrg3230
23. Lao VV, Grady WM. Epigenetics and colorectal cancer. Nat Rev Gastroenterol Hepatol. 2011;8(12):686–700. doi:10.1038/nrgastro.2011.173
24. Myant K, Stancheva I. LSH cooperates with DNA methyltransferases to repress transcription. Mol Cell Biol. 2008;28(1):215–226. doi:10.1128/MCB.01073-07
25. Zhou R, Han L, Li G, Tong T. Senescence delay and repression of p16 INK4a by Lsh via recruitment of histone deacetylases in human diploid fibroblasts. Nucleic Acids Res. 2009;37(15):5183–5196. doi:10.1093/nar/gkp533
26. Jenness C, Giunta S, Müller MM, Kimura H, Muir TW, Funabiki H. HELLS and CDCA7 comprise a bipartite nucleosome remodeling complex defective in ICF syndrome. Proc Natl Acad Sci U S A. 2018;115(5):E876–E885. doi:10.1073/pnas.1717509115
 © 2019 The Author(s). This work is published and licensed by Dove Medical Press Limited. The
full terms of this license are available at https://www.dovepress.com/terms
and incorporate the Creative Commons Attribution
- Non Commercial (unported, 3.0) License.
By accessing the work you hereby accept the Terms. Non-commercial uses of the work are permitted
without any further permission from Dove Medical Press Limited, provided the work is properly
attributed. For permission for commercial use of this work, please see paragraphs 4.2 and 5 of our Terms.
© 2019 The Author(s). This work is published and licensed by Dove Medical Press Limited. The
full terms of this license are available at https://www.dovepress.com/terms
and incorporate the Creative Commons Attribution
- Non Commercial (unported, 3.0) License.
By accessing the work you hereby accept the Terms. Non-commercial uses of the work are permitted
without any further permission from Dove Medical Press Limited, provided the work is properly
attributed. For permission for commercial use of this work, please see paragraphs 4.2 and 5 of our Terms.