
Back to Journals » Journal of Inflammation Research » Volume 18

Downregulated MYL1 Emerges as a Promising Diagnostic Biomarker for Rheumatoid Arthritis
Authors Yang C, Huang Z  , Zheng X, Tang H, Qin W , Liang Y, Chen H, Hao W, Yi D, Lu WW , Chen Y
Received 3 July 2025
Accepted for publication 7 December 2025
Published 18 December 2025 Volume 2025:18 Pages 17693—17714
DOI https://doi.org/10.2147/JIR.S551219
Checked for plagiarism Yes
Review by Single anonymous peer review
Peer reviewer comments 6
Editor who approved publication: Dr Ujjwol Risal
Chaoquan Yang,1,* Zhiling Huang,1,* Xifan Zheng,1,* Haojun Tang,1 Wenpeng Qin,1 Yicheng Liang,1 Haidong Chen,1 Wenjun Hao,1 Dan Yi,2 William W Lu,3 Yan Chen1
1Department of Bone and Joint Surgery, The First Affiliated Hospital of Guangxi Medical University, Nanning, Guangxi, People’s Republic of China; 2Faculty of Pharmaceutical Sciences, Shenzhen Institute of Advanced Technology, Chinese Academy of Sciences, Shenzhen, Guangdong, People’s Republic of China; 3Department of Orthopedics and Traumatology, The University of Hong Kong, Hong Kong, People’s Republic of China
*These authors contributed equally to this work
Correspondence: Yan Chen, Department of Bone and Joint Surgery, The First Affiliated Hospital of Guangxi Medical University, Nanning, Guangxi, People’s Republic of China, Tel/Fax +8607715319091, Email [email protected]
Purpose: Rheumatoid arthritis (RA) affects millions of people worldwide and causes chronic joint pain with incompletely understood pathogenesis and challenging management. Myosin light chain 1 (MYL1) a muscle regulatory protein, has an unknown role in RA pathogenesis.
Methods: We analyzed transcriptomic data from RA patients and healthy controls in the Gene Expression Omnibus (GEO). Using least absolute shrinkage and selection operator (LASSO) regression and random forest, we identified differentially expressed genes (DEGs). Diagnostic performance was assessed using receiver operating characteristic (ROC) curves and area under the curve (AUC). To explore potential mechanisms, we conducted functional enrichment and immune-infiltration analyses. We further validated MYL1 expression in a rat RA model using qRT-PCR and Western blotting.
Results: We found MYL1 significantly downregulated in RA with high diagnostic value (AUC > 0.8). Enrichment analyses revealed its involvement in muscle structure development, immune regulation, and calcium signaling pathways. CIBERSORT analysis indicated associations with immune cell infiltration, particularly regulatory T cells, activated natural killer (NK) cells, and M1 macrophages. The rat model confirmed reduced MYL1 expression at both mRNA (p < 0.001) and protein (p = 0.009) levels, consistent with human data.
Conclusion: MYL1 is consistently downregulated in RA and may serve as a potential diagnostic biomarker. The results indicate that MYL1 may be involved in the pathological process of RA through calcium signaling, muscle function, and immune cell regulation. However, further clinical and mechanistic studies are warranted.
Keywords: rheumatoid arthritis, myosin light chain 1, machine learning algorithm, immune cells
Introduction
Rheumatoid arthritis (RA) is a prevalent autoimmune joint disorder that imposes a substantial global burden.1 In 2020, approximately 17.6 million individuals were affected by RA worldwide, corresponding to an age-standardized prevalence of 208.8 cases per 100,000 population.2 This represents a notable 14.1% increase compared to the prevalence reported in 1990.2 RA is clinically characterized by joint pain, swelling, deformity, morning stiffness, and extra-articular manifestations.3,4 The etiology of RA is multifactorial and involves autoimmune dysregulation, genetic predisposition, and potential infections. Currently, drug therapy for RA mainly aims to relieve symptoms and control disease progression, whereas surgical interventions are typically reserved for end-stage disease to alleviate pain and improve joint function.1,5,6 Current biomarkers—such as rheumatoid factor, anti‑cyclic citrullinated peptide (anti‑CCP) antibodies, erythrocyte sedimentation rate (ESR), and C‑reactive protein (CRP)—do not achieve sufficient sensitivity or specificity in all patients, particularly those with seronegative RA, underscoring unmet diagnostic needs. Despite significant advances in biologic and targeted synthetic DMARD therapies, many RA patients still fail to achieve sustained remission or experience adverse effects, highlighting persistent therapeutic challenges.
Among the various RA pathological changes, the most critical one is the disruption of immune tolerance, resulting in the immune system erroneously identifying self-tissues as foreign antigens.7 Immune complexes then activate synovial cells and trigger them to proliferate and release various inflammatory mediators including tumor necrosis factor-alpha (TNF-α), interleukin-1 (IL-1), and interleukin-6 (IL-6).8–14 Simultaneously, immune cells such as T-cells and B-cells infiltrate synovial tissues, further exacerbating the progression of synovial inflammation. Under the stimulation of inflammation, the synovial tissue forms a pannus—an abnormal vascular proliferation. The pannus tissue grows over the joint surface and invades the cartilage and bone, eventually leading to joint destruction—the key pathological characteristic of RA.15,16
Moreover, beyond joints, people with RA frequently develop skeletal muscle atrophy and weakness,17,18 suggesting a muscle–joint–immune axis that may influence disease activity. The gene family, myosin light chains, is integral to the processes of muscle contraction and cellular motility. Among these genes, myosin light chain 1 (MYL1) stands out with its unique structural features, including the EF-hand domain, which functions as a calcium sensor by binding to Ca2⁺ ions, thus playing a regulatory role in muscle contraction.19 These processes are increasingly recognized as modulators of immune and stromal cell behavior: cytoskeletal tension can influence synoviocyte migration and invasiveness;20 calcium-dependent signaling helps regulate cytokine production and immune-cell activation;21 and muscle-derived signals may shape systemic inflammation.22 Together, these observations provide a biologically plausible link between MYL1 and inflammatory pathways relevant to RA.23 Furthermore, the mutation of MYL1 leads to severe congenital myopathies.24–30 The potential role of MYL1 in RA pathogenesis, including its involvement in immune activation and synovial injury, is currently unknown and has not been investigated.
The growing use of machine learning in biomarker discovery offers powerful tools for analyzing high-dimensional omics data and identifying reproducible candidates with clinical potential. In this study, we investigated differentially expressed genes (DEGs) in synovial tissue from RA patients and healthy controls. By integrating two machine learning algorithms, least absolute shrinkage and selection operator (LASSO) regression and random forest (RF), and supplementing them with cross-validation to mitigate overfitting, we systematically ranked features and prioritized genes consistently highlighted across methods and datasets. This integrative computational approach identified MYL1 as a candidate of interest. Subsequent bioinformatics analyses, including functional enrichment and immune infiltration profiling, along with correlation analyses and animal experiments, were employed to further assess its relevance to RA pathogenesis. Based on these findings, we hypothesize that MYL1 may serve as a diagnostic biomarker and therapeutic target for RA.
Materials and Methods
Data Acquisition and Processing
Gene Expression Omnibus (GEO) database (http://www.ncbi.nlm.nih.gov/geo/) was searched using the term “rheumatoid arthritis” and narrowed the results to “Series” and “Expression profiling by array” for Homo sapiens. A total of 100 datasets were returned, of which six were eligible and downloaded: GSE205962, GSE10500, GSE15573, GSE206848, GSE236924 and GSE77298 (Table 1). Data correction and batch effect removal were performed using the “limma” package (version 3.52.4) in R (version 4.2.1). The datasets included tissue samples from RA patients (n = 93; RA group) and healthy individuals (n = 43; control group). In addition, GSE1919, which contained synovial tissue samples from both RA patients (n = 5) and healthy individuals (n = 5), was used as a validation dataset for unbiased external validation. The results of data collation were visualized using box plots (Figure S1). The study was approved by the Clinical Research Ethics Committee of Guangxi Medical University (Approved Number: 202208035).
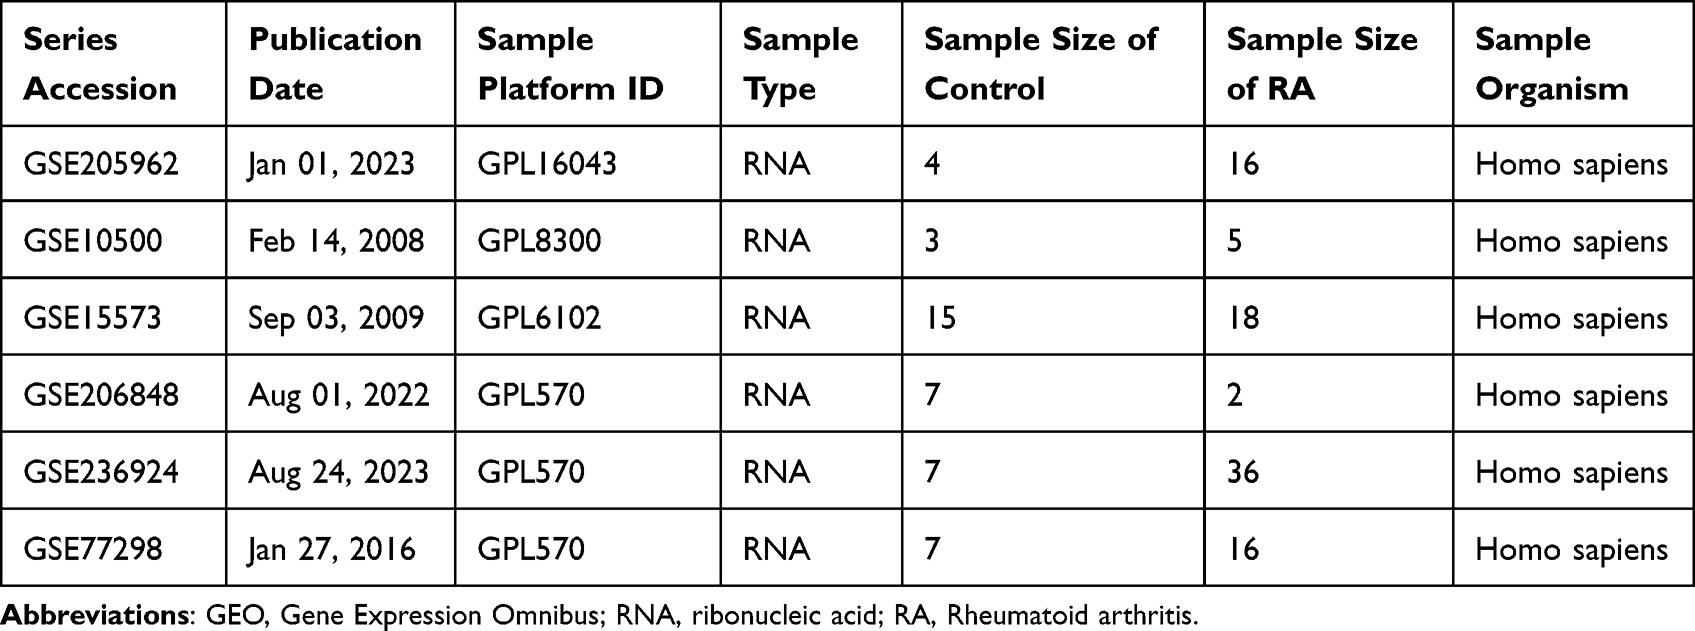 |
Table 1 Information on the GEO Dataset Used |
Screening Feature Genes
The identifying of DEGs was performed as previously described.31 Briefly, we employed the “limma” package in R to detect DEGs within all datasets, applying a threshold of log2 fold change greater than one and an adjusted p-value under 0.05. Subsequently, to determine a selection of marker genes, the LASSO regression technique was used, leveraging the “glmnet” package (version 4.1–8) alongside the “e1071” package (version 1.7–14), family = “binomial”, standardize = TRUE, using 10-fold cross-validation (cv.glmnet, nfolds = 10). The final penalty was set to lambda.1se to favor parsimony. Additionally, through a RF analysis with the “randomForest” package (version 4.7–1.2), with ntree = 2000, mtry = floor(sqrt(p)), nodesize = 1, and permutation importance (importance = TRUE, type = 1). Importance stability was assessed by 100 bootstrap resamples, another collection of marker genes was pinpointed, focusing on those with gene importance scores surpassing 2 (rfGenes > 2).32 Last, by intersecting the marker genes identified by the two methods, a subset of candidate marker genes was identified. One muscle-related gene, which was not previously reported to be associated with RA, was selected for further analysis based on the prevalence of muscle symptoms in RA.17–19
Final Validation and Accuracy Assessment
Violin plots were produced utilizing the “ggpubr” package (version 0.6.0) to illustrate variations in marker gene expression between the RA and the control groups, considering a p-value of less than 0.05 as statistically significant. To evaluate the marker genes’ ability to differentiate the RA samples from the controls, receiver operating characteristic (ROC) curves were plotted with the “pROC” package (version 1.18.5). The accuracy was established by computing the area under the curve (AUC), where an AUC exceeding 0.7 was deemed to indicate satisfactory accuracy.31 To confirm the validity of the results from the experimental group, ROC curve analysis, along with differential expression analysis, was applied to the validation dataset.
Analysis of Marker Gene Correlation
After identifying the marker genes associated with RA based on the established screening criteria, samples were categorized into high-expression and low-expression groups according to the expression levels of the marker genes. To identify DEGs strongly associated with the marker genes, we conducted a correlation analysis employing Spearman correlation coefficient (with BH correction for multiple testing). Associations meeting the thresholds of |r| > 0.6 and FDR < 0.05 were considered significant. Data visualization was performed using heatmaps and volcano plots, and gene correlation bubble plots were generated using the “corrplot” package (version 0.95).
Functional Enrichment Analysis
Through the application of Kyoto Encyclopedia of Genes and Genomes (KEGG) pathways and Gene Ontology (GO) assessments, the functional data pertinent to DEGs were mapped onto specific pathways and biological processes.31 This allowed for the exploration of the possible mechanisms through which these genes may contribute to RA. Additionally, we employed gene set enrichment analysis (GSEA) to investigate the enrichment of biological pathways associated with high and low marker gene expression levels. The analysis utilized a weighted statistic with 1000 permutations, and gene sets were filtered to include those containing between 10 and 500 genes.
Evaluation of Immune Cell Penetration and Associated Analysis
The examination of immune cell infiltration was conducted using the “CIBERSORT” package (version 0.1.0),33 allowing for a quantitative assessment of the distribution of 22 lymphocyte subtypes within the samples. To illustrate the findings, stacked bar graphs and box plots were employed, with significance determined by a p-value threshold of 0.05. To explore the connections between selected marker genes and various immune cell categories, Spearman correlation tests were utilized. Significant gene-immune cell interactions were identified when the correlation coefficient |r| exceeded 0.6 and adjusted p-values were below 0.05.31 The results are presented graphically.
Competitive Endogenous RNA (ceRNA) Network Construction
The regulatory relationships between marker genes and microRNAs (miRNAs) were predicted using TargetScan (https://www.targetscan.org/; contextual score percentile ≥ 90),34,35 miRanda (Director package, version 3.1.9; downloaded from http://mirtoolsgallery.tech/; top 1% genes),36 and miRDB (https://mirdb.org/; target score ≥ 60).37 Subsequently, the spongeScan database was used to identify long non-coding RNAs (lncRNAs) that shared microRNA response elements (MREs) and could competitively bind to the selected miRNAs.38 The network was visualized using Cytoscape v3.10.1, an open-source platform for building complex networks.39
Establishment of the Rat RA Model and Collection of Tissues
Sample size was determined a priori using G*Power 3.1 for a two-tailed t-test (α = 0.05, power = 0.80). Based on previous studies in collagen-induced arthritis rat models showing large gene expression differences between RA and control groups,40 a mean difference of 1.0 and a standard deviation of 0.6 (Cohen’s d = 1.67) were assumed. The estimated sample size was 8 rats per group; to ensure adequate power, 15 rats were included per group. Therefore, A total of 30 male Sprague-Dawley rats, aged 8 weeks and weighing between 220 and 250 grams, were purchased from the Experimental Animal Center of Guangxi Medical University. All rats were housed in a specific pathogen-free (SPF) environment and randomly divided into the control and the RA groups (n =15 for each group). After one week of acclimatization, the rats received a subcutaneous injection of 0.2 mL of bovine type II collagen (2 mg/mL, Chondrex, USA) 1:1 emulsified with an equal volume of complete Freund’s adjuvant (CFA, Sigma-Aldrich, containing 5 mg/mL Mycobacterium tuberculosis) at the base of the tail, to establish the collagen-induced arthritis (CIA) rat model.41 The control group received an equal volume of saline by subcutaneous injection. Seven days later, a booster immunization was administered by subcutaneous injection, also at the tail, using a 1 mL Luer-lock syringe. The injection consisted of 0.05 mL of a mixture emulsified 1:1 with bovine type II collagen (1 mg/mL) and incomplete Freund’s adjuvant (IFA, purchased from Sigma-Aldrich).
The development of arthritis was monitored every 4 days after the initial immunization. The severity of arthritis in each paw was quantified using a standard arthritis index scoring system (0–4 points per paw; maximum score = 16 points per rat). 0 = no visible signs of inflammation; 1 = swelling confined to one digit; 2 = swelling involving two or more digits; 3 = moderate redness and swelling of all digits and the paw; 4 = severe swelling and deformation involving the paw and ankle joints.42
At day 28 postoperatively, all rats underwent euthanasia by intraperitoneal administration of sodium pentobarbital at 150 mg/kg. Synovial tissue was collected and immediately stored at −80°C for subsequent analysis by a blinded operator. To validate the systemic inflammatory response, we performed qRT-PCR to measure the mRNA expression levels of TNF-α and IL-6, using GAPDH as an internal reference.
RNA Extraction and qRT-PCR
Total RNA was extracted using the RNAeasy™ Plus Animal RNA Extraction Kit (Beyotime, Shanghai).31 RNA concentration was determined with a Nanodrop spectrophotometer (Thermo Fisher, USA). One microgram of total RNA was reverse transcribed into cDNA using the HyperScript™ RT SuperMix for qPCR (APExBIO, USA). qRT-PCR was performed with 2X SYBR Green qPCR Master Mix (APExBIO, USA), and primers were synthesized (Nanning GenSys Biotechnology Company Limited, China). GAPDH was used as the internal control. Relative mRNA expression levels were calculated using the 2^-ΔΔCt method. All experiments were performed in triplicate. Primer sequences are listed in Table 2.
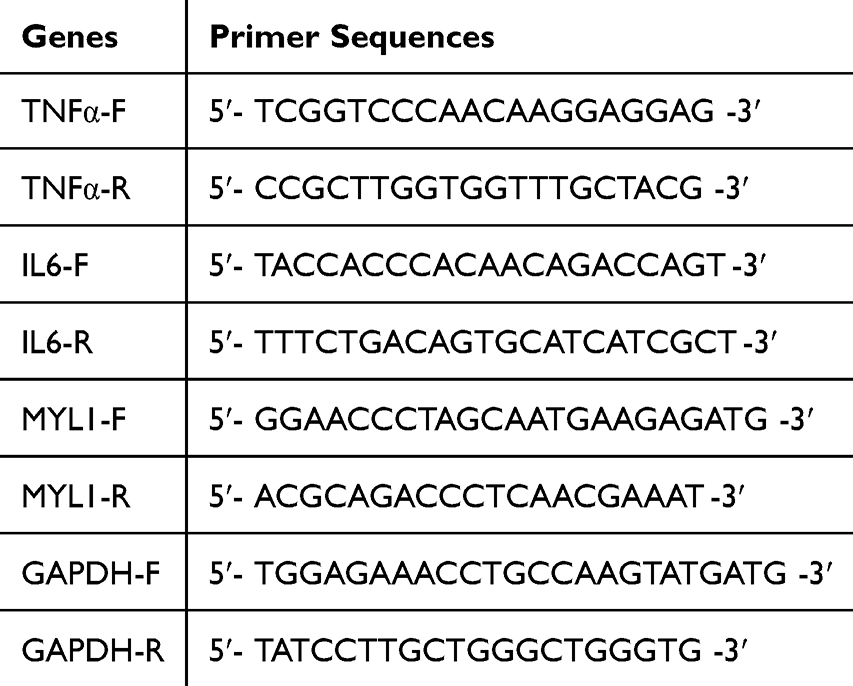 |
Table 2 Primer Sequences for PCR |
Western Blot
Total protein was isolated from synovial cells utilizing RIPA lysis buffer supplemented with Serine protease inhibitor (BOSTER, Wuhan, China), phosphatase inhibitor cocktail (CoWin Biotech, Jiangsu, China), and protease inhibitor cocktail (APExBIO, USA).31,43 The samples were mixed with loading buffer, the proteins were denatured in a metal bath at 100°C for 10 minutes and electrophoresed on a 10% polyacrylamide gel. After transfering onto a PVDF membrane, the proteins were blocked at room temperature for 2 hours and then incubated overnight with primary antibodies against MYL1 (Proteintech, Wuhan, China; dilution 1:1500) and GAPDH (Proteintech, Wuhan, China; dilution 1:5000). The membrane was then incubated for 1 hour with a goat anti-rabbit IgG secondary antibody (Zen Bioscience, Chengdu, China), and visualization was performed using chemiluminescence.
Statistical Analysis
The Shapiro–Wilk test was used to evaluate the normal distribution of qRT-PCR and Western blotting data. Independent sample t-tests were utilized for intergroup comparisons of variables showing normal distribution. The data are displayed as the average ± standard deviation. A p-value below 0.05 was considered statistically significant. Statistical analyses were executed using GraphPad Prism 9.5 (GraphPad Software, USA).
Results
Identification of DEGs
The detailed research flowchart is shown in Figure 1. As shown in Figure 2A and B, principal component analysis (PCA) demonstrated that batch effects were largely eliminated following batch correction and data normalization, as samples from different datasets became more intermixed in the PCA plot. A total of 34 DEGs were identified, including 28 that were downregulated and 6 that were upregulated. These DEGs are illustrated in Figures 2C and D, highlighting distinct expression patterns between the groups.
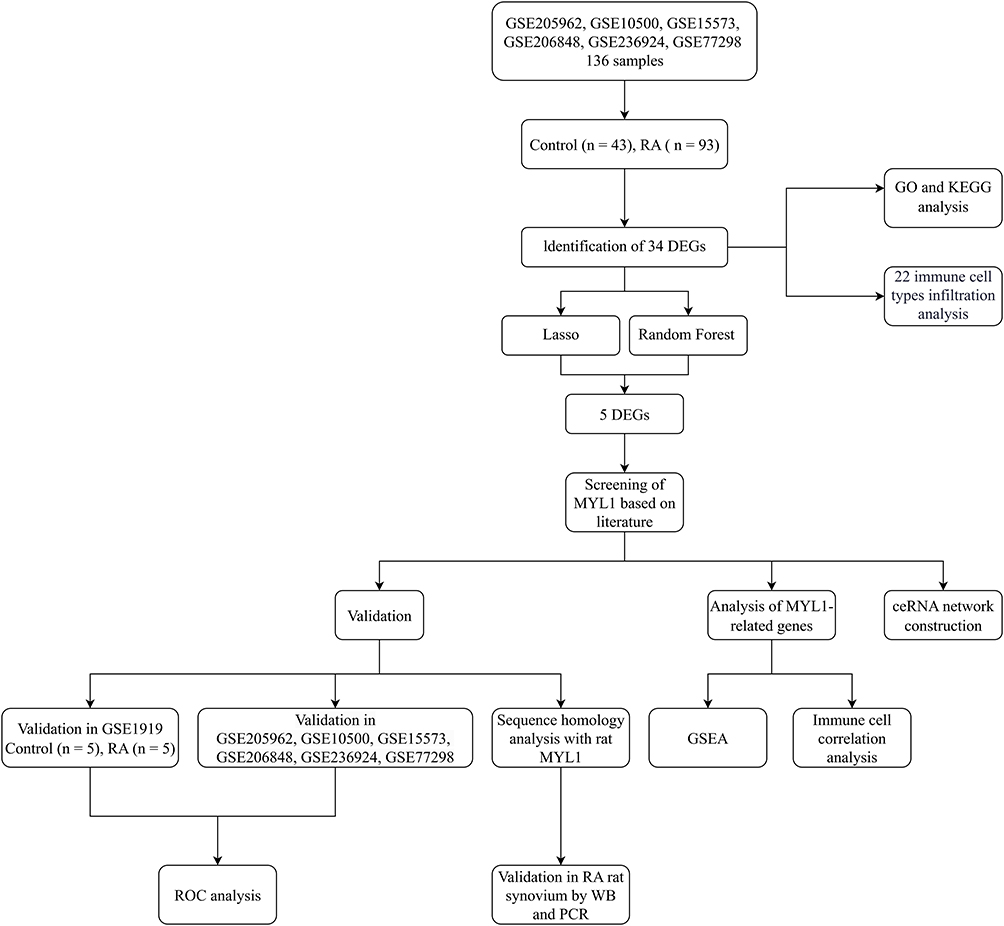 |
Figure 1 The flow chart. Abbreviations: DEG, differentially expressed gene; GEO, Gene Expression Omnibus; GO, Gene Ontology; KEGG, Kyoto Encyclopedia of Genes and Genomes; LASSO, least absolute shrinkage and selection operator; ROC, receiver operating characteristic; WB, Western blotting; PCR, polymerase chain reaction; GSEA, gene set enrichment analysis; ceRNA, competing endogenous RNA. |
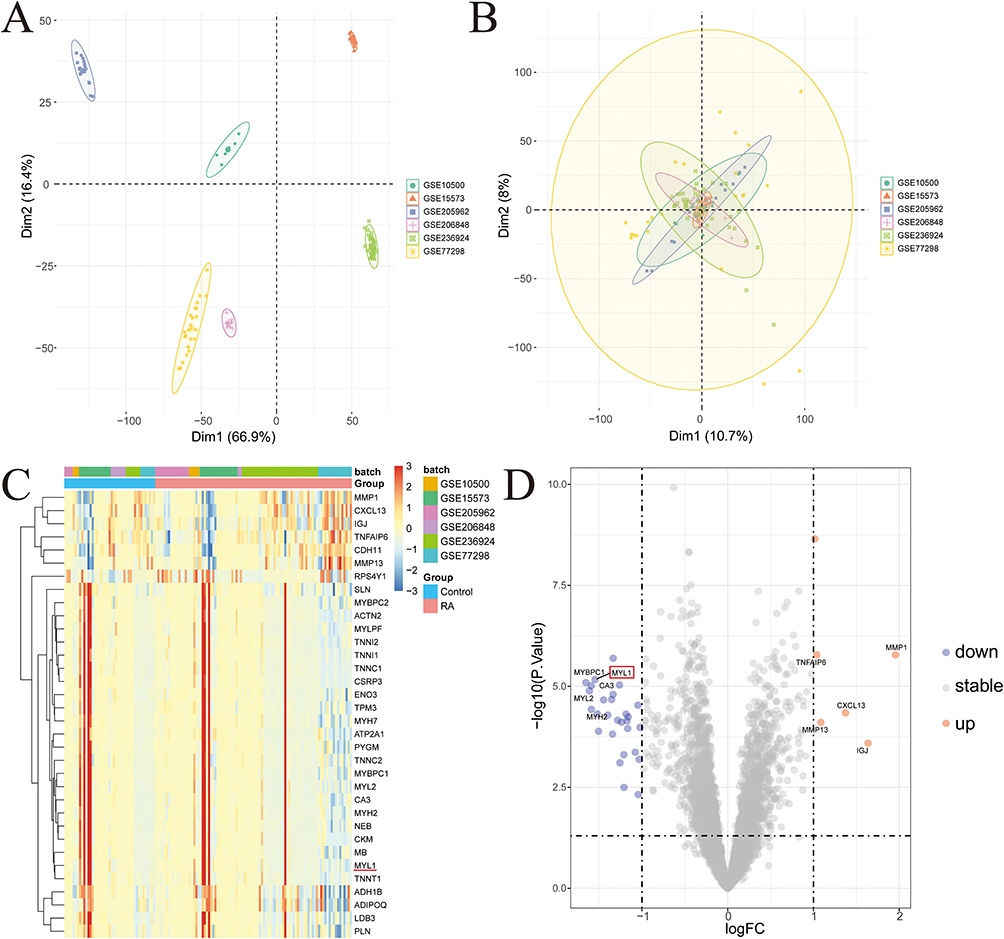 |
Figure 2 Identification of DEGs. (A and B) Batch pre-correction and post-correction for the GSE205962, GSE10500, GSE15573, GSE206848, GSE236924, and GSE77298 datasets. (C) Heatmap of DEGs, with highly expressed DEGs in the samples marked in red and low-expressed DEGs in the samples marked in blue, the red horizontal line indicates MYL1. (D) Volcano plots of DEGs, with red indicating up-regulated genes, blue indicating down-regulated genes, and gray indicating non-significant genes, MYL1 is marked by the red box. Abbreviation: DEG, differentially expressed gene. |
Screening Using a Combination of Two Machine Algorithms
As shown in Figure 3A, cross‑validation of the LASSO model determined the optimal penalty parameter (λ), minimizing the binomial deviance and yielding a set of feature genes. Figure 3B illustrates the coefficient profiles of the candidate genes as the λ value changed. Based on this analysis, seven genes were selected, including MYL1, IGJ, MMP1, CDH11, TNFAIP6, CXCL13, and RPS4Y1. Figure 3C presents the error rate of the RF model with an increasing number of decision trees, showing stable performance of the classifier. Figure 3D ranks the top genes according to their importance scores in the RF algorithm, among which MYL1, IGJ, MMP1, CDH11, and TNFAIP6 exhibited particularly high importance values. Finally, the Venn diagram (Figure 3E) shows that LASSO and random forest analyses jointly identified five overlapping genes: TNFAIP6, MYL1, CDH11, MMP1, and IGJ. These genes were therefore considered as potential disease‑related feature genes and candidates for further investigation in RA.
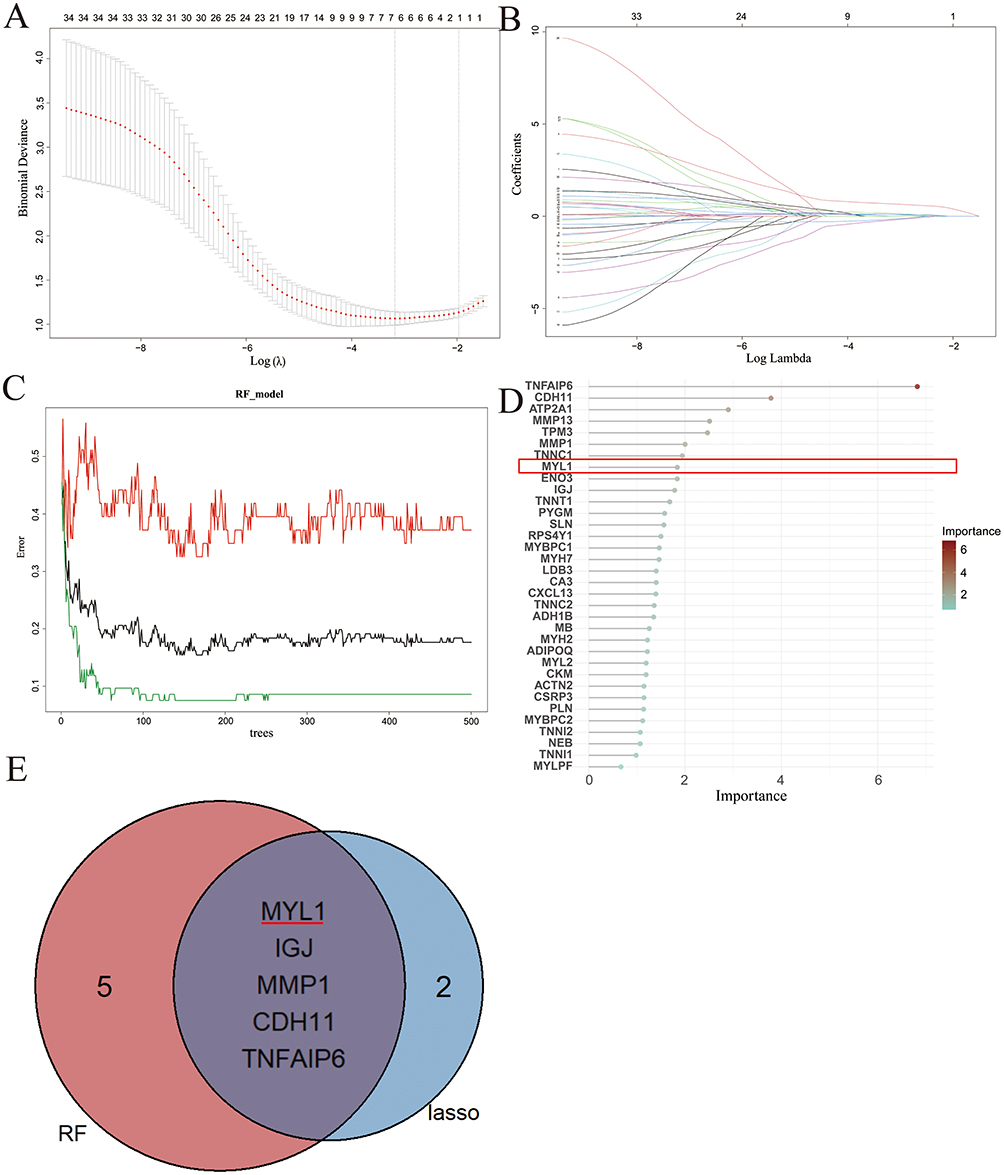 |
Figure 3 Identification of the MYL1. (A and B) LASSO regression counting differential genes, regression graphs, and cross-validation graphs, respectively, screening 13 differential genes. (C) Displays the cross-validation error curves of the random forest model. The x-axis represents the number of trees, and the y-axis shows the error rate. This plot evaluates the model’s stability and predictive performance to identify the most important differential genes. (D) Shows the importance scores of 10 differential genes based on the random forest model. The x-axis indicates the importance score, while the y-axis lists the gene names, MYL1 is marked by the red box. (E) Venn diagram of feature genes screened by the two machine learning methods to screen feature genes in a Venn diagram. Finally, five genes (ie, MYL1, IGJ, MMP1, CDH11, and TNFAIP6) were screened out. Abbreviations: DEG, differentially expressed gene, the red horizontal line indicates MYL1. |
Intergroup Differences and Accuracy of Signature Genes
Violin plots (Figure 4A–C, G and H) alongside ROC curves (Figure 4D–F, J and K) were utilized to illustrate the contrasting expression levels of the MYL1, IGJ, CDH11, TNFAIP6 and MMP1 genes in the training data. Findings showed decreased MYL1 expression and increased IGJ, CDH11, TNFAIP6, and MMP1 expression in the RA group compared with controls. The ROC curve’s area for the MYL1, CDH11, TNFAIP6 and MMP1 genes surpassed a threshold of 0.7.
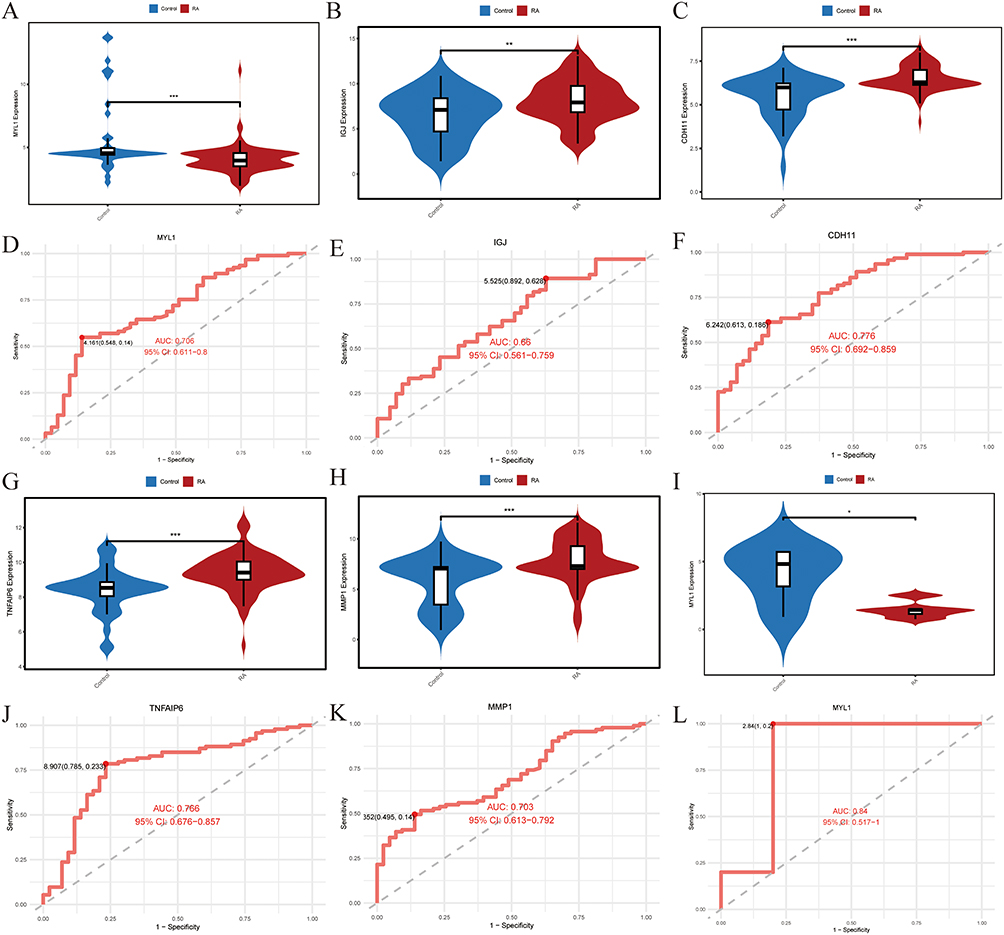 |
Figure 4 Differential expression and ROC curves of the five genes. (A–C, G and H) The differential expression of MYL1, IGJ, CDH11, TNFAIP6 and MMP1 genes in the control and RA groups. ** p<0.01, *** p < 0.001. (D–F, J and K) The ROC curves and areas under the curves of MYL1, IGJ, CDH11, TNFAIP6 and MMP1 genes. (I) The violin plot of MYL1 differential expression in the GSE1919 dataset. (L) The ROC curve and area under the curve for MYL1 in the GSE1919 dataset. * p < 0.05. Abbreviations: ROC, receiver operating characteristic; AUC, area under the curve; 95CI, 95% confidence interval; RA, Rheumatoid arthritis. |
MYL1 Expression Was Reduced in the Validation Group Dataset
Upon validation of the MYL1, IGJ, CDH11, TNFAIP6 and MMP1 genes in the GSE1919 dataset, it was found that only MYL1 displayed differential expression, aligning with previous findings (Figure 4I). In the GSE1919 dataset, the ROC curve for MYL1 demonstrated an area under the curve exceeding 0.7 (Figure 4L), reinforcing its status as the ultimately identified differential gene.
Expression of MYL1 in the Synovium of RA Rats
It was found that in both humans and rats, the MYL1 gene (myosin, light chain 1) is abbreviated as MYL1. Subsequently, these genes’ mRNA and protein sequences were retrieved from the NCBI database (https://www.ncbi.nlm.nih.gov/). Sequence comparison was performed and revealed that these two genes had high similarity in mRNA (77.93% similarity) and protein (92.78% similarity) sequences (Figure S2). Representative images of CIA model arthritis score at different levels (0–4) and the progression of arthritis scores during 28 days post‑immunization are shown in Figure 5A and B. Successful establishment of the CIA model was confirmed when rats exhibited a progressive increase in arthritis scores, accompanied by visible swelling and redness of the plantar and toe joints. At the molecular level, qRT‑PCR analysis confirmed markedly increased expression of the proinflammatory cytokines TNF‑α and IL‑6 in the synovial tissue of the non-injected paws of CIA rats compared with the control group (both P < 0.05; Figure 5C and D). Finally, qRT-PCR analysis demonstrated a pronounced reduction in MYL1 mRNA expression in RA samples relative to the control group (p < 0.001; Figure 5E). Similarly, Western blot showed that the protein expression level of MYL1 was significantly reduced in the RA group (p = 0.0093; Figure 5F and G, Figure S3). Consistent evidence from bioinformatics analyses and in vivo experiments in rats further demonstrated that the expression of MYL1 was significantly lower in the RA group compared to the control group.
 |
Figure 5 Validation of the CIA rat model and expression of MYL1 in synovium of the two groups of rats. (A) Representative images showing arthritis severity scoring from level 0 to 4. (B) Arthritis scores over 28 days in RA and control groups. (C and D) The mRNA expression of TNF-α and IL-6 in the synovium of RA and control rats using qRT-PCR. (E) The mRNA expression of MYL1 in the synovium of RA and control rats using qRT-PCR. (F) Western blot analysis of MYL1 protein expression with GAPDH as loading control. (G) Quantification of MYL1 protein levels normalized to GAPDH. *p < 0.05; **p < 0.01; *** p < 0.001. Abbreviations: CIA, collagen‑induced arthritis; RA, rheumatoid arthritis. |
Related Genes of MYL1 in RA
After the identification of DEGs, the expression matrix of MYL1 was analyzed by Spearman correlation, and its related genes were demonstrated by a heatmap (Figure 6A). And a visual bubble map was generated to show the correlation between DEGs associated with MYL1 (Figure 6B).
 |
Figure 6 Differential analysis of MYL1 gene groupings. (A) The MYL1 differential analysis heatmap; (B) The MYL1 differential analysis correlation graph. |
RA Is Associated with Multiple Functional States of Synovial Cells and Disease Pathways
According to the results of GO analysis, the DEGs were mainly enriched in muscle-related biological processes, and these pathways were closely related to functions such as key roles in muscle structure and function, particularly in the muscle structure development, muscle contraction, the organization of muscle fibers, and the assembly of RA-associated cellular components (Figure 7A–D). The KEGG assessment indicated that the RA group was enriched in various pathways linked to muscle and heart conditions, including those related to calcium signaling, motor protein signaling, myocardial contraction, and adrenergic signaling within cardiomyocytes (Figure 8A–D).
 |
Figure 7 GO analysis. (A) The GO analysis bar plot. (B) The GO analysis bubble plot. (C) The GO analysis chord chart. (D) The GO analysis circle plot. Abbreviation: GO, Gene Ontology. |
 |
Figure 8 KEGG analysis. (A) The KEGG analysis bar plot. (B) The KEGG analysis bubble plot. (C) The KEGG analysis chord chart. (D) The KEGG analysis circle plot. Abbreviation: KEGG, Kyoto encyclopedia of genes and genomes. |
Gene Set Enrichment Analysis
Utilizing GSEA analysis to explore individual genes linked to MYL1 offered further insights into how MYL1 can differentiate RA samples from controls, highlighting the pathways regulated by MYL1. Through a comprehensive examination, it was discovered that the group with elevated expression levels predominantly displayed enrichment in five biological signaling pathways. These included pathways related to antigen processing and presentation, chemokine signaling, and lysosomal functions (Figure 9A). Conversely, the group exhibiting lower expression levels demonstrated a significant concentration in five activities and pathways linked to muscle operation and heart issues, such as the calcium signaling pathway and myocardial contraction processes (Figure 9B).
 |
Figure 9 Gene set enrichment analysis. (A) Functional enrichment analysis of GSEA in the high-MYL1 expression group. (B) Functional enrichment analysis of GSEA in the low-MYL1 expression group. Abbreviation: GSEA, Gene set enrichment analysis. |
MYL1 Is Associated with Immune Cells and Their Functions in RA
Using the CIBERSORT algorithm, we analyzed the differences in peripheral blood immune cells between the RA and the control groups. The proportional stacked bar graph (Figure 10A) shows the proportional expression of 22 immune cell types across all samples. The first 43 cases were in the control group, and the last 93 cases were in the RA group. The expression levels of nine immune cell markers exhibited notable variations (Figure 10B and C). Specifically, in the RA group, there was an elevation in Macrophages M0 and M1, activated CD4 memory T cells, follicular helper T cells, and gamma delta T cells. Conversely, activated NK cells, resting CD4 memory T cells, CD8 T cells, and regulatory T cells (Tregs) were found to be lower in RA patients compared to the control group. Subsequently, we conducted an analysis to examine the correlation between MYL1 expression and various immune cell types. The heatmap, box plot, and lollipop plot visualizations (Figure 11A–C) illustrate that MYL1 showed a positive correlation with Tregs, activated NK cells, plasma cells, and naïve CD4 T cells, while demonstrating a negative correlation with M2 macrophages (Figure 11D).
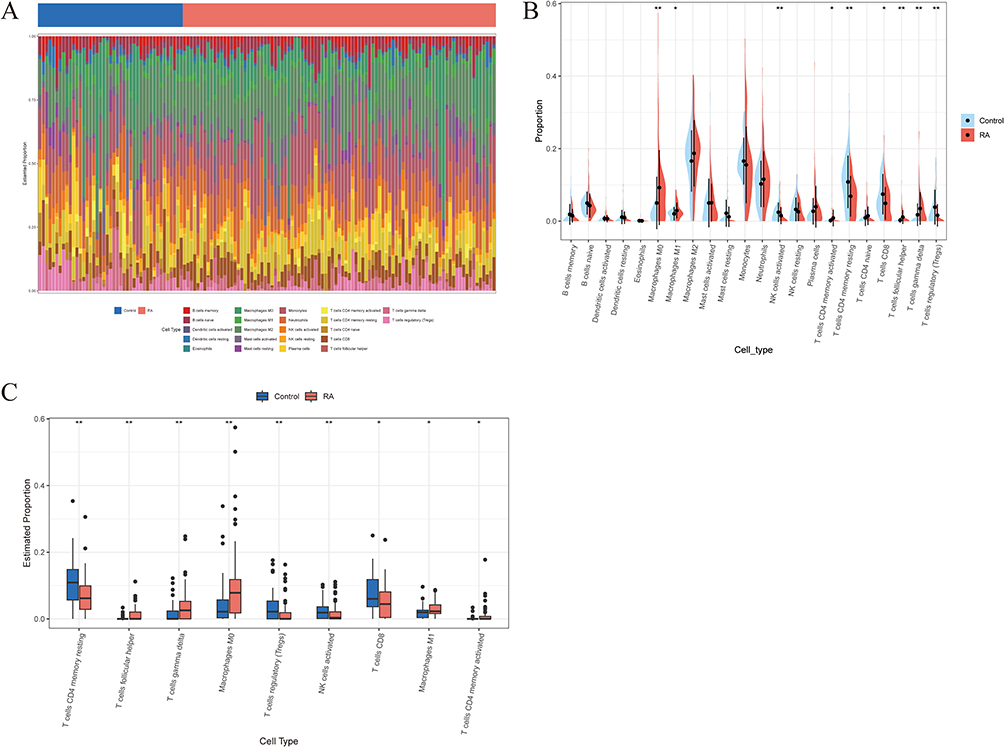 |
Figure 10 Immune cell infiltration analysis. (A) A proportional stacked bar chart showing the distribution of immune cells in the control and RA groups. (B) The split violin plot shows the differences in immune cell distribution between the control group and the RA group. (C) The immune abundance box plot shows the differential distribution of immune cell abundance for immune cells with significant differences between the control and RA groups. *p < 0.05; ** p < 0.01. Abbreviation: RA, Rheumatoid arthritis. |
 |
Figure 11 Immune correlation analysis. (A) Heatmap of the correlation between MYL1 and 22 immune cell types. (B) Box plot of the correlation between MYL1 and 22 immune cells. (C) Lollipop plot of correlation analysis between MYL1 and 22 immune cells, the red boxes indicate the immune cell types with statistically significant correlations in the Spearman correlation tests. (D) The expression level of MYL1 showed a positive correlation with T cells regulatory (Tregs), NK cells activated, Plasma cells, T cells CD4 naive, but a negative correlation with Macrophages M2. (p<0.05). *p < 0.05; ** p < 0.01. |
ceRNA Network
As illustrated in Figure 12, the resulting network consists of 118 nodes, including 1 signature mRNA (MYL1), 22 miRNAs (eg, hsa-miR-4455, hsa-miR-3919, hsa-miR-4513), and 92 lncRNAs (such as HAGLR, SNHG16, and NEFL). The network comprises a total of 130 edges, representing both miRNA–mRNA and lncRNA–miRNA interactions. It was shown that MYL1 regulates the expression of itself and other molecules through a complex ceRNA network and may play an important role in the pathogenesis of RA.
 |
Figure 12 A ceRNA networks of MYL1 and the potential RNA regulatory pathways. Abbreviation: ceRNA, competitive endogenous RNA. |
Discussion
In this study, through the rigorous screening of two machine learning methods and inflammatory processes, we identified 34 DEGs significantly associated with RA. Although MYL1 did not exhibit the highest fold change among all differentially expressed genes, its biological significance in the context of RA should not be underestimated. Muscle weakness and atrophy are common features of RA,17,18 and even modest alterations in genes regulating muscle function, such as MYL1, could have a meaningful physiological impact in RA patients. In addition, the expression changes of MYL1 were verified by constructing a rat RA model, which further supported the potential role of MYL1 in RA.
Notably, the expression of MYL1 is upregulated in several tumors (rhabdomyosarcoma, head and neck squamous cell carcinoma, breast cancer, and prostate cancer).24–26,44 Furthermore, MYL1 plays an important role in several musculoskeletal diseases.27,45,46 These studies suggest that MYL1 may be broadly involved in pathological processes beyond muscle disease and reinforce its potential value as a disease-related biomarker. This investigation identified novel molecular targets for detection through an analysis of immune infiltration, discovering that MYL1 is linked to modified immune activity. This aligns with earlier research suggesting a strong connection between RA progression and immune function.3
Based on the results of the GO analysis, we discovered that MYL1 mainly participates in organizing sarcomeres, facilitating muscle contraction, and assembling RA-associated cellular components. This finding is in line with that of a prior study, which reported that one of the clinical manifestations of RA is muscle weakness and atrophy.17,18 Alterations in muscle function may exacerbate the clinical symptoms of RA by affecting the structure and function of muscle tissue, especially impairments in motor function and quality of life. Over a period of five years, a study involving 288 individuals diagnosed with RA found that although disease activity and physical capabilities improved, low muscle mass persisted unchanged. This indicates that muscle depletion in those with RA could independently worsen functional impairment, regardless of inflammation levels.47 This was further confirmed by the KEGG analysis, which showed that the RA group was significantly enriched in calcium signaling pathways, motor protein signaling pathways, cardiac contraction signaling pathways, and other pathways in muscle and some heart diseases. These results suggest that RA not only affects the degeneration of articular cartilage, but may also lead to muscle weakness and other cardiac-related complications in patients by affecting muscle and cardiac function, which also coincides with the results of previous studies.48–54 An important association exists between RA and both heart failure and impaired myocardial function. Studies have demonstrated that in RA, decreased expression of the transcriptional repressor IKAROS in CD4 T cells results in upregulation of ORAI3, thereby activating calcium-selective (ARC) channels. This process enhances the sensitivity of T cells to inflammatory stimuli, and aberrant T-cell activation is considered a key contributor to the development of chronic inflammation in RA.55 Other studies have demonstrated enhanced calcium signaling in synovial fibroblasts in RA, with translocation of nuclear factor c3 (NFATc3) from activated T cells to the nucleus, resulting in increased expression of the inflammatory factor RANTES, which ultimately leads to an enhanced synovial inflammatory response in RA.56 In addition, enhanced calcium signaling is involved in the anti-apoptotic process of synovial fibroblasts in RA.57 Furthermore, Liang et al comprehensively reviewed the critical role of calcium signaling pathways in the pathogenesis of RA.58 Downregulation of MYL1 in RA is associated with weakened immunosuppressive effects. This may involve the calcium signaling pathway and macrophage polarization.
This study examined immune cell infiltration to explore potential immunological associations of MYL1 expression in rheumatoid arthritis (RA). The results suggest that MYL1 expression is correlated with altered immune cell proportions, rather than directly demonstrating an immunoregulatory function. This correlation supports previous evidence that immune dysregulation is closely involved in RA progression,59–61 and Alivernini suggested that T cells may play a role in early RA.62 In contrast, elevated macrophage levels in the RA group indicate an ongoing inflammatory response within the synovium,63–65 and it has been demonstrated that suppressing the activation of inflammatory vesicles in macrophages can effectively reduce RA-related tissue damage.66 The reduction of NK cells activated and Tregs implies a weakening of the immune-suppressing function of RA, which further amplifies the autoimmune response and inflammatory environment. Recent research indicates a strong association between lower NK cell counts and heightened RA symptoms.67 Moreover, Treg cells have gained attention as a potential therapeutic focus for RA treatment.68 In RA patients, an almost complete lack of GPSM2 in Treg cells impairs their migration to inflammatory sites.69 Furthermore, enhancing the Treg/Th17 ratio by increasing Treg cell proportions can markedly improve the course of RA.70
In this research, the analysis of immune cell associations revealed a strong positive correlation between T regulatory cells (Tregs) and activated natural killer (NK) cells with MYL1. Additionally, M1 macrophages and follicular helper T cells also exhibited a significant correlation with MYL1. Down-regulation of MYL1 may lead to a decrease in immunosuppressive cells (Tregs and NK cells activated) and an expansion of pro-inflammatory macrophages (M1 macrophages) and T follicular helper cells. Downregulation of MYL1 may lead to a decrease in immunosuppressive cells (Tregs and NK cells activated) and an expansion of pro-inflammatory macrophages (M1 macrophages) and T follicular helper cells. Previous studies have demonstrated that FABP4 secreted by M1-polarized macrophages promotes synovitis, angiogenesis, and cartilage degeneration, exacerbating the progression of RA.71 Secondly, a significant expansion of T follicular helper cells was found in early RA synovial tissues.72 Follicular helper T cells facilitate the differentiation of plasma cells by releasing IL-21, moving towards the inflammation site under the influence of chemokines, and enhancing B-cell activity and antibody generation in non-lymphoid tissues experiencing pathological inflammation.73 One of the pathological features of RA is long-term chronic synovial inflammation and dysregulation of autoimmunity, and this present study, along with related studies, demonstrated that dysregulation of Tregs, NK cells activated, M1-type macrophages, and T cells follicular helper correlates with disease progression and severity.
Currently, there is a scarcity of research focused on how MYL1 influences the functions of immune cells. Nonetheless, MYL1 encodes myosin light chain, a structural component of the cytoskeleton that contributes to cellular contractility and signal transduction. Increasing evidence indicates that myosin light‑chain signaling plays crucial roles in immune modulation. For example, inhibition of myosin light‑chain kinase (MLCK) has been shown to attenuate inflammatory responses and reduce cytokine release.74,75 Moreover, MLCK activity regulates T‑cell motility and polarization,76 as well as neutrophil‑mediated inflammatory injury.77 In rheumatoid arthritis, the HIF‑1α‑RhoA/ROCK axis, which converges on myosin light‑chain phosphorylation, promotes fibroblast‑like synoviocyte migration and joint inflammation.78 Therefore, dysregulation of MYL1 expression might influence cytoskeletal remodeling and immune‑cell activity, providing a possible mechanism by which MYL1 contributes to RA pathogenesis. In addition, investigations have revealed that MYL9, another member of the myosin light chain family, can act as a ligand for CD69.79 The interaction facilitated by MYL9 between cancer-associated fibroblasts (CAFs) and immune cells plays a role not only in the development of tumors and the evasion of the immune system but also in controlling the movement and activities of various immune cells, including T cells, macrophages, and NK cells, within tissues.80 Moreover, in colorectal cancer, high MYL9 expression is associated with poor response to immunotherapy.81 Although there have been no direct reports on the expression or specific functions of MYL1 in immune cells, considering its structural and functional homology with MYL9, its role in muscle cytoskeletal regulation, and our findings that MYL1 expression changes are closely associated with immune infiltration and abnormal immune cell proportions in RA, it is plausible that MYL1 might potentially contribute to the regulation of immune cell cytoskeletal remodeling and migration through analogous to those of MYL9. However, this assumption requires further experimental validation to confirm whether MYL1 indeed plays such a role in RA.
We developed a ceRNA network focused on MYL1, where lncRNAs can rival mRNAs for miRNA binding sites, influencing MYL1 expression. Discovering miRNAs that directly engage with mRNA and lncRNAs that indirectly affect mRNA levels offers novel avenues for RA prevention or therapy.
The research existed several limitations. To begin with, the human data were sourced from the GEO database, concentrating on cartilage samples from individuals with RA and those without the condition. Nonetheless, the sample size was somewhat limited, and the absence of a predefined chronological framework for data integration may introduce additional heterogeneity. Additionally, our findings were corroborated using a rat model of RA, but have not yet been confirmed in RA patients. Consequently, further clinical research is essential to validate the roles of MYL1 in the diagnosis and treatment of RA. Future comparative clinical investigations are necessary to substantiate these results. Third, although we employed cross-validation and multiple algorithms to enhance robustness, machine learning approaches inherently risk overfitting, particularly with limited sample sizes. Moreover, CIBERSORT-based estimates are limited by dependence on the reference signature, model assumptions. And ceRNA links are computational and hypothesis‑generating, causal inference awaits reporter, AGO2‑RIP/pull‑down, and perturbation/rescue validation in RA‑relevant models. Finally, while we established an association between MYL1 and RA, the pathophysiological mechanisms underlying the role of MYL1 in RA remain incompletely understood. Further research is needed to elucidate the molecular and signaling mechanisms of MYL1 in RA.
The identification of MYL1 as a candidate biomarker could augment early diagnosis of RA, enable patient stratification, and facilitate treatment monitoring in conjunction with existing markers. Progress toward clinical application will require stepwise analytical and clinical validation, assay standardization, and deliberate integration into diagnostic pathways. Priority directions are to validate performance across multicenter blood and synovial cohorts and establishing clinically actionable cut‑offs linked to disease activity, joint damage progression, and therapeutic response. In parallel, a deployable ELISA should be developed, and the incremental value of MYL1 beyond RF, anti‑CCP, ESR, and CRP should be quantified using head‑to‑head comparisons together with reclassification and decision‑curve analyses. Longitudinal cohorts are needed to assess prognostic utility and the prediction of treatment response. Single‑cell and spatial profiling can localize the cellular sources of MYL1‑related signals. Finally, perturbation studies in fibroblast‑like synoviocytes, immune cells, and in vivo models should interrogate links to calcium signaling, cytoskeletal dynamics, and cytokine networks.
In conclusion, this study identifies a significant downregulation of MYL1 in RA, which is closely associated with key immune cell subsets, suggesting it may play an important role in RA pathogenesis and warrants further investigation as a potential future diagnostic marker.
Ethics Approval and Consent to Participate
The study was conducted with the approval of the Clinical Research Ethics Committee and Animal Research Ethics Committee of Guangxi Medical University (Approved Number: 202208035) and performed in accordance with the national ethical guidelines for the care and use of laboratory animals in China and the university’s animal welfare regulations.
Acknowledgments
This research received support from the National Natural Science Foundation of China (82360429 and 82060406), the Guangxi Natural Science Foundation (2025JJA140126 and 2022JJA141126), the Advanced Innovation Team and Xinghu Scholar Program of Guangxi Medical University, the China Postdoctoral Science Foundation (2019M650235), and the Key Research and Development Program Project of Qingxiu District, Nanning, Guangxi (2021003).
Author Contributions
Yan Chen is the corresponding author of this article and has made significant contributions. All authors have participated in conceptualizing the topic, designing the experimental study, implementing, and analyzing data. They have also been involved in acquiring and interpreting graphs and figures, drafting, revising, and critically reviewing the article. Furthermore, all authors have given their final approval for the version to be published, agreed to the journal for submission, and have accepted responsibility for all aspects of the work.
Disclosure
The authors declare that they have no competing interests.
References
1. Finckh A, Gilbert B, Hodkinson B, et al. Global epidemiology of rheumatoid arthritis. Nat Rev Rheumatol. 2022;18(10):591–602. doi:10.1038/s41584-022-00827-y
2. Black RJ, Cross M, Haile LM, et al. Global, regional, and national burden of rheumatoid arthritis, 1990–2020, and projections to 2050: a systematic analysis of the global burden of disease study 2021. Lancet Rheumatol. 2023;5(10):e594–e610. doi:10.1016/s2665-9913(23)00211-4
3. Smith MH, Berman JR. What is rheumatoid arthritis? JAMA. 2022;327(12):1194. doi:10.1001/jama.2022.0786
4. Smolen JS, Aletaha D, Barton A, et al. Rheumatoid arthritis. Nat Rev Dis Primers. 2018;4(1). doi:10.1038/nrdp.2018.1
5. Deane KD, Demoruelle MK, Kelmenson LB, Kuhn KA, Norris JM, Holers VM. Genetic and environmental risk factors for rheumatoid arthritis. Best Pract Res Clin Rheumatol. 2017;31(1):3–18. doi:10.1016/j.berh.2017.08.003
6. Venetsanopoulou AI, Alamanos Y, Voulgari PV, Drosos AA. Epidemiology of rheumatoid arthritis: genetic and environmental influences. Expert Rev Clin Immunol. 2022;18(9):923–931. doi:10.1080/1744666X.2022.2106970
7. Firestein GS, McInnes IB. Immunopathogenesis of Rheumatoid Arthritis. Immunity. 2017;46(2):183–196. doi:10.1016/j.immuni.2017.02.006
8. Sorokin AV, Mehta NN. The relationship between TNF-alpha driven inflammation, lipids, and endothelial function in rheumatoid arthritis: a complex puzzle continues. Cardiovasc Res. 2022;118(1):10–12. doi:10.1093/cvr/cvab190
9. Schiff MH. Role of interleukin 1 and interleukin 1 receptor antagonist in the mediation of rheumatoid arthritis. Ann Rheum Dis. 2000;59(Suppl 1):i103–8. doi:10.1136/ard.59.suppl_1.i103
10. Kirkham B. Interleukin-1, immune activation pathways, and different mechanisms in osteoarthritis and rheumatoid arthritis. Ann Rheum Dis. 1991;50(6):395–400. doi:10.1136/ard.50.6.395
11. Marinou I, Walters K, Dickson MC, Binks MH, Bax DE, Wilson AG. Evidence of epistasis between interleukin 1 and selenoprotein-S with susceptibility to rheumatoid arthritis. Ann Rheum Dis. 2009;68(9):1494–1497. doi:10.1136/ard.2008.090001
12. Md Yusof MY, Emery P. Targeting interleukin-6 in rheumatoid arthritis. Drugs. 2013;73(4):341–356. doi:10.1007/s40265-013-0018-2
13. Boyapati A, Schwartzman S, Msihid J, et al. Association of high serum interleukin-6 levels with severe progression of rheumatoid arthritis and increased treatment response differentiating sarilumab from adalimumab or methotrexate in a post hoc analysis. Arthritis Rheumatol. 2020;72(9):1456–1466. doi:10.1002/art.41299
14. Yokota K, Sato K, Miyazaki T, et al. Characterization and function of tumor necrosis factor and interleukin-6-induced osteoclasts in rheumatoid arthritis. Arthritis Rheumatol. 2021;73(7):1145–1154. doi:10.1002/art.41666
15. Paleolog EM. The vasculature in rheumatoid arthritis: cause or consequence? Int J Exp Pathol. 2009;90(3):249–261. doi:10.1111/j.1365-2613.2009.00640.x
16. Colville-Nash PR, Scott DL. Angiogenesis and rheumatoid arthritis: pathogenic and therapeutic implications. Ann Rheum Dis. 1992;51(7):919–925. doi:10.1136/ard.51.7.919
17. Yamada T, Fedotovskaya O, Cheng AJ, et al. Nitrosative modifications of the Ca2+ release complex and actin underlie arthritis-induced muscle weakness. Ann Rheum Dis. 2015;74(10):1907–1914. doi:10.1136/annrheumdis-2013-205007
18. Yamada T, Steinz MM, Kenne E, Lanner JT. Muscle weakness in rheumatoid arthritis: the role of Ca(2+) and free radical signaling. EBioMedicine. 2017;23:12–19. doi:10.1016/j.ebiom.2017.07.023
19. Gregorich ZR, Cai W, Lin Z, et al. Distinct sequences and post-translational modifications in cardiac atrial and ventricular myosin light chains revealed by top-down mass spectrometry. J Mol Cell Cardiol. 2017;107:13–21. doi:10.1016/j.yjmcc.2017.04.002
20. Bartok B, Firestein GS. Fibroblast-like synoviocytes: key effector cells in rheumatoid arthritis. Immunol Rev. 2010;233(1):233–255. doi:10.1111/j.0105-2896.2009.00859.x
21. Macian F. NFAT proteins: key regulators of T-cell development and function. Nat Rev Immunol. 2005;5(6):472–484. doi:10.1038/nri1632
22. Benatti FB, Pedersen BK. Exercise as an anti-inflammatory therapy for rheumatic diseases-myokine regulation. Nat Rev Rheumatol. 2015;11(2):86–97. doi:10.1038/nrrheum.2014.193
23. Nygaard G, Firestein GS. Restoring synovial homeostasis in rheumatoid arthritis by targeting fibroblast-like synoviocytes. Nat Rev Rheumatol. 2020;16(6):316–333. doi:10.1038/s41584-020-0413-5
24. Chen Z, Li XY, Guo P, Wang DL. MYBPC2 and MYL1 as significant gene markers for rhabdomyosarcoma. Technol Cancer Res Treat. 2021;20:1533033820979669. doi:10.1177/1533033820979669
25. Li C, Guan R, Li W, et al. Analysis of myosin genes in HNSCC and identify MYL1 as a specific poor prognostic biomarker, promotes tumor metastasis and correlates with tumor immune infiltration in HNSCC. BMC Cancer. 2023;23(1):840. doi:10.1186/s12885-023-11349-5
26. Das SC, Tasnim W, Rana HK, Acharjee UK, Islam MM, Khatun R. Comprehensive bioinformatics and machine learning analyses for breast cancer staging using TCGA dataset. Brief Bioinform. 2024;26(1). doi:10.1093/bib/bbae628
27. Ravenscroft G, Zaharieva IT, Bortolotti CA, et al. Bi-allelic mutations in MYL1 cause a severe congenital myopathy. Hum Mol Genet. 2018;27(24):4263–4272. doi:10.1093/hmg/ddy320
28. Baker JF, Mostoufi-Moab S, Long J, Taratuta E, Leonard MB, Zemel B. Association of low muscle density with deteriorations in muscle strength and physical functioning in rheumatoid arthritis. Arthritis Care Res. 2021;73(3):355–363. doi:10.1002/acr.24126
29. Bennett JL, Pratt AG, Dodds R, Sayer AA, Isaacs JD. Rheumatoid sarcopenia: loss of skeletal muscle strength and mass in rheumatoid arthritis. Nat Rev Rheumatol. 2023;19(4):239–251. doi:10.1038/s41584-023-00921-9
30. Kramer HR, Fontaine KR, Bathon JM, Giles JT. Muscle density in rheumatoid arthritis: associations with disease features and functional outcomes. Arthritis Rheum. 2012;64(8):2438–2450. doi:10.1002/art.34464
31. Chen YP, Liang RY, Zheng XF, Fang DL, Lu WW, Chen Y. Identification of ZNF652 as a diagnostic and therapeutic target in osteoarthritis using machine learning. J Inflamm Res. 2024;17:10141–10161. doi:10.2147/Jir.S488841
32. Hu J, Szymczak S. A review on longitudinal data analysis with random forest. Brief Bioinform. 2023;24(2). doi:10.1093/bib/bbad002
33. Chen B, Khodadoust MS, Liu CL, Newman AM, Alizadeh AA. Profiling tumor infiltrating immune cells with CIBERSORT. Methods Mol Biol. 2018;1711:243–259. doi:10.1007/978-1-4939-7493-1_12
34. Friedman RC, Farh KK, Burge CB, Bartel DP. Most mammalian mRNAs are conserved targets of microRNAs. Genome Res. 2009;19(1):92–105. doi:10.1101/gr.082701.108
35. Agarwal V, Bell GW, Nam JW, Bartel DP. Predicting effective microRNA target sites in mammalian mRNAs. Elife. 2015;4. doi:10.7554/eLife.05005
36. John B, Enright AJ, Aravin A, Tuschl T, Sander C, Marks DS. Human MicroRNA targets. PLoS Biol. 2004;2(11):e363. doi:10.1371/journal.pbio.0020363
37. Chen Y, Wang X. miRDB: an online database for prediction of functional microRNA targets. Nucleic Acids Res. 2020;48(D1):D127–D131. doi:10.1093/nar/gkz757
38. Furio-Tari P, Tarazona S, Gabaldon T, Enright AJ, Conesa A. spongeScan: a web for detecting microRNA binding elements in lncRNA sequences. Nucleic Acids Res. 2016;44(W1):W176–80. doi:10.1093/nar/gkw443
39. Shannon P, Markiel A, Ozier O, et al. Cytoscape: a software environment for integrated models of biomolecular interaction networks. Genome Res. 2003;13(11):2498–2504. doi:10.1101/gr.1239303
40. Nan Y, Chen M, Wu W, et al. IGF2BP2 regulates the inflammation of fibroblast-like synoviocytes via GSTM5 in rheumatoid arthritis. Cell Death Discov. 2024;10(1):215. doi:10.1038/s41420-024-01988-3
41. Yau AC, Holmdahl R. Rheumatoid arthritis: identifying and characterising polymorphisms using rat models. Dis Model Mech. 2016;9(10):1111–1123. doi:10.1242/dmm.026435
42. Wu J, Feng Z, Chen L, et al. TNF antagonist sensitizes synovial fibroblasts to ferroptotic cell death in collagen-induced arthritis mouse models. Nat Commun. 2022;13(1):676. doi:10.1038/s41467-021-27948-4
43. Huang X, Liu J, Wu X, et al. Remote continuous microinjury-triggered cytokines facilitate severe diabetic foot ulcer healing via the Ras/Raf/MEK/ERK pathway. J Inflamm Res. 2025;18:1755–1772. doi:10.2147/jir.S493505
44. Sun J, Li S, Wang F, Fan C, Wang J. Identification of key pathways and genes in PTEN mutation prostate cancer by bioinformatics analysis. BMC Med Genet. 2019;20(1):191. doi:10.1186/s12881-019-0923-7
45. Lin Z, Lin Y. Identification of potential crucial genes associated with steroid-induced necrosis of femoral head based on gene expression profile. Gene. 2017;627:322–326. doi:10.1016/j.gene.2017.05.026
46. Granger B, Gueneau L, Drouin-Garraud V, et al. Modifier locus of the skeletal muscle involvement in Emery-Dreifuss muscular dystrophy. Hum Genet. 2011;129(2):149–159. doi:10.1007/s00439-010-0909-1
47. Pan J, Zou YW, Ouyang ZM, et al. POS0471 continuously low muscle mass contributes to worse physical function in rheumatoid arthritis patients: a 5-year follow-up study. Ann Rheumatic Dis. 2024;83:834–835. doi:10.1136/annrheumdis-2024-eular.4818
48. Kadier K, Dilixiati D, Zhang X, et al. Rheumatoid arthritis increases the risk of heart failure: results from the cross-sectional study in the US population and mendelian randomization analysis in the European population. Front Immunol. 2024;15:1377432. doi:10.3389/fimmu.2024.1377432
49. Lazurova I, Tomas L. Cardiac impairment in rheumatoid arthritis and influence of anti-TNFalpha treatment. Clin Rev Allergy Immunol. 2017;52(3):323–332. doi:10.1007/s12016-016-8566-3
50. Wang M, Mei K, Chao C, et al. Rheumatoid arthritis increases the risk of heart failure-current evidence from genome-wide association studies. Front Endocrinol. 2023;14:1154271. doi:10.3389/fendo.2023.1154271
51. Giles JT, Fernandes V, Lima JA, Bathon JM. Myocardial dysfunction in rheumatoid arthritis: epidemiology and pathogenesis. Arthritis Res Ther. 2005;7(5):195–207. doi:10.1186/ar1814
52. Pironti G, Bersellini-Farinotti A, Agalave NM, et al. Cardiomyopathy, oxidative stress and impaired contractility in a rheumatoid arthritis mouse model. Heart. 2018;104(24):2026–2034. doi:10.1136/heartjnl-2018-312979
53. England BR, Thiele GM, Anderson DR, Mikuls TR. Increased cardiovascular risk in rheumatoid arthritis: mechanisms and implications. BMJ. 2018;361:k1036. doi:10.1136/bmj.k1036
54. Figus FA, Piga M, Azzolin I, McConnell R, Iagnocco A. Rheumatoid arthritis: extra-articular manifestations and comorbidities. Autoimmun Rev. 2021;20(4):102776. doi:10.1016/j.autrev.2021.102776
55. Ye Z, Shen Y, Jin K, et al. Arachidonic acid-regulated calcium signaling in T cells from patients with rheumatoid arthritis promotes synovial inflammation. Nat Commun. 2021;12(1):907. doi:10.1038/s41467-021-21242-z
56. Zhang Y, Qian X, Yang X, et al. ASIC1a induces synovial inflammation via the Ca(2+)/NFATc3/ RANTES pathway. Theranostics. 2020;10(1):247–264. doi:10.7150/thno.37200
57. Janczi T, Bohm BB, Fehrl Y, DeGiacomo P, Kinne RW, Burkhardt H. ADAM15 in apoptosis resistance of synovial fibroblasts: converting Fas/CD95 death signals into the activation of prosurvival pathways by calmodulin recruitment. Arthritis Rheumatol. 2019;71(1):63–72. doi:10.1002/art.40667
58. Liang HY, Yin HX, Li SF, et al. Calcium-permeable channels cooperation for rheumatoid arthritis: therapeutic opportunities. Biomolecules. 2022;12(10). doi:10.3390/biom12101383
59. Schonland SO, Lopez C, Widmann T, et al. Premature telomeric loss in rheumatoid arthritis is genetically determined and involves both myeloid and lymphoid cell lineages. Proc Natl Acad Sci U S A. 2003;100(23):13471–13476. doi:10.1073/pnas.2233561100
60. Sakaguchi N, Takahashi T, Hata H, et al. Altered thymic T-cell selection due to a mutation of the ZAP-70 gene causes autoimmune arthritis in mice. Nature. 2003;426(6965):454–460. doi:10.1038/nature02119
61. Ishigaki K, Lagattuta KA, Luo Y, James EA, Buckner JH, Raychaudhuri S. HLA autoimmune risk alleles restrict the hypervariable region of T cell receptors. Nat Genet. 2022;54(4):393–402. doi:10.1038/s41588-022-01032-z
62. Alivernini S, Firestein GS, McInnes IB. The pathogenesis of rheumatoid arthritis. Immunity. 2022;55(12):2255–2270. doi:10.1016/j.immuni.2022.11.009
63. Zheng Y, Wei K, Jiang P, et al. Macrophage polarization in rheumatoid arthritis: signaling pathways, metabolic reprogramming, and crosstalk with synovial fibroblasts. Front Immunol. 2024;15:1394108. doi:10.3389/fimmu.2024.1394108
64. Weyand CM, Zeisbrich M, Goronzy JJ. Metabolic signatures of T-cells and macrophages in rheumatoid arthritis. Curr Opin Immunol. 2017;46:112–120. doi:10.1016/j.coi.2017.04.010
65. Yang X, Chang Y, Wei W. Emerging role of targeting macrophages in rheumatoid arthritis: focus on polarization, metabolism and apoptosis. Cell Prolif. 2020;53(7):e12854. doi:10.1111/cpr.12854
66. Cao F, Huang C, Cheng J, He Z. beta-arrestin-2 alleviates rheumatoid arthritis injury by suppressing NLRP3 inflammasome activation and NF- kappaB pathway in macrophages. Bioengineered. 2022;13(1):38–47. doi:10.1080/21655979.2021.2003678
67. Kim HR, Lee H, Kim TH, Gil M, Kim DW. Natural killer cell activity and its relationship with disease activity in rheumatoid arthritis patients. Hum Immunol. 2025;86(1):111185. doi:10.1016/j.humimm.2024.111185
68. Esensten JH, Wofsy D, Bluestone JA. Regulatory T cells as therapeutic targets in rheumatoid arthritis. Nat Rev Rheumatol. 2009;5(10):560–565. doi:10.1038/nrrheum.2009.183
69. Kotschenreuther K, Yan S, Kofler DM. Migration and homeostasis of regulatory T cells in rheumatoid arthritis. Front Immunol. 2022;13:947636. doi:10.3389/fimmu.2022.947636
70. Jin S, Chen H, Li Y, et al. Maresin 1 improves the Treg/Th17 imbalance in rheumatoid arthritis through miR-21. Ann Rheum Dis. 2018;77(11):1644–1652. doi:10.1136/annrheumdis-2018-213511
71. Guo D, Lin C, Lu Y, et al. FABP4 secreted by M1-polarized macrophages promotes synovitis and angiogenesis to exacerbate rheumatoid arthritis. Bone Res. 2022;10(1):45. doi:10.1038/s41413-022-00211-2
72. Murray-Brown W, Guo Y, Small A, et al. Differential expansion of T peripheral helper cells in early rheumatoid arthritis and osteoarthritis synovium. RMD Open. 2022;8(2). doi:10.1136/rmdopen-2022-002563
73. Rao DA, Gurish MF, Marshall JL, et al. Pathologically expanded peripheral T helper cell subset drives B cells in rheumatoid arthritis. Nature. 2017;542(7639):110–114. doi:10.1038/nature20810
74. Chen J, Chen J, Tan J, et al. HIF-1α dependent RhoA as a novel therapeutic target to regulate rheumatoid arthritis fibroblast-like synoviocytes migration in vitro and in vivo. J Orthopaed Transl. 2023;40:49–57. doi:10.1016/j.jot.2023.05.004
75. Wang Y, Liu Y, Zhou W, Lin J, Wen L. Myosin light-chain kinase inhibitors attenuate nanoparticles-induced autophagy and cytotoxicity by suppression endocytosis. J Nanosci Nanotechnol. 2019;19(7):3792–3797. doi:10.1166/jnn.2019.16324
76. Song KH, Lee J, Jung H-R, Park H, Doh J. Turning behaviors of T cells climbing up ramp-like structures are regulated by myosin light chain kinase activity and lamellipodia formation. Sci Rep. 2017;7(1). doi:10.1038/s41598-017-11938-y
77. Beard RS Jr, Hoettels BA, McAllister JM, et al. Progression of experimental autoimmune encephalomyelitis in mice and neutrophil-mediated blood-brain barrier dysfunction requires non-muscle myosin light chain kinase. J Cereb Blood Flow Metab. 2025;45(6):1203–1220. doi:10.1177/0271678X251318620
78. Skrzypiec-Spring M, Kaczorowski M, Rak-Pasikowska A, et al. RhoA/ROCK pathway is upregulated in experimental autoimmune myocarditis and is inhibited by simvastatin at the stage of myosin light chain phosphorylation. Biomedicines. 2024;12(3). doi:10.3390/biomedicines12030596
79. Kimura MY, Koyama-Nasu R, Yagi R, Nakayama T. A new therapeutic target: the CD69-Myl9 system in immune responses. Semin Immunopathol. 2019;41(3):349–358. doi:10.1007/s00281-019-00734-7
80. Lv M, Luo L, Chen X. The landscape of prognostic and immunological role of myosin light chain 9 (MYL9) in human tumors. Immun Inflamm Dis. 2022;10(2):241–254. doi:10.1002/iid3.557
81. Deng S, Cheng D, Wang J, et al. MYL9 expressed in cancer-associated fibroblasts regulate the immune microenvironment of colorectal cancer and promotes tumor progression in an autocrine manner. J Exp Clin Cancer Res. 2023;42(1):294. doi:10.1186/s13046-023-02863-2
 © 2025 The Author(s). This work is published and licensed by Dove Medical Press Limited. The
full terms of this license are available at https://www.dovepress.com/terms
and incorporate the Creative Commons Attribution
- Non Commercial (unported, 4.0) License.
By accessing the work you hereby accept the Terms. Non-commercial uses of the work are permitted
without any further permission from Dove Medical Press Limited, provided the work is properly
attributed. For permission for commercial use of this work, please see paragraphs 4.2 and 5 of our Terms.
© 2025 The Author(s). This work is published and licensed by Dove Medical Press Limited. The
full terms of this license are available at https://www.dovepress.com/terms
and incorporate the Creative Commons Attribution
- Non Commercial (unported, 4.0) License.
By accessing the work you hereby accept the Terms. Non-commercial uses of the work are permitted
without any further permission from Dove Medical Press Limited, provided the work is properly
attributed. For permission for commercial use of this work, please see paragraphs 4.2 and 5 of our Terms.