Back to Journals » Diabetes, Metabolic Syndrome and Obesity » Volume 13
Down-Regulated miR-21 in Gestational Diabetes Mellitus Placenta Induces PPAR-α to Inhibit Cell Proliferation and Infiltration
Authors Guan CY, Tian S, Cao JL, Wang XQ, Ma X, Xia HF ![]()
Received 14 March 2020
Accepted for publication 7 July 2020
Published 24 August 2020 Volume 2020:13 Pages 3009—3034
DOI https://doi.org/10.2147/DMSO.S253920
Checked for plagiarism Yes
Review by Single anonymous peer review
Peer reviewer comments 3
Editor who approved publication: Professor Ming-Hui Zou
Chun-Yi Guan,1,2,* Shi Tian,3,* Jing-Li Cao,1,2 Xue-Qin Wang,1,2 Xu Ma,1,2 Hong-Fei Xia1,2
1Reproductive and Genetic Center of National Research Institute for Family Planning, Beijing 100081, People’s Republic of China; 2Graduate School, Peking Union Medical College, Beijing Province 100005, People’s Republic of China; 3Haidian Maternal & Child Health Hospital, Beijing 100080, People’s Republic of China
*These authors contributed equally to this work
Correspondence: Xu Ma; Hong-Fei Xia
Reproductive and Genetic Center of National Research Institute for Family Planning, Beijing 100081, People’s Republic of China
Tel +86-10-62178932
Fax +86-10-62179059
Email [email protected]; [email protected]
Purpose: This study aimed to investigate the role of miR-21 expression in the reduction of placental function in GDM patients.
Materials and Methods: qRT-PCR was used to detect the differential expression of miR-21 in the serum of gestational diabetes mellitus (GDM) and normal pregnant women, and to verify the functional target gene PPAR-α of miR-21 by double fluorescence experiments. Cellular experiments were performed to verify the effect of PPAR-α on cell function.
Results: miR-21 is down-regulated in the serum and placenta of GDM patients compared to normal pregnant women. In the case of insulin resistance, miR-21-5p knockdown promoted glucose uptake, but no significant effect was found under physiological condition. Functional studies have shown that reduced PPAR-α expression can restore miR-21 knockdown-mediated cell growth and metastasis inhibition. Additionally, decreased expression of miR-21 but increased expression of -PPAR-α was observed in patients with GDM and GDM rats.
Conclusion: The expression of the placental miR-21-5p, which inhibits cell growth and infiltration by up-regulating PPAR-α, is downregulated in pregnant GDM patients, which in turn may affect the placental function.
Keywords: gestational diabetes mellitus, miRNA-21, insulin resistance, PPAR-α
Introduction
Gestational diabetes mellitus (GDM) is one of the most common complications during pregnancy.1 Its prevalence is between 1% and 20%, and it has gradually increased globally; it is associated with the prevalence of obesity and type 2 diabetes.2 GDM not only increases the incidence of pregnancy-induced hypertension and preeclampsia but also increases the risk of neonatal hyperbilirubinemia, hypocalcemia, erythema, and respiratory distress syndrome.3–5 However, the screening and diagnosis of GDM lacks uniform standards, and the rate of missed diagnosis is high.4 Because of its complex etiology, it is closely related to genetic and environmental factors. There is no reliable biomarker that can be used to identify the occurrence or for the development of surveillance for GDM.
MicroRNAs (miRNAs) are small, non-coding RNAs of 21–23 nt in length and are considered to be the main regulators of gene expression and key controllers of biopathology.6 Recent studies have shown that miRNAs are involved in regulating β-cell development,7 insulin resistance,8 and insulin signaling pathways with altered glucose metabolism,9 and thus affecting the development of type 2 diabetes. Studies have shown that miR-21 as a molecular diagnostic marker can therapeutically regulate type 2 diabetes and pancreatic cancer.10 Zhong et al found that miR-21 plays a pathological role in fibrosis and can be used as a therapeutic target for diabetic nephropathy.11 It has been confirmed by literature that miR-21 is involved in the regulation of circulating immunity and modulates immunity by regulating inflammatory factors in the course of various cancers such as colon cancer.12 However, it is still unclear whether miR-21 is associated with GDM.
Peroxisome proliferator-activated receptors (PPARs) belong to the steroid hormone superfamily and have three subtypes, PPAR-α, PPAR-β/δ, and PPAR-γ, which are used in respiration as well as cholesterol and lipid metabolic enzymes.13 PPARs are essential for the growth and development of organisms. Previous studies have shown that mice with knocked out PPAR-γ cannot survive;14 disruption of Ppard and Pparg genes in mice can lead to placental dysfunction;15 detection results of PPARs in human embryos and trophoblast placental tissues showed that all three isoforms of PPARs are expressed;16 and PPAR-α plays an important role in placental development and angiogenesis.17
In this study, we investigated the effects of miR-21-mediated inhibition of PPAR-α on the placental trophoblast cell function and glucose metabolism in GDM patients and studied the underlying molecular mechanisms. The study may provide a new insight for the pathogenesis of GDM.
Materials and Methods
Specimen Collection
According to The International Association of the Diabetes and Pregnancy Study Groups (IADPSG) 2010 diagnostic criteria and standard glucose tolerance (OGTT), we collected placental samples from 137 GDM patients and 158 healthy pregnant women from Maternal and Child Health Hospital. The basic characteristics of the population are displayed in Table 1. Gestational diabetes was diagnosed at 24–28 weeks of pregnancy by a 75 g oral glucose tolerance test (OGTT). GDM patients were grouped into 6 groups according to the abnormal OGTT values in blood: 1st h; 2nd h; 0 h and 1st h; 0 h and 2nd h; 1st h and 2nd h; and 0 h, 1st h, and 2nd h. Meanwhile, the GDM placental tissues were grouped into four groups according to age: less than or equal to 25 years (≤25 Y), 26–30 years (26–30 Y), 31–35 years (31–35 Y), and equal to or over 36 years (≥36 Y). Positive diagnostic criteria were one or more plasma glucose values that met or exceeded the following values: fasting blood glucose levels >92 mg/dL, 1 h blood glucose levels >180 mg/dL, and 2 h blood glucose levels >153 mg/dL. The use of the samples has obtained the patient’s written informed consent, and obtained written review and approval from the Review Committee of the National Research Institute for Family Planning Commission of China. This study was conducted in accordance with the Declaration of Helsinki.
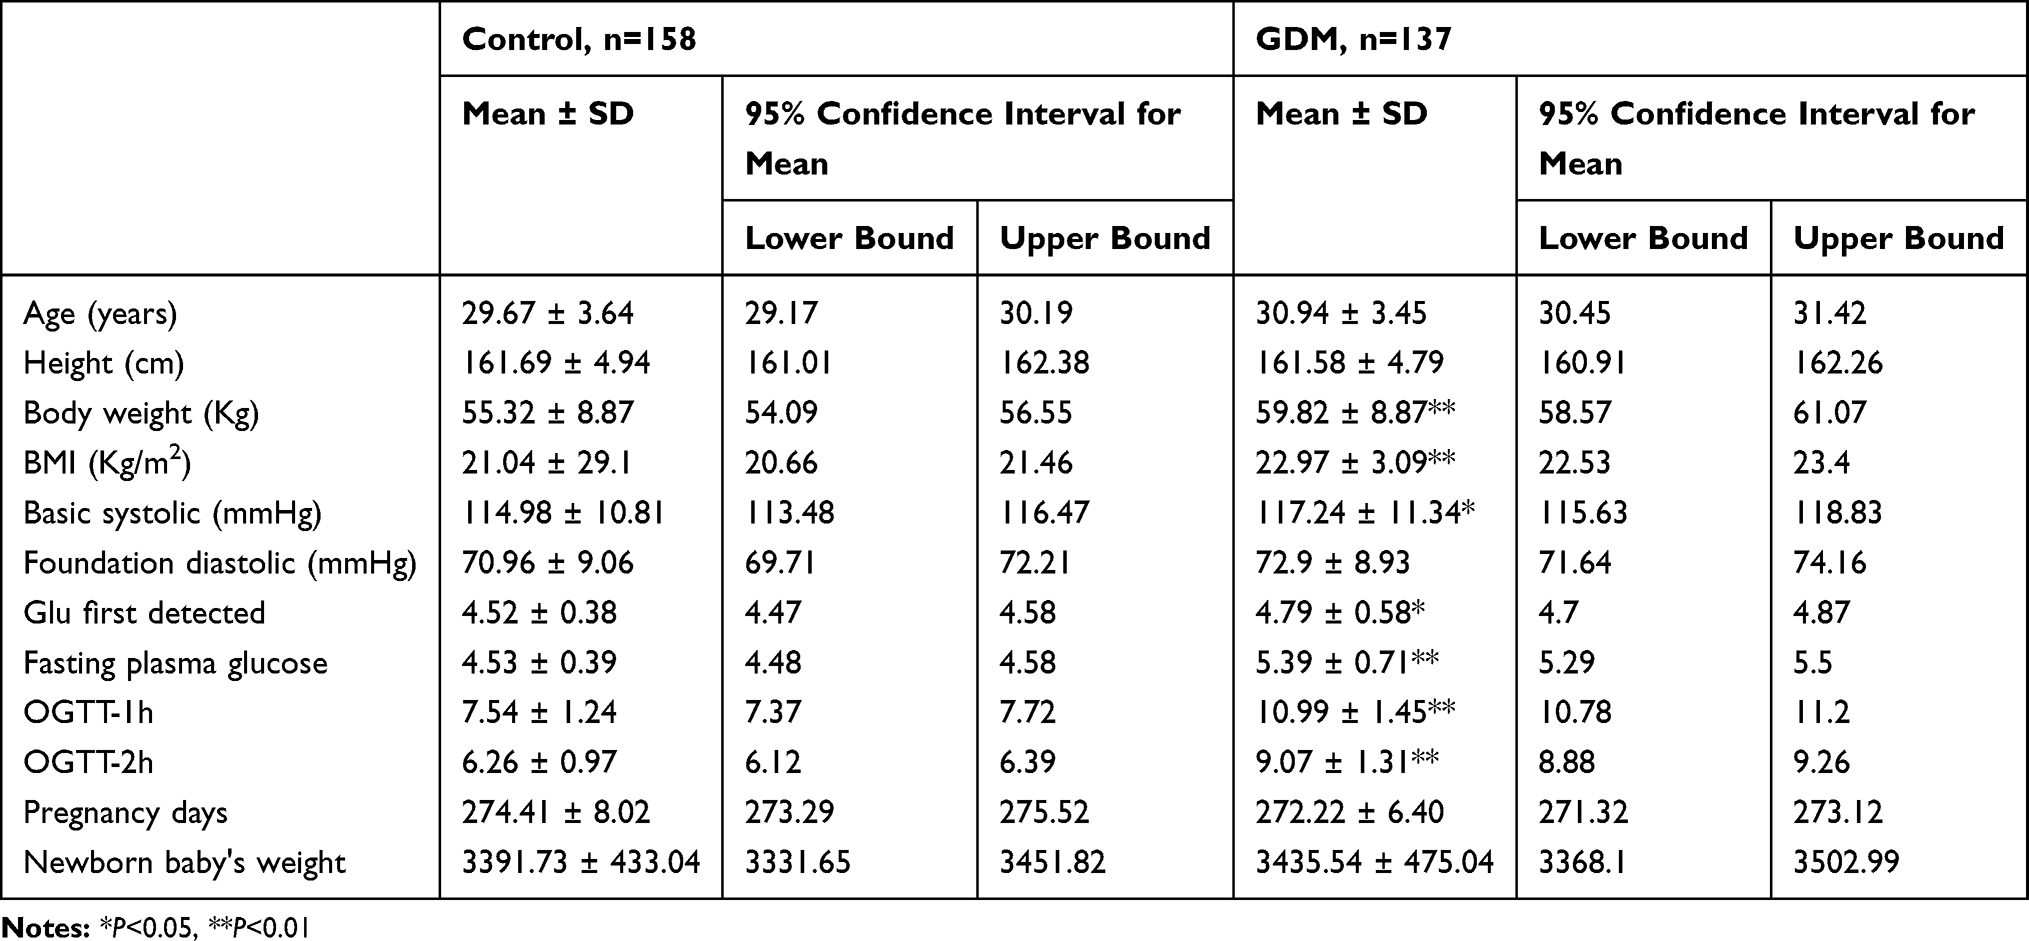 |
Table 1 Research Participants’ Statistical Characteristics |
GDM Rat Model
Eight-week-old female Sprague-Dawley (SD) rats were purchased from the Hua Yikang Biotechnology Co., and all animals were given free access to food and water. After confirming pregnancy, 30 rats were randomly assigned to three groups: control, moderate GDM, and severe GDM. Each group consisted of 10 pregnant female rats. On the first day of pregnancy, streptozotocin (STZ, Sigma, St Louis, USA) was injected intraperitoneally in the moderate GDM group at 35 mg/kg, and at 60 mg/kg in the severe GDM group. The blood glucose level was measured daily through the tail vein 3 days after the STZ injection. Rats with blood glucose levels of 7–16 mmol/l were considered to have moderate GDM, and those exceeding 16 mmol/l were considered to have severe GDM. GDM rats were sacrificed on the 21st day of pregnancy. All procedures have been approved by the Animal Protection and Use Committee of the National Institute of Family Planning of China. This study was carried out in strict accordance with the recommendations in the Guide for the Care and Use of Laboratory Animals of the National Institutes of Health.
Cell Culture and Treatment
Human HTR-8/SVneo cells gifted by Professor Yanling Wang from the Institute of Zoology of Chinese Academy of Sciences were cultured in RPMI-1640 complete medium (10% fetal bovine serum, 1% double antibody) placed in a 37°C cell culture incubator at 5% CO2. When the cells reached approximately 90% confluency, they were digested with 0.25% trypsin, and 1:2 split passages were continued and the cells were grown to logarithmic growth phase.
Palmitic acid (Sigma, St Louis, USA) powder was dissolved in 0.1 M NaOH at 70°C to form a 100 nM palmitic acid mother liquor, and then RPMI-1640 complete medium was added to prepare a 5 mM stock solution that was stored at −20°C. When in use, the palmitic acid solution was heated in a water bath at 55°C for 15 min, following by cooling at room temperature. Cells in palmitic acid treatment group were treated with different concentrations of palmitic acid (0.1, 0.25, 0.5, 0.75, and 1.0 μM), and those in insulin-treated group were treated with different concentrations of insulin (0.05, 0.25, 0.5, 1.0, and 1.5 μM) (Sigma, St Louis, USA); Cells in both groups were then cultured for 24 h.
In situ Hybridization
Human placentas from 137 GDM patients and 158 normal pregnant women were separately analyzed using two paraffin tissue microarrays according to the match between the case- and the control group. Paraffin sections were dewaxed and hydrated, denatured with 100μg/mL proteinase K (TransNGS, Beijing, China), and fixed in 4% paraformaldehyde. After pre-hybridization of the sections with the hybridization solution (Roche, Mannheim, Germany) at 40°C for 1 h, the digoxigenin (DIG)-labeled LNA-miR-21 probe was incubated at 40°C overnight. It was then washed with physiological saline drop sodium citrate (SSC) and blocked with blocking buffer containing 5% bovine serum albumin (BSA). The sections were incubated with alkaline phosphatase (AP)-labeled anti-DIG-antibody (Roche, Mannheim, Germany, 1:250) overnight at 4°C, and developed with 5-bromo-4-chloro-3-indolyl-phosphate and nitroblue tetrazolium (BCIP-NBT; Promega, Madison, WI, USA). Samples were viewed using a Nikon TE 2000-U microscope (NIKON, Tokyo, Japan).
Quantitative Reverse-Transcriptase Polymerase Chain Reaction (qRT-PCR)
The Trizol (Invitrogen, CA, USA) method was used to extract mRNA from the human placental tissue. Reverse transcription was performed using 1 mg of the total RNA (TakaRa Biotechnology, Dalian, China) to generate total cDNA. TaqMan MicroRNA Reverse Transcription Kit, miR-21, and U6 probes (Applied Biosystems, CA, USA) of Universal PCR Master Mix (Applied Biosystems, CA, USA) were used for reverse transcription and quantitative PCR of miRNA. Fifteen random pair samples from each age group (OGTT: 1st h; 2nd h; 0 h and 1st h; 0 h and 2nd h; 1st h and 2nd h; 0 h, 1st h, and 2nd h) and 18 random pair samples from each age group (≤25 Y, 26–30 Y, 31–35 Y, and ≥36 Y) were selected for qRT-PCR. Each sample in each experiment was detected in triplicates.
3-(4,5-Dimethyl-2-Thiazolyl)-2,5-Diphenyl-2-H-Tetrazolium Bromide, Thiazolyl Blue Tetrazolium Bromide (MTT)
The human HTR-8/SVneo cells were plated in 96-well plates and the cells were fused to 90%. The cells were transfected with miR-21 and incubated in a 37°C incubator for 48 h. The MTT (Sigma, St Louis, USA) solution was added to each well to a final concentration of 1 mg/mL, the cells were placed in a 37°C incubator for further culturing for 2–4 h, and then 100 μL Dimethyl sulfoxide (DMSO) per well was added to the solution, followed by shaking at 37°C for 10 min. The optical density (OD) value of each well was measured at a wavelength of 562 nm on a microplate reader (Bioteck, Vermont, USA, Gen 5, at 562 nm). Each treatment group had three replicates, and the experiment was repeated three times.
5-Ethynyl-2-Deoxyuridine (EdU) Assay
Human HTR-8/SVneo cells were inoculated into 24-well plates at 4 × 10³ to 1 × 10⁵ cells per well and cultured until the cells grew normally. After the transfected cells were cultured for 48 h in a 37°C incubator, the EdU solution was diluted to 1000:1 with the cell culture medium and 100 μL of EdU medium was added to each well in a 24-well plate, and the incubation was continued for 2 h. The images were acquired under a fluorescence microscope using the EdU Cell Proliferation Assay Kit (RiBoBio, Guangzhou, China) and Apollo® 567 (550/565 nm, red light). Five fields of view were randomly selected to count the number of red fluorescent cells (representing the number of positive cells) and the total number of nuclei (representing the total number of cells) in the field of view. The positivity of the EdU marker was determined as follows: EdU marker positive rate = number of positive cells/total number of cells. Finally, the arithmetic mean of the five positive rates is calculated as the final positive rate of the EdU marker. Each treatment group had three replicates, and the experiment was repeated three times.
Cell Migration and Cell Infiltration
The transwell chamber method was used to detect cell migration and infiltration. The transfected cells were resuspended in a medium containing 1% fetal bovine serum, and the cell concentration was adjusted to 0.5 × 10⁹ cells/l; 100 µL of this cell suspension was added to the transwell. In the chamber, 600 µL of the culture medium containing 2.5% fetal calf serum was added to the lower chamber. Among them, the cells that infiltrated the transwell chamber were covered with Matrigel (#354,248, BD Biosciences, NJ, USA), diluted 1:3, and counted by microscope after 12 h. The cells were fixed before observation, stained with 0.1% crystal violet, and the total number of cells in 5 fields was recorded under a 40x objective lens and the average value was calculated. The experiment was repeated three times.
Apoptosis Assay
The V13241 kit (Invitrogen, CA, USA) was used to detect apoptosis. Cells were transfected with 1× Annexin-binding buffer and resuspended in 1 × 10⁶ cells/mL. A total of 100 μL of each sample was incubated with 5 μL Alexa Fluor 488 annexin V (Component A) and 1μL 100 μg/mL propidium iodide (PI) working solution in dark at 15 min; 400μL 1× Annexin-binding buffer was then added and mixed on ice, and immediately analyzed by flow cytometry. The experimental results were verified 3 times.
Vector Construction
A 396 bp PPAR-α-3ʹ-UTR containing the miR-21 binding site was ligated to the pmir-GLO vector. The restriction sites were specific to Xbal and Sal1. (PPAR-α-3ʹUTR-Forward, 5ʹ-GGGGT ACCATGGTGGACACGGAAAGC-3ʹ, PPAR-α-3ʹUTR-Reverse, 5ʹ-CGGGATCCTCAGTACATG TCCCTGTAGATCT-3ʹ).
The mutant primers were designed using the Easy Mutagenesis System kit (TransGen Biotech, Beijing, China). The primer sequences are as follows: (PPAR-α-3ʹUTR-mut1-Forward,5ʹ-AAAAAAAAAATCTGTTAGTTCATCGATCAAATTGCAGC-3ʹ, PPAR-α-3ʹUTR-mut1-Reverse, 5ʹ-TCG ATGAACTAACAGATTTTTTTTTTGGTTGTGTGTTT-3ʹ, PPAR-α-3ʹUTR-mut2-Forward, 5ʹ-CC CCCGCTCTGGACTGTCATATGTTTGCACCCGTGGTA-3ʹ, PPAR-α-3ʹUTR-mut2-Reverse, 5ʹ- AAACATATGACAGTCCAGAGCGGGGGTCTTGAGACTCT-3ʹ). The pcDNA3.1-PPAR-α expression vector was constructed and the PPAR-α CDS sequence was amplified by PCR. The restriction sites were specific to KpnI and BamH1. (pcDNA3.1-PPAR-α-Forward, 5ʹ-CGGTGACTTATCCTGTGGTCC-3ʹ, pcDNA3.1-PPAR-α-Reverse, 5ʹ-CCGCAGATTCTACATTCGATGTT- 3ʹ).
Dual Luciferase Reporter Assay
Detection for the reporter assays was performed using the Promega dual luciferase assay (Promega, Madison, USA). Briefly, 10 μL of cell lysate was pipetted into the reaction tube and 30 μL of LAR II solution was added to the reaction tube, mixed, and the firefly luciferase activity was measured. Afterwards, 30 μL of Stop & Glo solution was added to the reaction tube and mixed to detect Renilla luciferase activity. Each treatment was performed in triplicate and in three independent experiments. The results have been expressed as relative luciferase activity (firefly luciferase/Renilla luciferase).
Western Blot Analysis
The extracted protein extract was boiled in SDS/β-mercaptoethanol sample buffer, and then 60 µg of the protein extract was electrophoresed on a 5–12% gradient polyacrylamide gel and transferred to a PVDF membrane (GE-Amersham, Chicago, USA), blocked with blocking solution (5% skim milk) for 60 min, followed by incubation with the PPAR-α antibody (1:500, Abcam, Cambridge, UK) overnight at 4°C. The membranes were then incubated with a horseradish peroxidase-conjugated secondary antibody, diluted 1:1000 for 1 h at 20°C after washing with tris-buffered saline and polysorbate buffer. Finally, ECL detection reagents (Millipore, Darmstadt, Germany) were added to the membranes for 1 min and were immediately exposed to X-ray film (Kodak, NY, USA). Quantitative measurement of the immunoblots was performed using ImageJ. The experiment was repeated at least three times.
Glucose Absorption Detection
Glucose uptake cell-base assay kit (Cayman, Michigan, USA) was used to measure glucose uptake in cells. The glucose uptake assay protocol is based on a fluorescent glucose analog, which can be taken up by cells through glucose transporters. However, this glucose analog cannot be fully utilized in glycolysis because of its modification and thus accumulates inside the cells. Fluorescence generated by the fluorescent glucose analog is proportional to the glucose uptake by the cells and can be used to measure glucose uptake using fluorescent microscopy and flow cytometry. Briefly, 100 μL of 2-NBDG was added to a 96-well plate in sugar-free medium. After incubation in dark for 2 h, the absorbance was read at 485 and 535 nm using a microplate reader. The experimental results were verified 3 times.
Cell Total Sugar Detection
Cell sugar was detected and measured with anthrone (Sigma, St Louis, USA). The treated cells were collected and 60 μL of the alkaline solution was added. After taking 30 μL of bicinchoninic acid (BCA) to detect the protein concentration, the solution was boiled in a water bath for 20 min, cooled to 20°C and 0.5 mL of anthrone was added to each tube. After using the boiling water bath for 5 minutes, add 200 μL to a 96-well plate. The absorbance was detected at 620 nm with a microplate reader, and the value was calculated according to the standard curve. The experimental results were verified 3 times.
Statistical Analysis
SPSS (version 25.0) and GraphPad Prism (version 6.0) were used for data analysis. Results with the P value less than 0.05 were considered statistically significant. Data for continuous variables are expressed as the mean ± SD. Student’s t-test was used to compare the differences between groups.
Results
Reduced Expression of miR-21 in the Placenta of GDM Patients and the Expression of PPAR-α Increases
Human placenta samples were collected from 137 pregnant women with GDM and 158 women with no GDM. The average BMI values in the control and GDM groups were 21.04 and 22.97, respectively (Table 1). qRT-PCR was used to detect the expression of miR-21 in the placentas samples of GDM patients (Figure 1A). The miR-21 expression in GDM patients was significantly lower than that in the control group at 1 h and 0–1 h. This suggests that miR-21 may play a regulatory role in glucose metabolism.
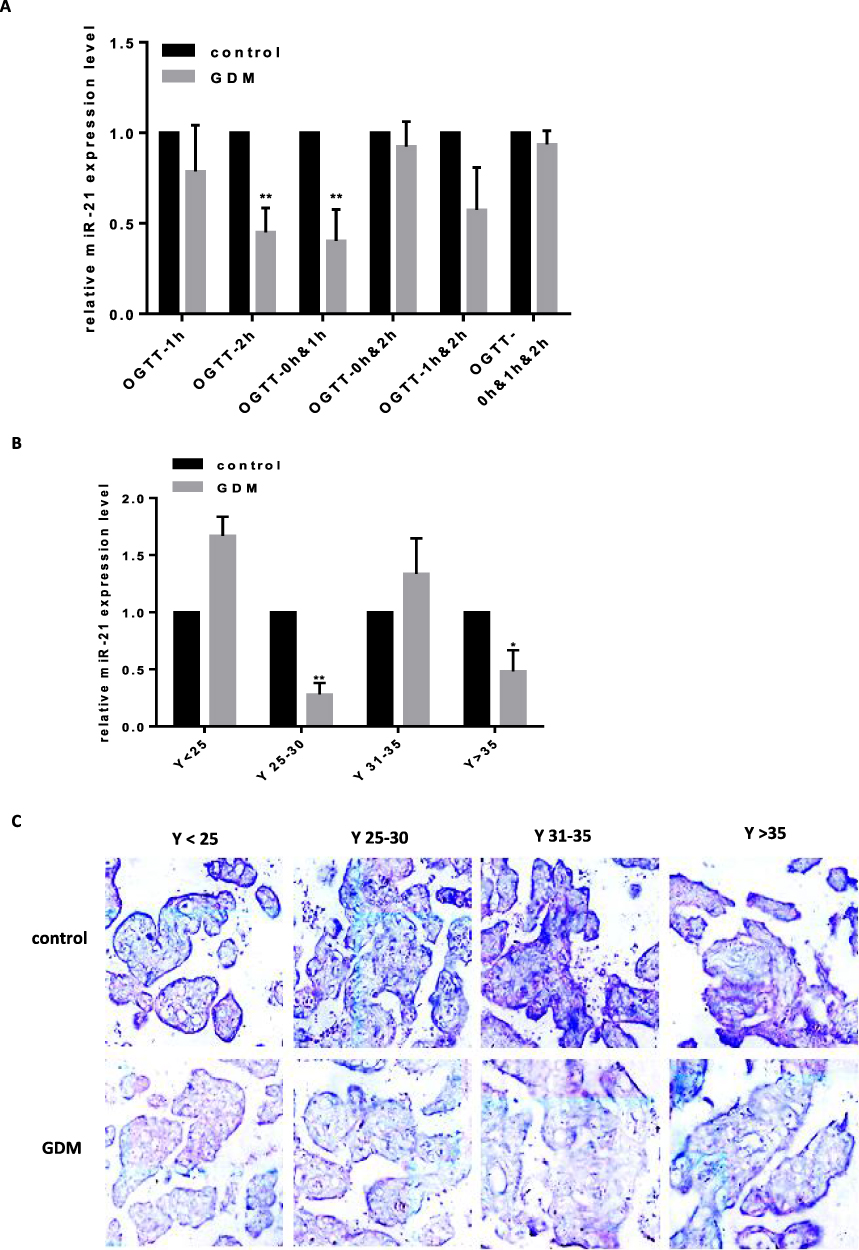 |
Figure 1 Reduced expression of miR-21 in the placenta of GDM patients and the expression of PPAR-α increases (A) Expression of miR-21 was detected in groups according to the OGTT time. n = 15 per group. (B) Expression of miR-21 in the placenta of GDM patients according to age. n = 15 per group. (C) Expression of miR-21 in the placental tissues of the GDM patients and normal pregnant women was detected by in situ hybridization using DIG-labeled LNA probes specific to miR-21. *P<0.05, **P<0.01. |
In the placenta of GDM patients, we also found that miR-21 expression was reduced compared to that of the control group. Age is one of the key factors for the onset of GDM, so we divided patient specimens into four groups based on age: aged under 25 years (Y<25 years), 25–30 years (Y25-30), 31–35 years (Y31-35), and over 35 years old (Y>35). RT-PCR analysis showed that miR-21 expression was significantly lower in the Y25-30 and Y>35 groups than that in the control group (Figure 1B). The in situ hybridization results showed that in the human placenta, the miR-21 positivity was localized in the apical membrane of the syncytiotrophoblast cells and villous matrix (Figure 1C).
We predicted through TargetScan that PPAR-α was the target gene of miR-21. To further confirm that miR-21 affected the expression of PPAR-α, the protein expression levels of PPAR-α were detected by Western blotting (Figure 2A and B). Compared with the control group, the PPAR-α protein level was significantly increased in the placenta of the GDM patients. Immunohistochemistry was used to detect the PPAR-α distribution. We found that PPAR-α is mainly located in the apical membrane of the syncytiotrophoblast and villous stroma in both the GDM patients and normal controls (Figure 2C).
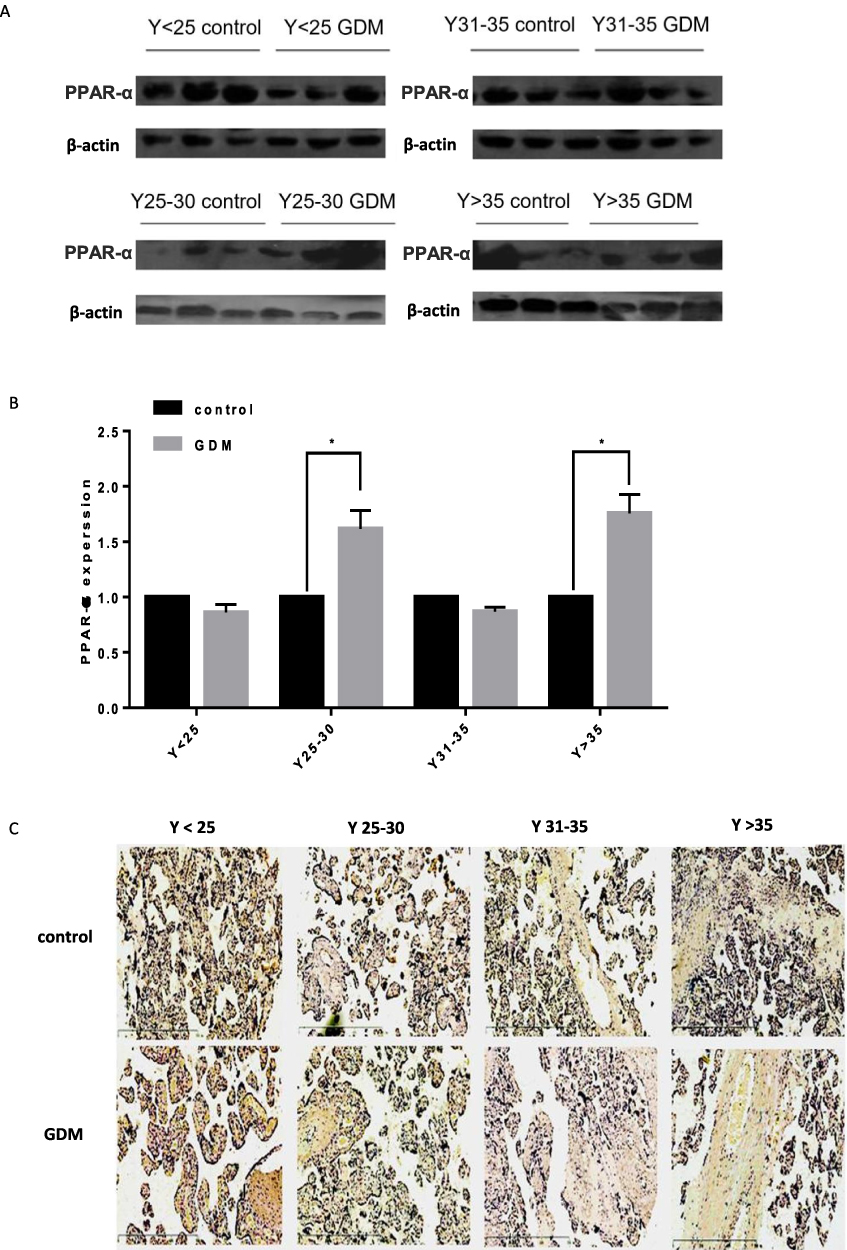 |
Figure 2 Reduced expression of miR-21 in the placenta of GDM patients and the expression of PPAR-α increases (A and B) PPAR-α in the placenta of GDM patients. The expression levels of PPAR-α in the placental tissue changes with age, and is significantly upregulated in the placental tissues of pregnant women aged 25 years and older. n = 3 per group. (C) Immunohistochemistry was used to detect the PPAR-α distribution. Brown particles are positively colored and are mainly expressed in the placenta and villus tissue. *P<0.05. |
Reduced Expression of miR-21 in the Placenta of GDM Rat Model and the Expression of PPAR-α Increases
To explore the correlation between the miR-21 expression in the placenta and severity of GDM, we constructed GDM rat models with varying blood glucose concentrations. The expression of miR-21 was detected in the rat placenta. It was found that moderate GDM (BS 7–16 mM) and severe GDM (BS>16 mM) severely reduced the miR-21 expression (Figure 3A). Therefore, treatment with high glucose can inhibit miR-21 expression in the placenta.
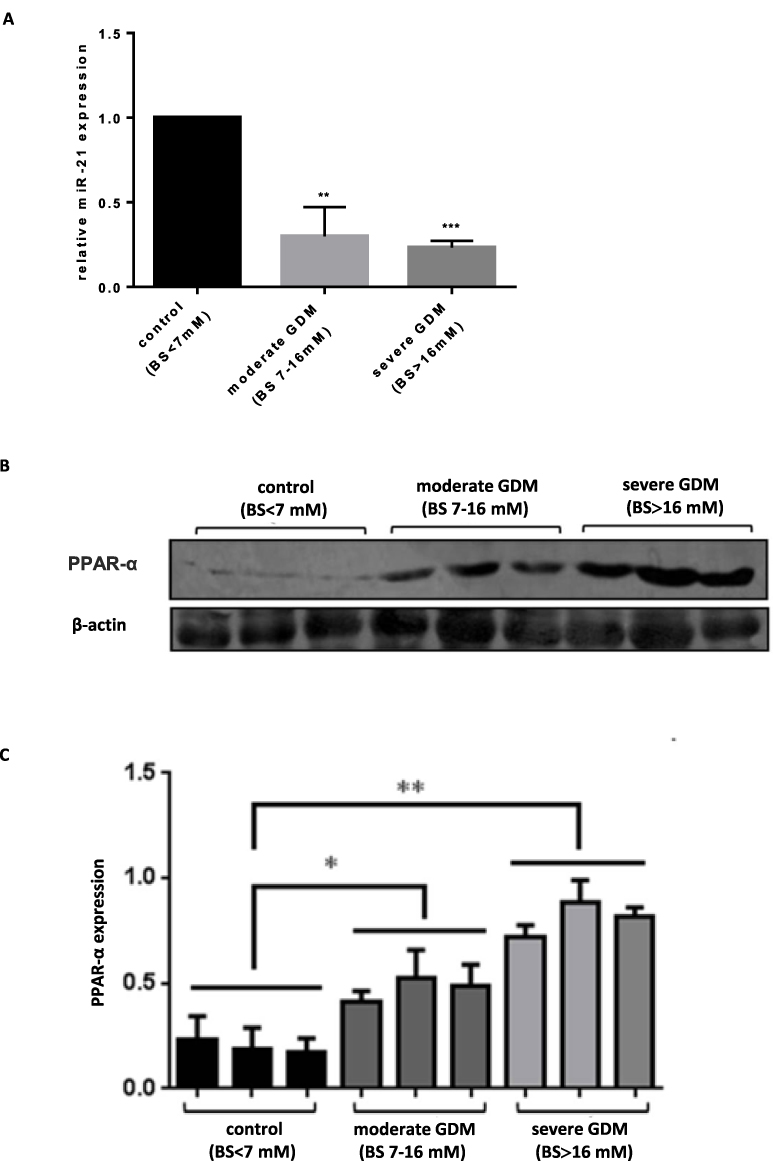 |
Figure 3 Reduced expression of miR-21 in the placenta of GDM rat model and the expression of PPAR-α increases. (A) Expression of miR-21 in the placenta of GDM rats. n = 5 per group. (B and C) Expression of PPAR-α in the placenta of GDM rats. PPAR-α was highly expressed in the placenta of rats with very high blood glucose concentration but was lowly expressed in the control group. The expression of PPAR-α in the placenta of rats increased with an increase in blood glucose concentration. n = 3 per group. *P<0.05, **P<0.01, ***P<0.001. |
In the GDM rat model, the protein expression levels of PPAR-α gradually increased with the increase in blood sugar concentration. The protein expression levels of PPAR-α were not significantly different between the moderate GDM and severe GDM groups (Figure 3B and C) but were significantly enhanced in the moderate GDM (BS 7–16 mM) and severe GDM (BS>16 mM) groups as compared with the control group. The results show that the decrease in miR-21 expression in the placenta of the GDM leads to an increase in PPAR-α expression, which may be related to the severity of GDM.
Effect of miR-21 on Glucose Uptake in a Palmitic Acid-Induced Insulin Resistance Model
As a result of our search for fatty acid inducers of insulin resistance, we found that palmitic acid (PA) induced cell viability of cultured HTR-8/SVneo cells in a concentration-dependent manner, with an effective PA concentration of approximately 0.5 μM and insulin concentration of approximately 0.25 μM (Figure 4A and B). By comparing glucose absorption and total intracellular sugar when the insulin group was not significantly different from the control group and the palmitic acid group was significantly different from the insulin synergistic palmitic acid group, it was considered that the cells have insulin resistance induced by palmitate (Figure 4C and D, y=0.0054x-0.0026, R2=0.9973). To study the role of miR-21 in insulin resistance, we transfected cells with miRNA mimic negative control, miR-21 mimic, miRNA inhibitor negative control, and miR-21 inhibitor, and treated those with 0.25 μM insulin or 0.5 μM palmitic acid and 0.25 μM insulin. The results show that miR-21 mimic promoted glucose uptake (Figure 4E) and increased the intracellular total glucose compared with the miRNA mimic negative control (Figure 4F). When cells were treated with 0.25 μM insulin alone, miR-21 inhibited the glucose uptake (Figure 4E) and decreased the intracellular total glucose (Figure 4F, y=0.0008x+0.0018, R2=0.9971). However, miR-21 inhibitor had no significant effect on the glucose uptake and intracellular total glucose in the control and insulin-treated groups. When treated with 0.25 μM insulin and 0.5 μM palmitic acid, miR-21 inhibitors significantly increased the glucose uptake (Figure 4E) and intracellular total glucose (Figure 4F), whereas miR-21 mimic did not have a significant effect. The results show that the low expression of miR-21 in the placenta of GDM patients can promote glucose uptake and total sugar accumulation in the human villous trophoblast cells and delay the occurrence of insulin resistance.
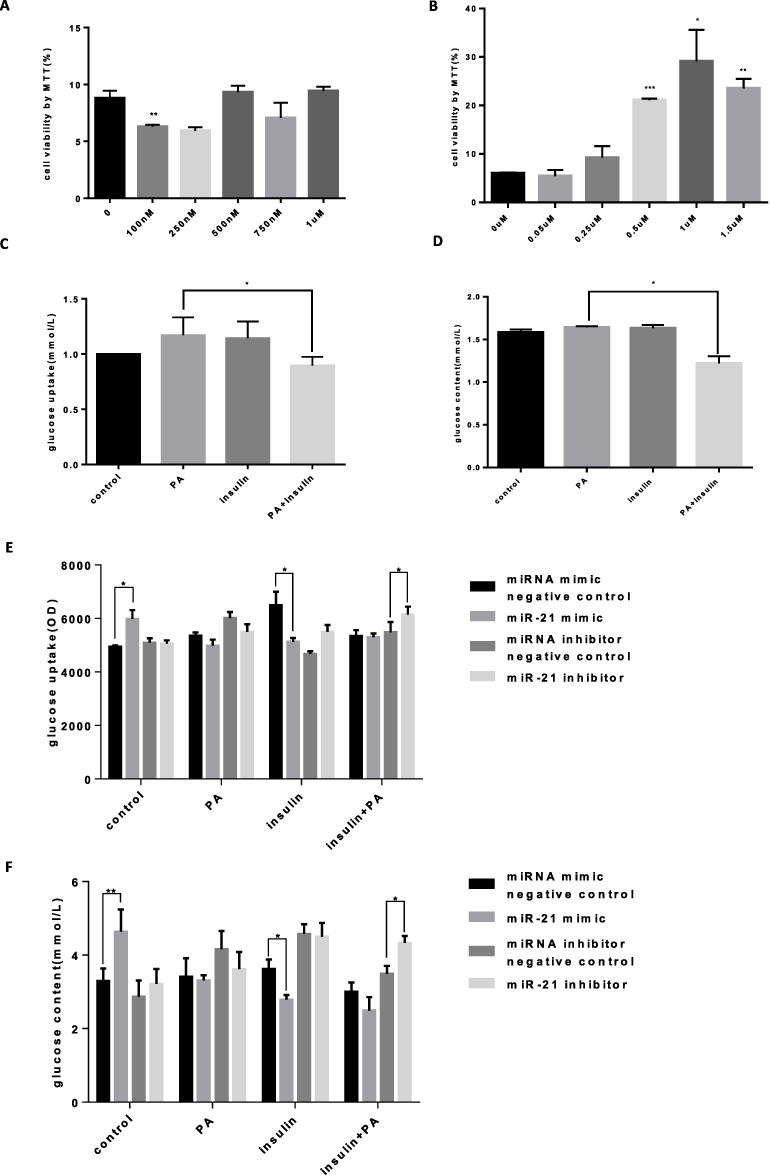 |
Figure 4 Palmitic acid-induced insulin resistance model (A) HTR-8/SVneo cells were treated with palmitic acid (0.1, 0.25, 0.5, 0.75, and 1.0 μM) for 24 h, and the cell viability was measured. n = 3 per group. (B) HTR-8/SVneo cells were treated with insulin (0.05, 0.25, 0.5, 1.0, and 1.5 μM) for 24 h, and the cell viability was measured. n = 3 per group. (C) Glucose uptake in HTR-8/SVneo cells. The absorption of glucose by HTR-8/SVneo cells increased in the insulin (0.25 μM) and PA (0.5 μM) treated groups. The PA and insulin synergistic treatment groups showed a significant decrease compared with the glucose uptake of the PA group. n = 3 per group. (D) Total amount of sugar in HTR-8/SVneo cells. n = 3 per group. (E) Glucose uptake by HTR-8/SVneo cells transfected with miR-21. HTR-8/SVneo cells transfected with miR-21 mimics had an early time for insulin resistance, and the insulin (0.25 μM) group had a significant decrease in glucose uptake and was not sensitive to insulin. The amount of glucose uptake in the miR-21 inhibitor group was significantly increased, but insulin resistance did not occur; low dose of miR-21 prevented the development of insulin resistance. n = 3 per group. (F) Total sugar content of HTR-8/SVneo cells transfected with miR-21. HTR-8/SVNEO cells transfected with miR-21 mimics developed insulin resistance in advance, and the insulin absorption capacity of the insulin (0.25 μM) group was significantly decreased. In the miR-21 inhibitor group, the total glucose content of the PA (0.5 μM) and insulin (0.25 μM) co-treatment groups was significantly increased, and the low dose of miR-21 destroyed the development of insulin resistance, while simultaneously causing insulin resistance. n = 3 per group. *P<0.05, **P<0.01, ***P<0.001. |
Effects of miR-21 on Cell Biological Behavior
To further explore the role of miR-21 in the placenta of GDM patients, we investigated the effects of miR-21 on cell proliferation. Cell proliferation was examined using MTT and EdU assays. The results showed (Figure 5AC) that the proliferation rate of miR-21 mimic cells was significantly higher than the control group, and the proliferation rate of miR-21-inhibited cells was significantly lower than the control group, indicating that miR-21 promoted the proliferation of HTR-8/SVneo cells.
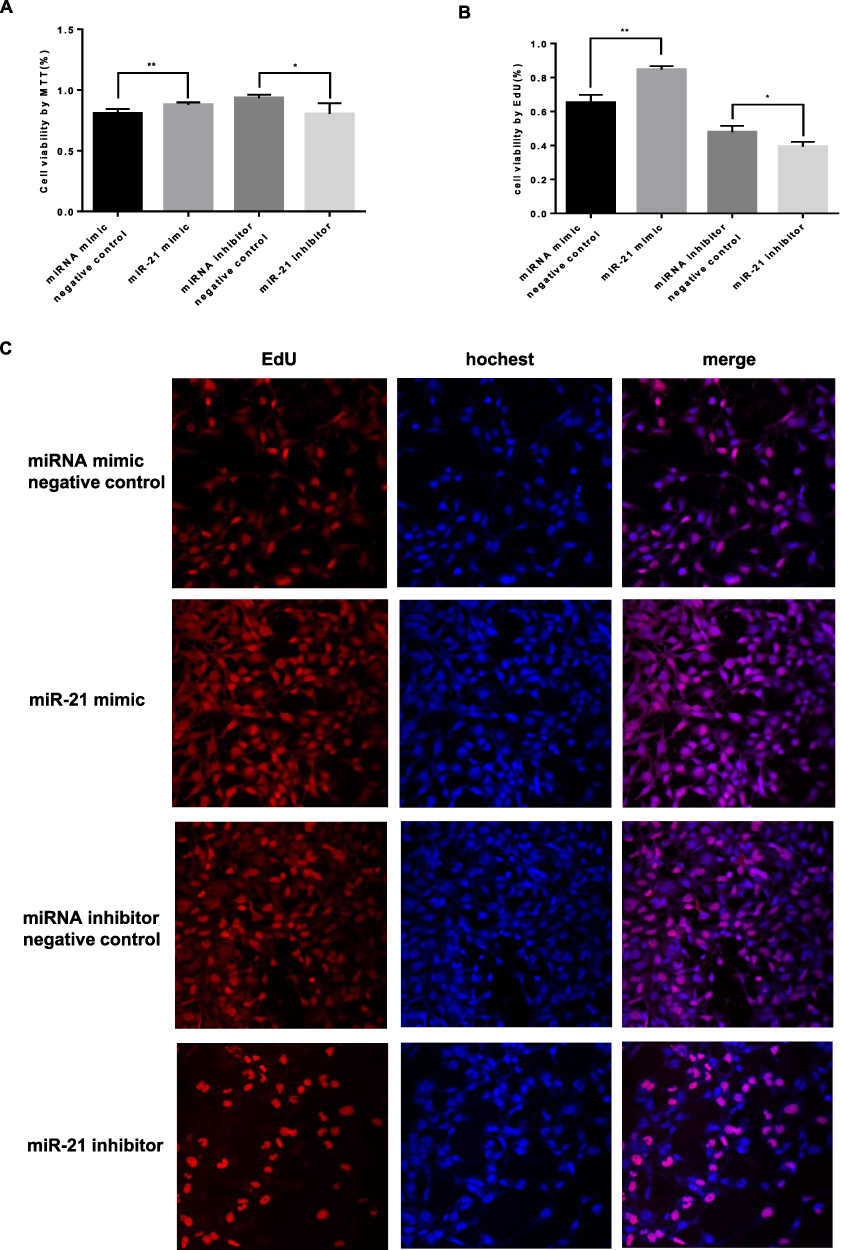 |
Figure 5 Role of miR-21 in the proliferation of HTR-8/SVneo cells (A) Cell proliferation was detected by MTT assay. n = 3 per group. (B and C) Cell proliferation was detected by EdU assay. The miR-21 transfection promotes proliferation in HTR-8/SVneo cells. n = 3 per group. *P<0.05, **P<0.01. |
To verify the effect of miR-21 on HTR8/SVneo cell apoptosis, flow cytometry was used to detect apoptosis. Apoptotic cells were divided into two groups: early apoptotic and late apoptotic cells (Figure 6A and B). The results showed that miR-21 mimic significantly inhibited apoptosis in the treated cells compared with the control cells. In the miR-21 inhibitor group, the rate of apoptosis increased significantly, demonstrating that miR-21 inhibited the apoptosis of HTR-8/SVneo cells.
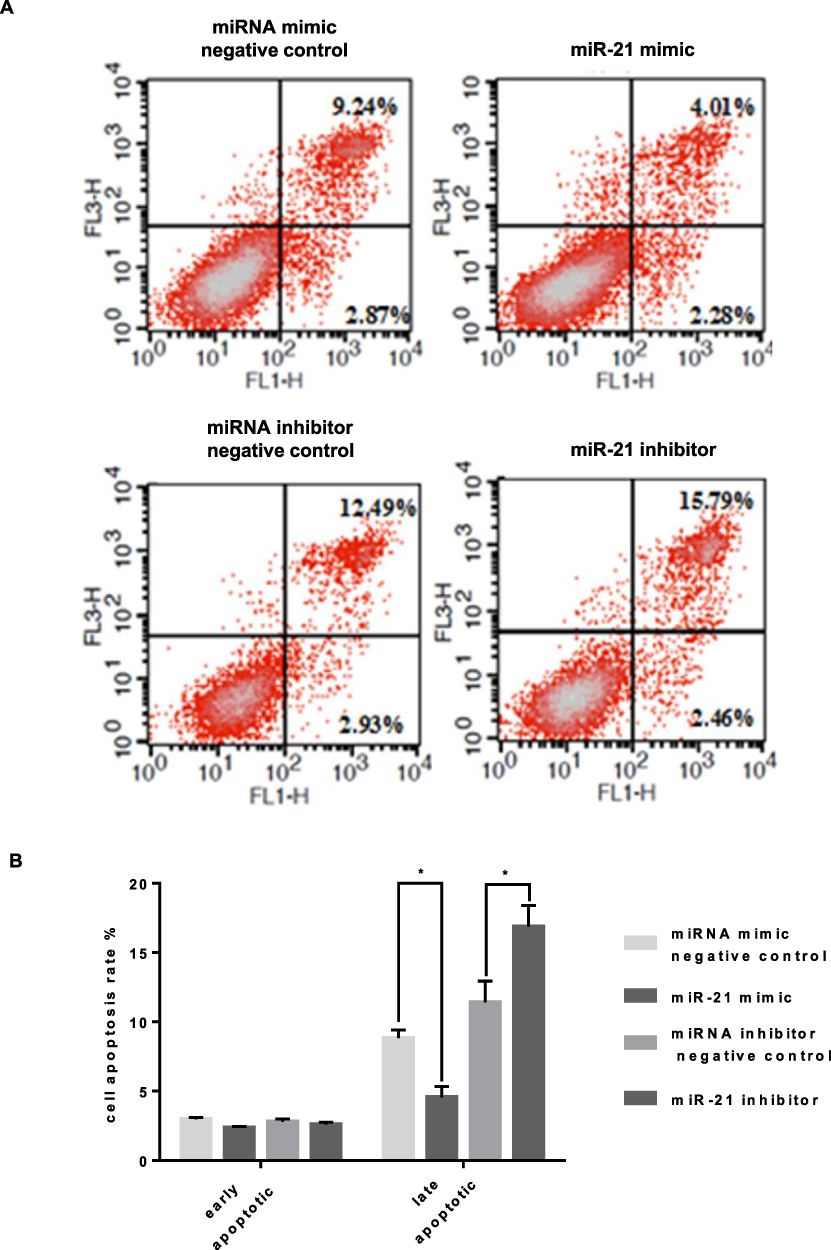 |
Figure 6 Role of miR-21 in the apoptosis of HTR-8/SVneo cells (A and B) Flow cytometry analysis for detecting apoptosis shows that miR-21 inhibits apoptosis of HTR-8/SVneo cells. n = 3 per group. *P<0.05. |
The transwell invasion assay and Matrigel assay were used to detect the invasion (Figure 7A and 7B) and migration (Figure 8A and B) ability of miR-21 on HTR8/SVneo cells. It was found that the miR-21 mimic group significantly increased the number of migrated and infiltrated cells compared with that of the control group. In the miR-21 inhibitor group, the number of migrated and infiltrated cells was significantly reduced compared to that in the control group, suggesting that miR-21 promoted the migration and infiltration of HTR8/SVneo cells. The results showed that the expression of miR-21 directly affected the proliferation, apoptosis, migration, and infiltration capacity of HTR8/SVneo cells.
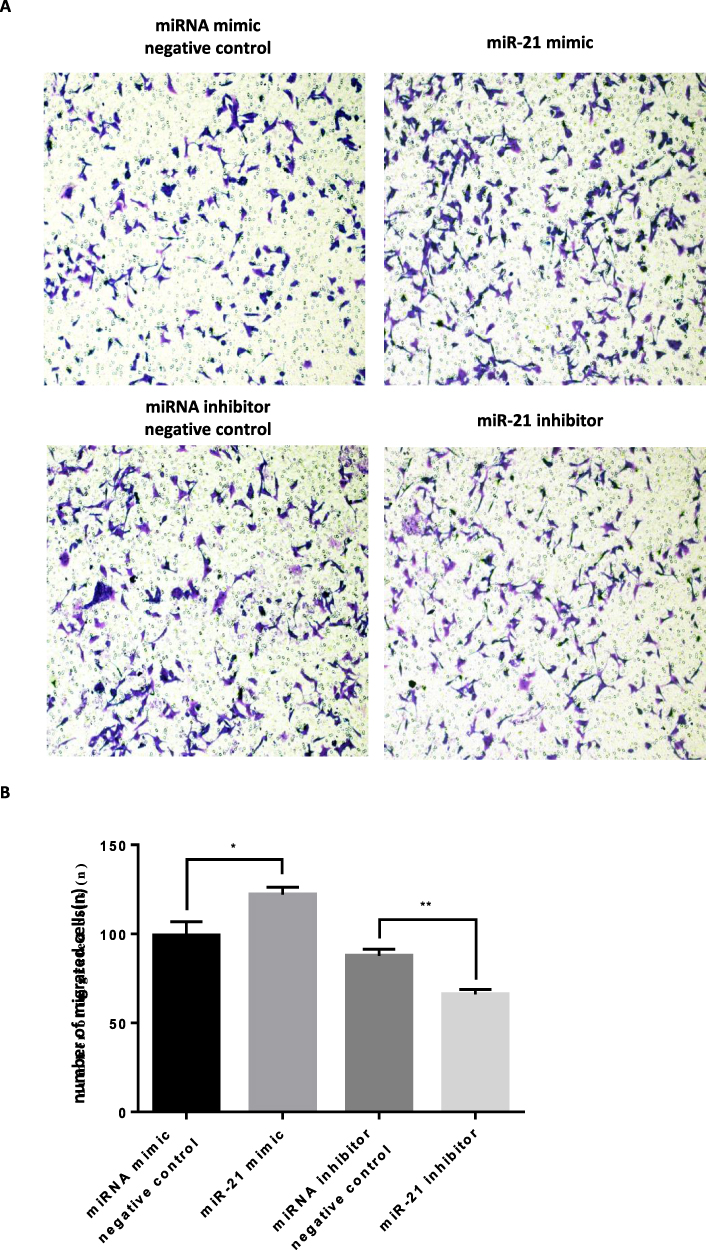 |
Figure 7 Role of miR-21 in the migration of HTR-8/SVneo cells (A and B) Transwell assay for cell migration shows that miR-21 promotes cell migration. n = 3 per group. *P<0.05, **P<0.01. |
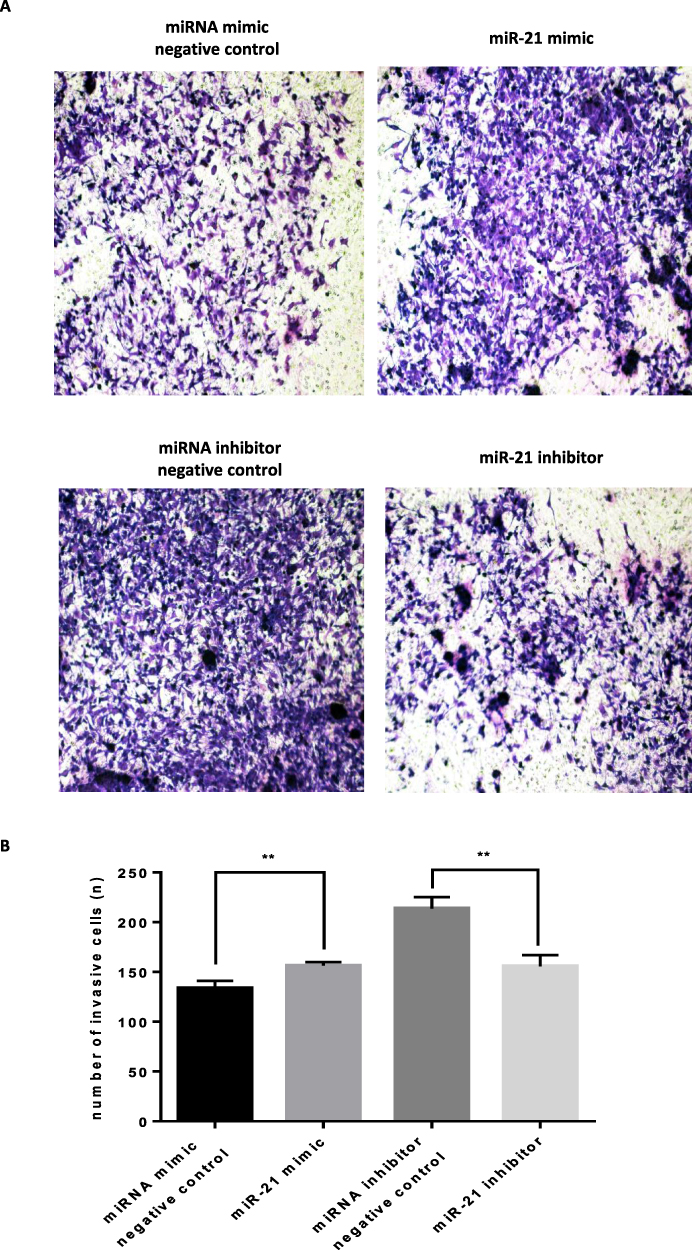 |
Figure 8 Role of miR-21 in the infiltration of HTR-8/SVneo cells (A and B) Transwell assay for cell infiltration shows that miR-21 promotes cell infiltration. n = 3 per group. **P<0.01. |
Prediction and Confirmation of the miR-21 Target Gene
The miRNAs execute their functions by regulating their target genes. To investigate the possible underlying molecular mechanism of miR-21 on the function of trophoblast cell, miR-21 target genes were predicted using the TargetScan algorithm. There was a highly conserved binding site of miR-21 in the 3′-untranslated region (UTR) of the PPAR-α gene (Figure 9A). To confirm the interaction between miR-21 and PPAR-α, we constructed wild-type and mutant dual-luciferase recombinant reporter vectors (Figure 9B and C) containing PPAR-α-3´- UTR region. As shown in Figure 9D, HTR-8/SVneo cells co-transfected with PPAR-α and miR-21 mimics inhibited the luciferase activity as compared to that in the control group. Compared with the control group, HTR8 cells co-transfected with PPAR-α and miR-21 inhibitors had significantly higher luciferase activity than the control group. The results showed that miR-21 could regulate the expression of PPAR-α. In cells co-transfected with the PPAR-α mutation binding site vector and miR-21, miR-21 lost the regulation of PPAR-α, indicating that PPAR-α is a target gene of miR-21 (Figure 9E). Although the miR-21 seed sequence could bind with the PPAR-α 3´-UTR, it was still unclear whether dysregulated miR-21 expression affected the endogenous PPAR-α protein levels. To resolve this concern, miR-21 mimic or inhibitor was transfected into HTR-8/SVneo cells and the protein expression levels of PPAR-α were detected by Western blotting (Figure 9FI). The miR-21 mimic significantly inhibited the PPAR-α expression (Figure 9G) and miR-21 inhibitor visibly upregulated the protein expression levels of PPAR-α (Figure 9I).
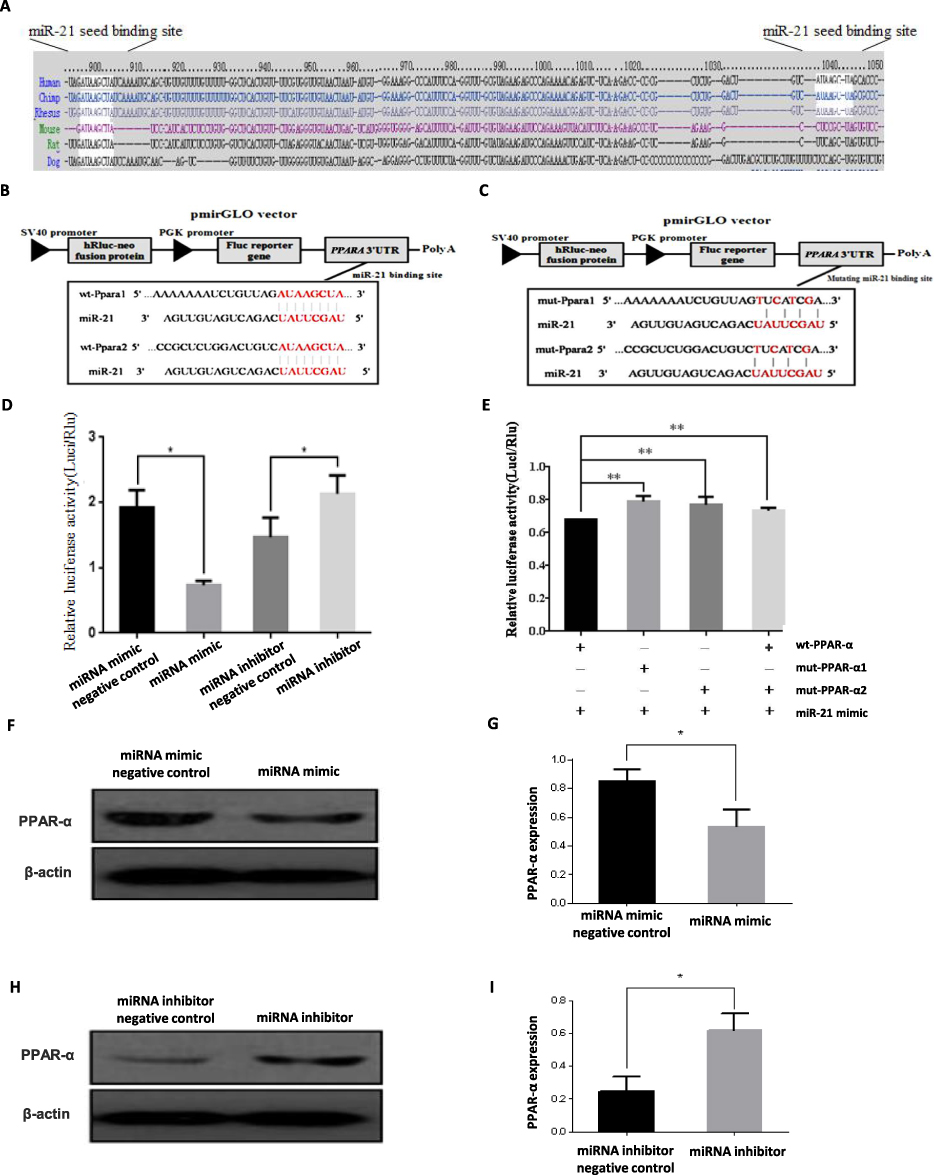 |
Figure 9 Target gene verification of miR-21 (A) The miR-21 binding sites in the 3´-UTR region of PPAR-α were compared in cross-species. (B) The 3′ -UTR fragment of wild-type (wt)-PPAR-α containing the binding sites of miR-21 was cloned downstream of the firefly luciferase reporter gene in the pmir-GLO vector for the dual-luciferase assay. (C) The vector construction of mutating miR-21 binding region in the 3´-UTR of PPAR-α. (D) Cells were co-transfected with miR-21 mimics, miR-21 inhibitor, pre-miR control, or anti-miR control, and wt-PPAR-α for dual-luciferase assay. n = 3 per group. (E) PPAR-α- 3′-UTR mutation in dual luciferase reporter in HTR8/SVneo cells. HTR-8/SVneo cells co-transfected with mut-pGLO-PPAR-α and miR-21 mimics significantly reduced the dual luciferase activity compared to HTR-8/SVneo cells transfected with miR-21 mimics and PPAR-α-pGLO. The expression of PPAR-α gene may be inhibited by miR-21 through binding to a specific region of the 3´-UTR of PPAR-α. n = 3 per group. (F and G) Western blotting to verify the protein expression of miR-21 target gene. PPAR-α was under-expressed in HTR-8/SVneo cells transfected with miR-21. n = 3 per group. (H and I) PPAR-α was highly expressed in HTR-8/SVneo cells transfected with miR-21 inhibitor. n = 3 per group. *P<0.05, **P<0.01. |
Effects of PPAR-α on Cell Biological Behavior
To detect the effect of PPAR-α on the function of HTR-8/SVneo cells, PPAR-α was overexpressed by constructing the PPAR-α expression vector and knocked down using small interfering RNA (siRNA) molecules (Figure 10AD). PPAR-α expression significantly increased the protein levels of PPAR-α (Figure 10A and B) and PPAR-α siRNA remarkably diminished the protein level of PPAR-α (Figure 10C and D).
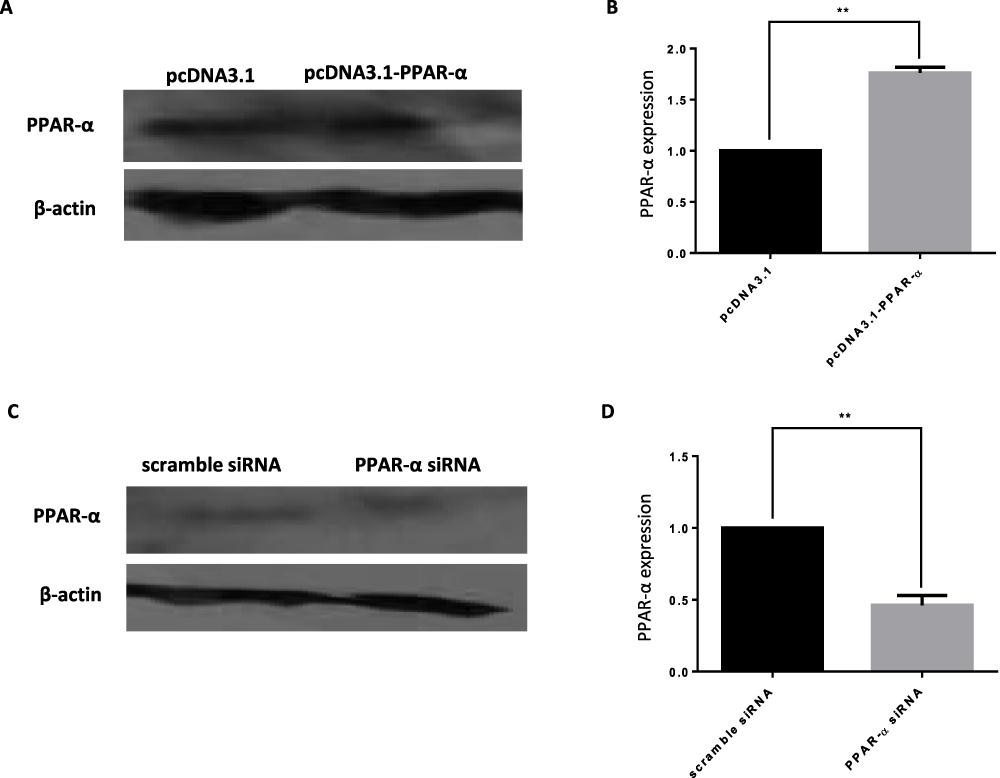 |
Figure 10 Target gene verification of miR-21 (A–D) Detection of the expression of PPAR-α by Western blotting. As compared with the expression levels of endogenous PPAR-α in the HTR-8/SVneo cells transfected with pcDNA3.1, pcDNA3.1-PPAR-α, scramble siRNA, and PPAR-α siRNA. n = 3 per group. **P<0.01. |
When the PPAR-α expression vector was cotransfected with miR-21 mimic in the cells, the cell proliferation, migration, invasion capacity, and apoptosis levels were comparable to those of the control group. Cell proliferation (Figure 11AC), migration (Figure 12A and B), and invasion capacity (Figure 13A and B) were lower, whereas the apoptosis levels were higher (Figure 14A and B) when the PPAR-α expression vector was cotransfected with miR-21 mimic than in HTR8/SVneo cells transfected with the PPAR-α expression vector alone. When PPAR-α siRNA was cotransfected with miR-21 inhibitor in the HTR8/SVneo cells, the cell proliferation (Figure 15AC), migration (Figure 16A and B), and invasion capacity (Figure 17A and B) was higher and apoptosis levels were lower (Figure 18A and B) than that transfected with PPAR-α siRNA alone. These results show that PPAR-α is a functional target gene of miR-21.
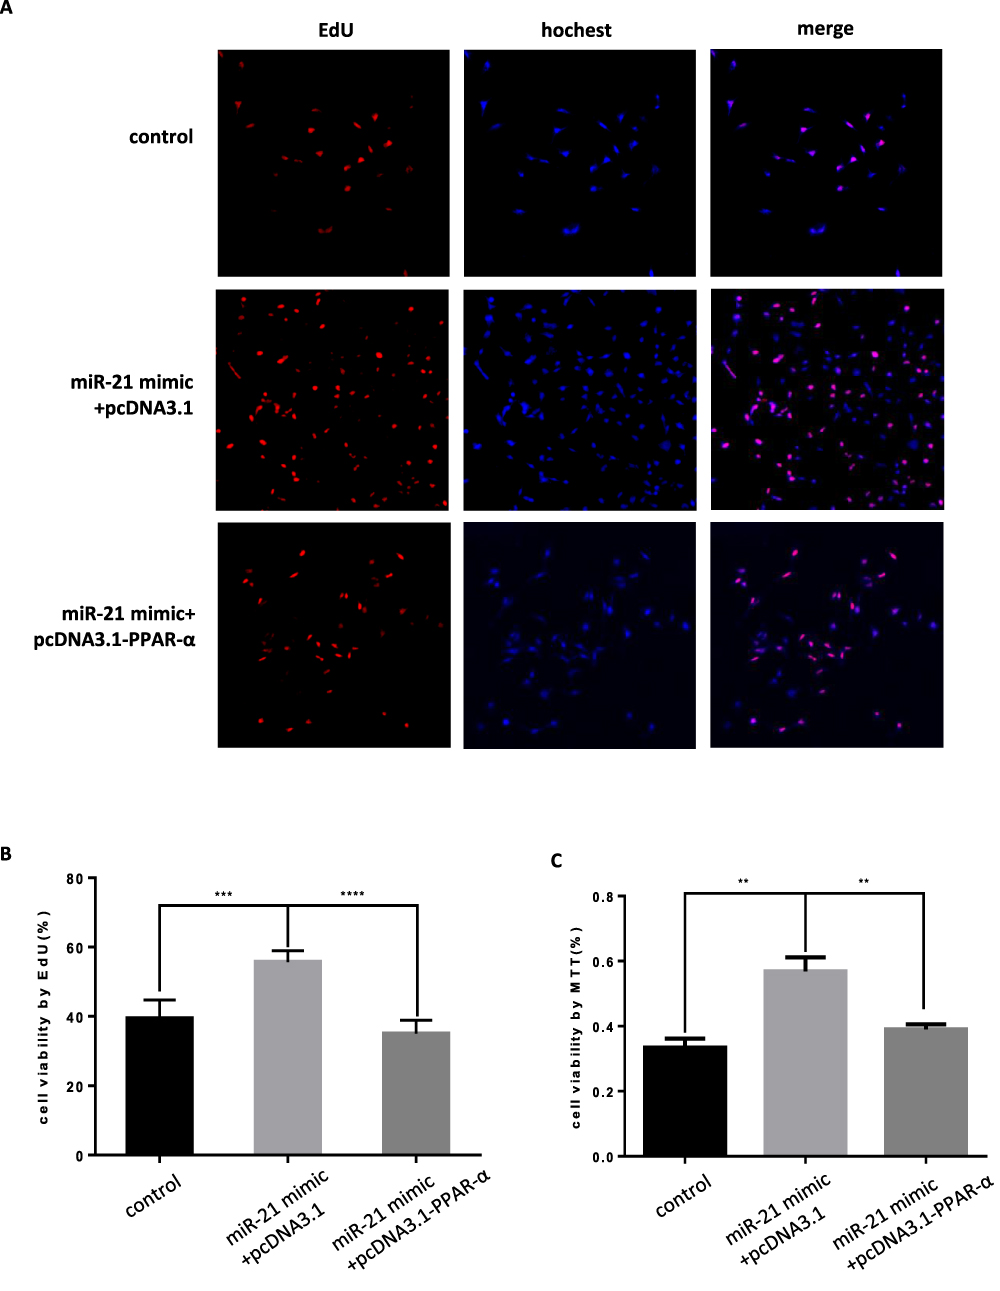 |
Figure 11 Co-transfection of PPAR-α expression vector and miR-21 mimics into cells, the effect on cell proliferation (A) Cell proliferation was detected by MTT assay. n = 3 per group. (B and C) Cell proliferation was detected by EdU assay. **P<0.01, ***P<0.001, ****P<0.0001. |
 |
Figure 12 Co-transfection of PPAR-α expression vector and miR-21 mimics into cells, the effect on cell migration (A and B) Cell migration in cell lines was detected by transwell migration assay. n = 3 per group. **P<0.01. |
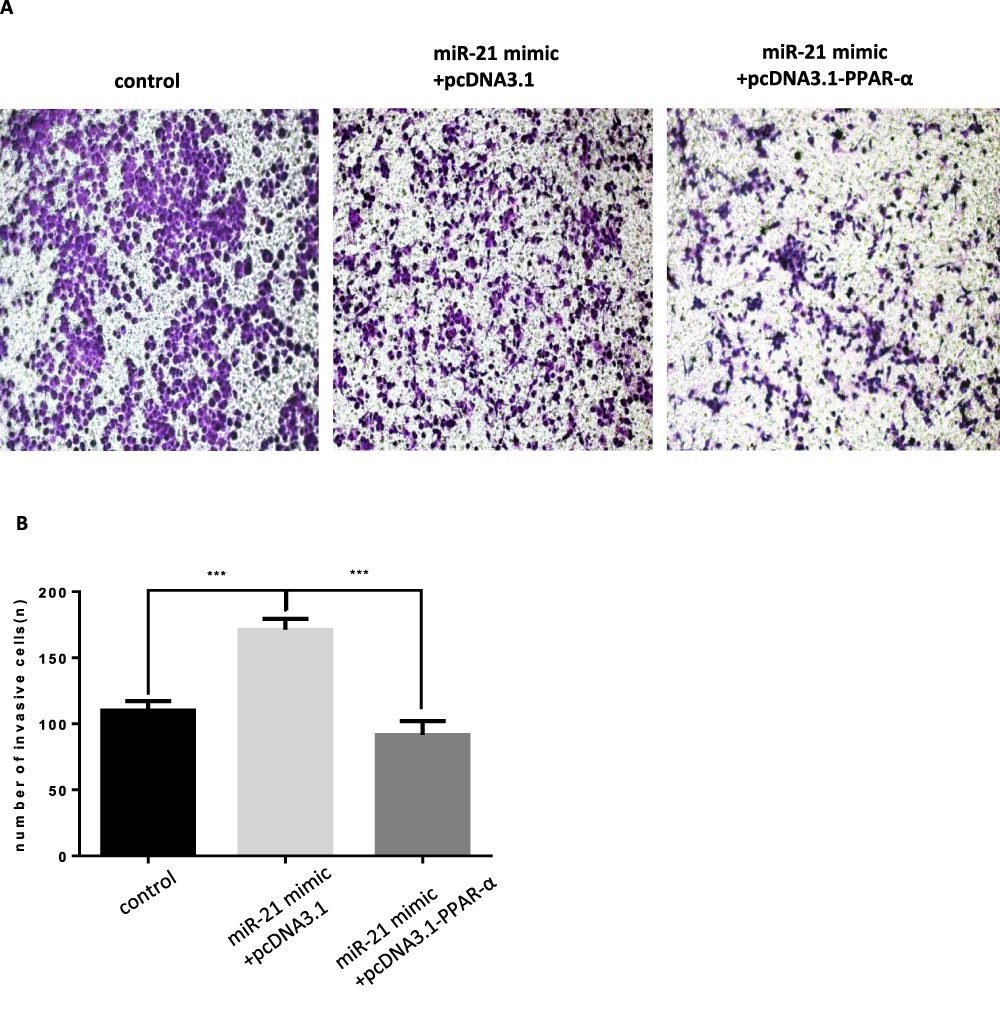 |
Figure 13 Co-transfection of PPAR-α expression vector and miR-21 mimics into cells, the effect on cell infiltration (A and B) Cell infiltration in cell lines was detected by transwell invasion assay. n = 3 per group. ***P<0.001. |
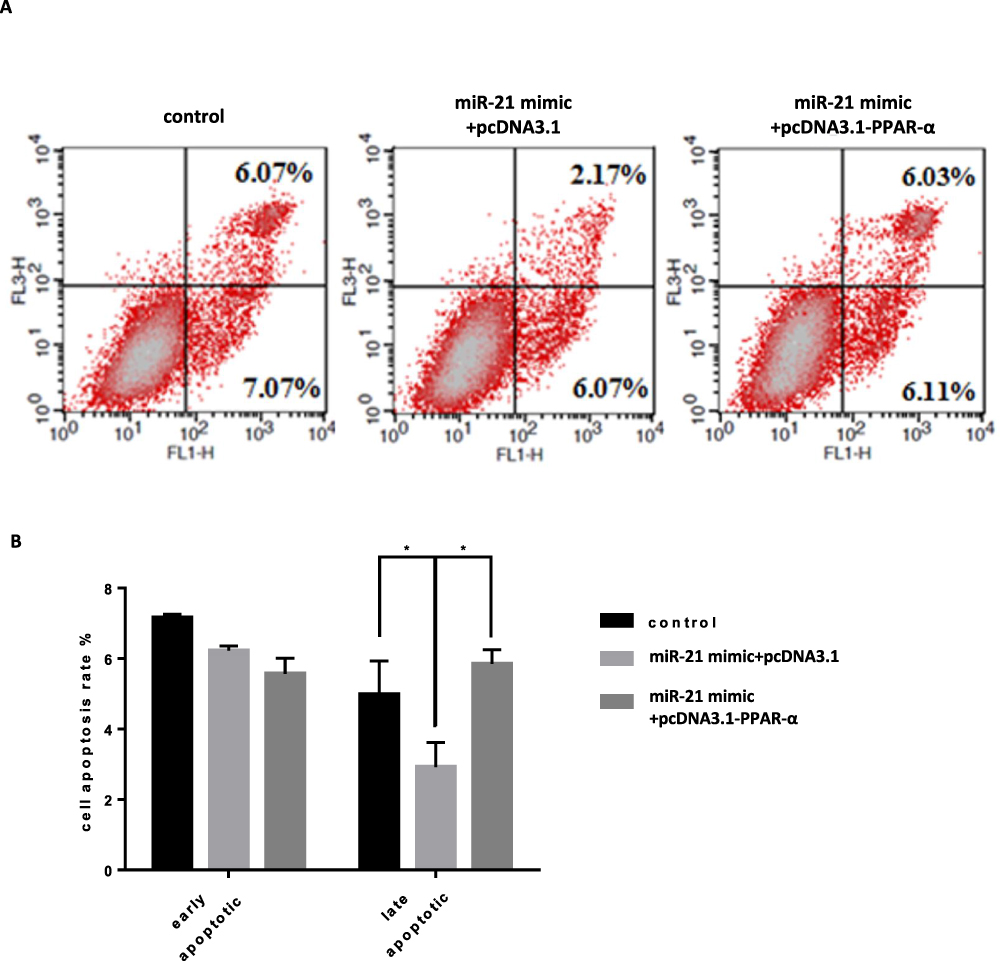 |
Figure 14 Co-transfection of PPAR-α expression vector and miR-21 mimics into cells, the effect on cell apoptosis (A and B) Cell apoptosis in cell lines was detected by flow cytometry. n = 3 per group. *P<0.05. |
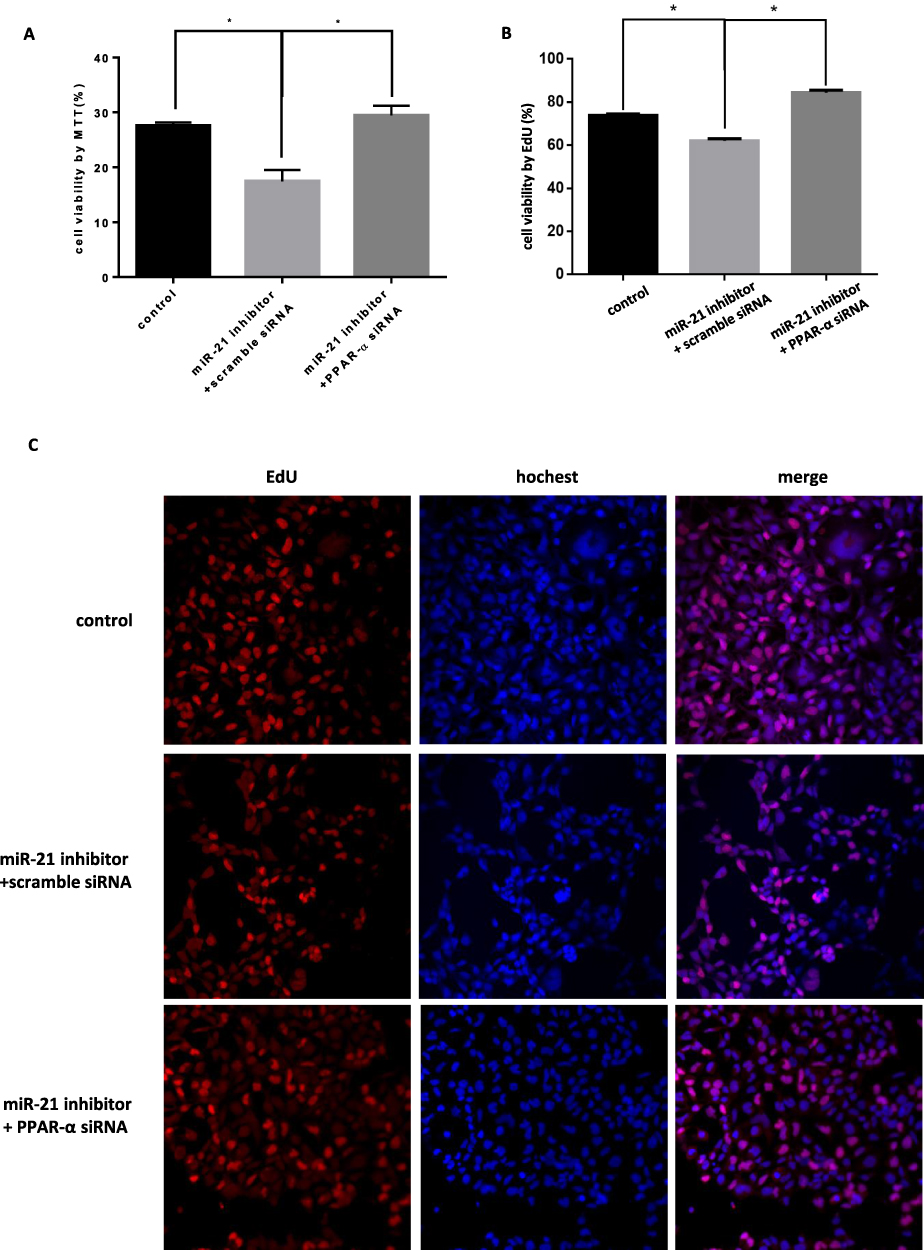 |
Figure 15 Co-transfection of PPAR-α siRNA and miR-21 inhibitor into cells, the effect on cell proliferation (A) Cell proliferation was detected by MTT assay. n = 3 per group. (B and C) Cell proliferation was detected by EdU assay. *P<0.05. |
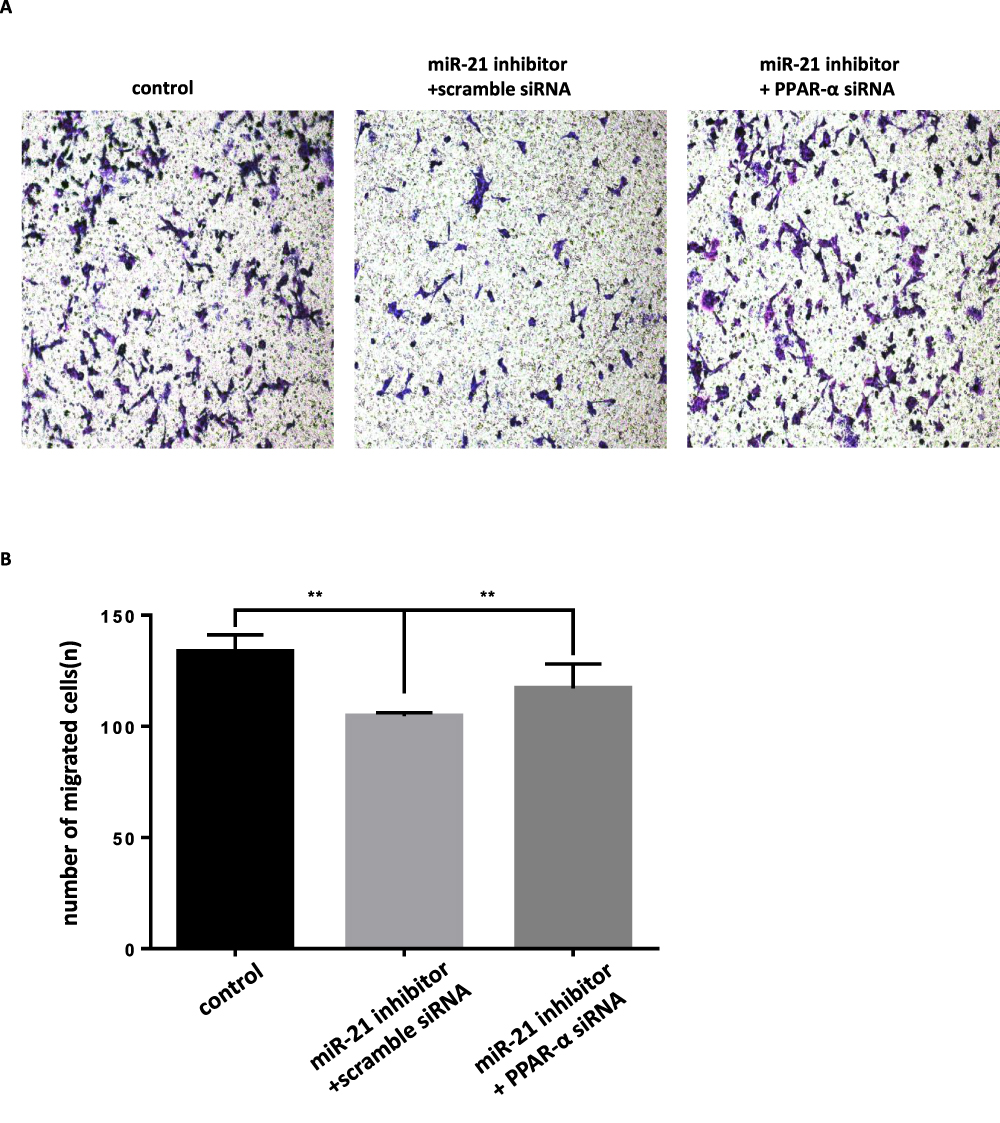 |
Figure 16 Co-transfection of PPAR-α siRNA and miR-21 inhibitor into cells, the effect on cell migration (A and B) Cell migration in cell lines was detected by transwell migration assay. n = 3 per group. **P<0.01. |
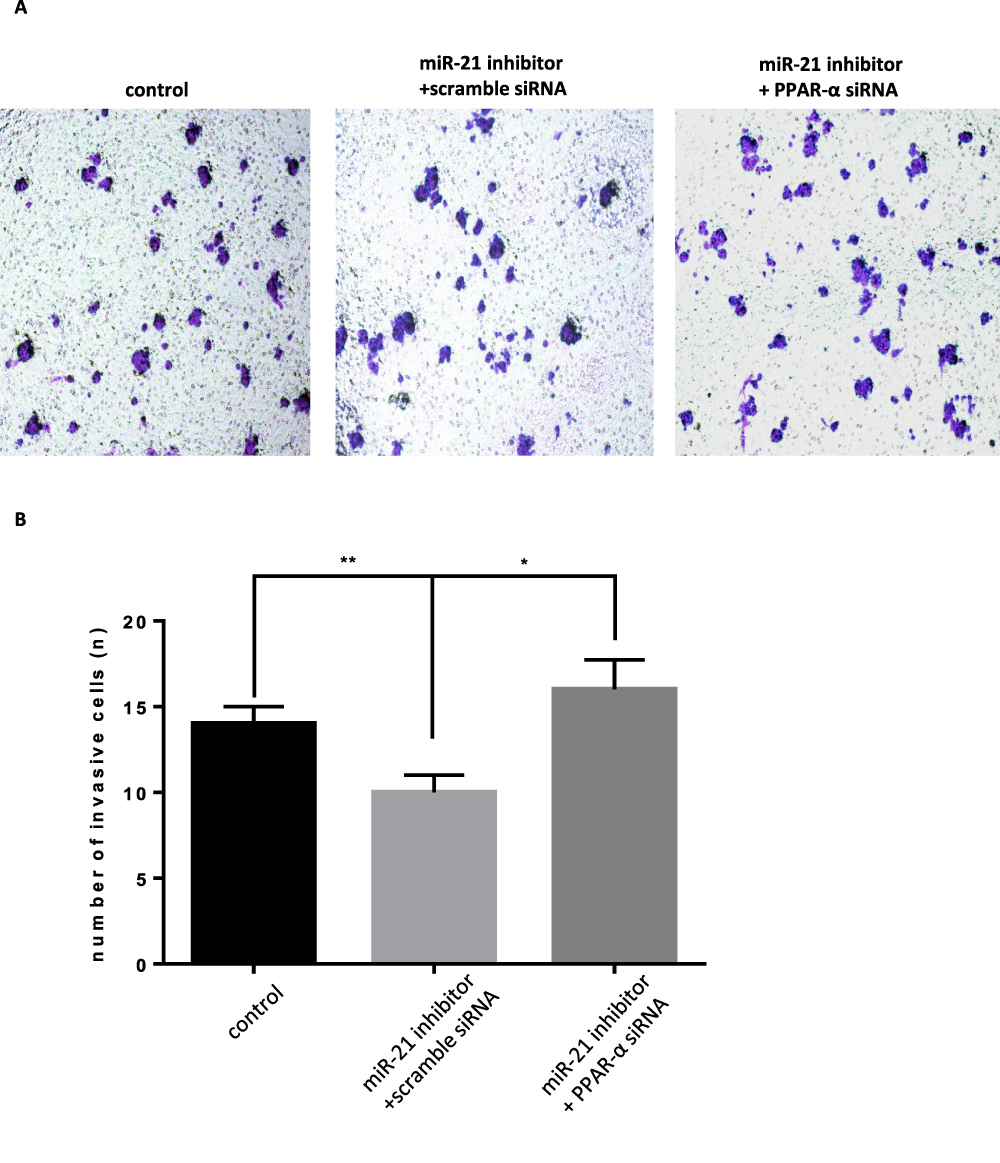 |
Figure 17 Co-transfection of PPAR-α siRNA and miR-21 inhibitor into cells, the effect on cell infiltration (A and B) Cell infiltration in cell lines was detected by transwell invasion assay. n = 3 per group. *P<0.05, **P<0.01. |
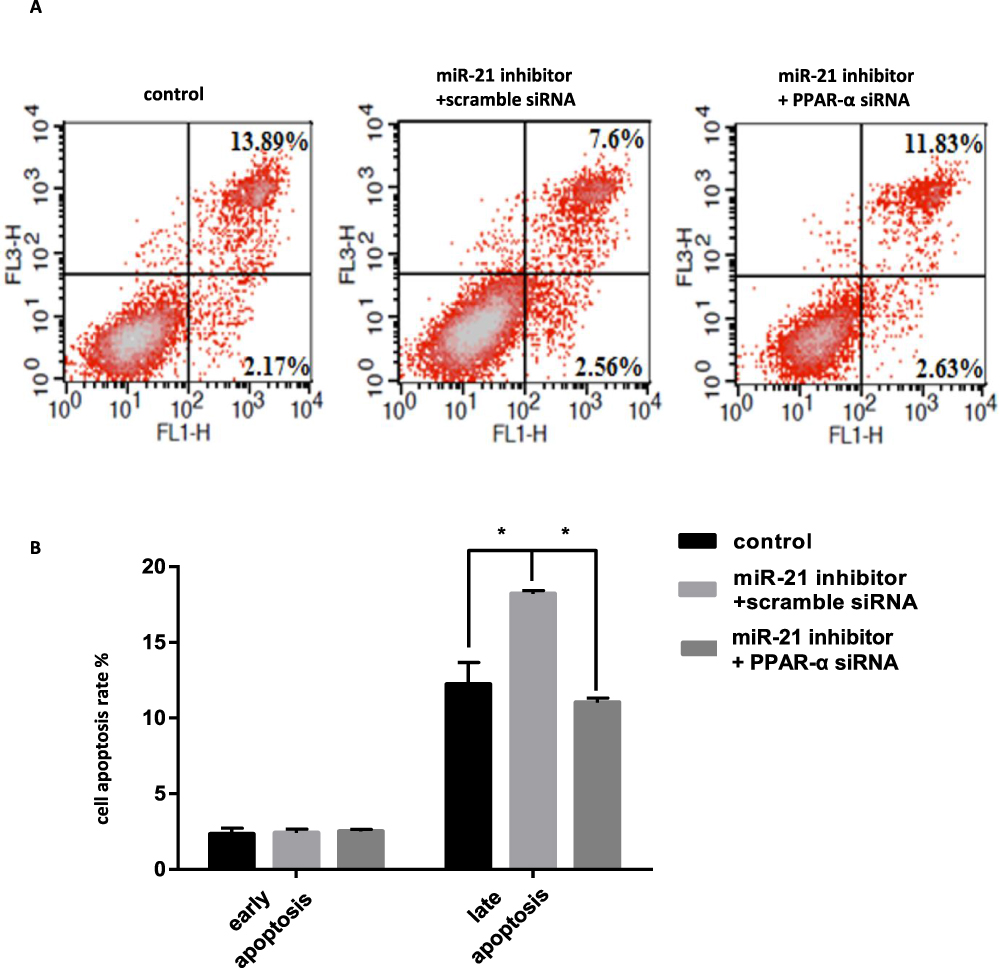 |
Figure 18 Co-transfection of PPAR-α siRNA and miR-21 inhibitor into cells, the effect on cell apoptosis (A and B) Cell apoptosis in cell lines was detected by flow cytometry. n = 3 per group. *P<0.05. |
Discussion
In recent years, an increasing number of studies have shown that miRNAs, such as miR-132,18 miR-770-5p,19 and miR-19a,20 are related to diabetes. Among them, miR-21, as an important molecule related to tumors18 and fat metabolism,21 has also attracted much attention. In this study, we found that the expression of miR-21 in the serum of GDM patients was lower than that in healthy pregnant women, suggesting that miR-21 may be an indicator of the development of GDM. Next, we studied whether the expression of miR-21 associated with blood glucose concentration in the GDM rat model. Considering that STZ in rats can produce severe diabetes (blood glucose exceeding 16 mmol/l)22–24 or mild diabetes (blood glucose of 7–16 mmol/l),25,26 STZ (40–50 mg/kg body weight) given intravenously or intraperitoneally in rats can induce severe diabetes.27 According to the literature and our preliminary results, we selected 3560 mg/kg STZ to induce moderate and severe GDM, respectively. We found that the expression of miR-21 in the placenta was related to the blood glucose concentration in the GDM rat model. The expression of miR-21 decreased with an increase in the blood glucose concentration, showing a significant correlation. This result suggests that miR-21 may be related to the cause of GDM.
To examine the correlation between miR-21 and GDM pathogenesis, we mapped the villous trophoblast cells with high miR-21 expression in the placenta by in situ hybridization. Since insulin resistance has long been considered the key to the development of gestational diabetes,28,29 a model of insulin resistance induced by a high-fat environment was constructed. It has been reported in the literature that saturated fatty acids in the human body are mostly composed of palmitic acid,30 and palmitate reduction stimulates phosphorylation of Akt Ser473 to regulate insulin activity; therefore, palmitic acid was selected as an induction reagent in a high-fat environment. In this experiment, by detecting glucose uptake and total cell sugar content, it was found that under normal conditions, miR-21 overexpression promoted glucose uptake and increased the total glucose content in the cells; however, insulin treatment significantly inhibited the increase in miR-21 overexpression. Although the glucose uptake increased, but miR-21 overexpression had no significant effect on glucose uptake in case of insulin resistance. In normal and insulin-treated conditions, miR-21 knockdown had no significant effect on glucose uptake, but it significantly promoted glucose uptake in case of insulin resistance. Based on these findings, we hypothesized that there are two possible cases when GDM occurs: one, the placental trophoblast cells do not have insulin resistance and low expression of miR-21 has no significant effect on glucose absorption; second, insulin resistance occurs in the placental trophoblast cells and low expression of miR-21 prevents the development of insulin resistance. Either speculation suggests that miR-21 may not affect the occurrence of GDM by regulating glucose uptake.
To determine the role of miR-21 during GDM occurrence, we determined the effect of miR-21 on cell proliferation, migration, infiltration, and apoptosis. We found that miR-21 promotes cell proliferation, migration, invasion, and inhibition of apoptosis. As reported in several studies, the function of miR-21 in tumor cells is consistent.31–34 Therefore, low expression of miR-21 in the placenta of gestational diabetes may protect and maintain the normal function of the placental tissue.
To investigate the possible mechanism of action of miR-21, we studied its target genes. Bioinformatic analysis showed that PPAR-α is a target gene of miR-21. PPARs are members of the nuclear receptor superfamily. PPAR-α regulates almost all forms of lipid metabolism, including the fatty acid uptake, mitochondrial and peroxisomal fatty acid oxidation, ketone synthesis, and formation and breakdown of triglycerides and lipid droplets that regulate fat metabolism. Regulation of inflammation and immune response are closely related to fat metabolism and fat accumulation in the liver.35,36 In this study, the luciferase reporter assays showed that miR-21 significantly inhibited the luciferase activity through two binding sites in the 3´-UTR of PPAR-α (P<0.05). The binding site mutant was used to prove that this site specifically binds to miR-21. The PPAR-α-pGLO vector is linked to the 3´-UTR of PPAR-α after the coding frame of the firefly luciferase; thus, when the seed sequence of miR-21 is combined with the 3´-UTR of PPAR-α, the translation of PPAR-α will be blocked, inhibiting the luciferase activity. When the 3′-UTR of PPAR-α recognizes the sequence of the miR-21 seed sequence mutation, it blocks the binding of miR-21 to the 3´-UTR of PPAR-α; thus, it has no significant effect on the luciferase activity. Transfection with the miR-21 mimic reduced the mRNA and protein levels of PPAR-α mRNA. This suggests that miR-21 is a potent regulator of lipid metabolism that acts by inhibiting the PPAR-α expression, and that low expression of miR-21 in the GDM patients may produce more PPAR-α for lipid metabolism.
To further verify that miR-21 functions through PPAR-α, we used target gene compensation experiments to analyze whether functional changes caused by aberrant expression of miR-21 can be restored by modulating its target gene PPAR-α. pcDNA3.1 is an integrated expression vector that can be used for gene over-expression analysis. We connected the coding frame of PPAR-α to pcDNA3.1 vector, a target gene compensation experiment. The overexpression of miR-21 inhibited the production of PPAR-α and promoted cell proliferation; the overexpression of pcDNA3.1-PPAR-α in the miR-21 overexpressing cell line inhibited the miR-21-mediated promotion of cell proliferation. Simultaneously, we used Western blotting and immunohistochemistry to detect the expression of PPAR-α in the placenta of GDM patients. It was found that PPAR-α localizes in the placental trophoblast cells and is significantly upregulated in the placental tissues of pregnant women aged 25–30 years. A trend toward the downregulated expression of miR-21 was consistent.
In summary, the expression of miR-21 in the placenta of pregnant GDM patients is downregulated, whereas that of PPAR-α is upregulated; this leads to the inhibition of cell growth and infiltration, thereby affecting placental function. This study not only reveals the role and mechanism of miR-21 in the placental cells in gestational diabetes from the perspective of miRNAs but may also suggest valuable molecular markers for the diagnosis or treatment of gestational diabetes.
Data Sharing Statement
All data included in this study are available upon request by contact with the corresponding authors Hongfei Xia and Xu Ma.
Disclosure
The authors report no conflicts of interest for this work.
References
1. Organization, WH. Diagnostic criteria and classification of hyperglycaemia first detected in pregnancy. World Health Organization. 2013.
2. Bevier WC, Jovanovic-Peterson L, Peterson CM. Pancreatic disorders of pregnancy. diagnosis, management, and outcome of gestational diabetes. Endocrinol Metab Clin North Am. 1995;24:103–138. doi:10.1016/S0889-8529(18)30055-0
3. Barbour LA, Mccurdy CE, Hernandez TL, Kirwan JP, Catalano PM, Friedman JE. Cellular mechanisms for insulin resistance in normal pregnancy and gestational diabetes. Diab Care. 2007;2:S112119. doi:10.2337/dc07-s202
4. Gare DJ. Hyperglycemia and adverse pregnancy outcomes — nejm. N Engl J Med. 2008;5:1991–2002.
5. Solomon CG. A prospective study of pregravid determinants of gestational diabetes mellitus. JAMA. 1997;278:1078. doi:10.1001/jama.1997.03550130052036
6. Flynt AS, Lai EC. Biological principles of microRNA-mediated regulation: shared themes amid diversity. Na .rev genet. 2008;9:831–842. doi:10.1038/nrg2455
7. van de Bunt M, Gaulton KJ, Parts L, et al. The miRNA profile of human pancreatic islets and beta cells and relationship to type 2 dia betes pathogenesis. PLoS One. 2013;8(1):e55272. doi:10.1371/journal.pone.0055272
8. Dou L, Wang S, Sun L, et al. Mir-338-3p mediates Tnf-A-induced hepatic insulin resistance by targeting PP4r1 to regulate PP4 expression. Cellular Physiol Biochem. 2017;41(6):2419–2431. doi:10.1159/000475912
9. Wu L, Wang Q, Guo F, et al. MicroRNA-27a induces mesangial cell injury by targeting of PPARY, and its in vivo knockdown prevents progression of diabetic nephropathy. Sci Rep. 2016;6(17):1–12. doi:10.1038/s41598-016-0001-8
10. Chakraborty C, George PDC, Bandyopadhyay S. miRNAs in insulin resistance and diabetes-associated pancreatic cancer: the ‘minute and miracle’ molecule moving as a monitor in the ‘genomic galaxy’. Curr Drug Targets. 2013;14(10):1110–1117. doi:10.2174/13894501113149990182
11. Zhong X, Chung AC, Chen HY, et al. miR-21 is a key therapeutic target for renal injury in a mouse model of type 2 diabetes. Diabetologia. 2013;56(3):663–674. doi:10.1007/s00125-012-2804-x
12. Tomécarneiro J, Larrosa M, Yáñezgascón MJ, et al. One-year supplementation with a grape extract containing resveratrol modulates inflammatory-related microRNAs and cytokines expression in peripheral blood mononuclear cells of type 2 diabetes and hypertensive patients with coronary artery disease. Pharmacol Res. 2013;72(3):69–82. doi:10.1016/j.phrs.2013.03.011
13. Issemann I, Green S. Activation of a member of the steroid hormone receptor superfamily by peroxisome proliferators. Nature. 1990;347(6294):645–650. doi:10.1038/347645a0
14. Saez E, Olson P, Evans RM. Genetic deficiency in Pparg does not alter development of experimental prostate cancer. Nat Med. 2003;9(10):1265–1266. doi:10.1038/nm928
15. Barak Y, Liao D, He W, et al. Effects of peroxisome proliferator-activated receptor?On placentation, adiposity, and colorectal cancer. Proc Nat Acad Sci. 2002;99(1):303–308. doi:10.1073/pnas.012610299
16. Bogacka I, Kurzynska A, Bogacki M, et al. Peroxisome proliferator-activated receptors in the regulation of female reproductive functions. Folia Histochem Cytobiol. 2015;53(3):189–200. doi:10.5603/fhc.a2015.0023
17. Schaiff WT, Barak Y, Sadovsky Y, et al. The pleiotropic function of PPAR gamma in the placenta. Mol Cell Endocrinol. 2006;249(1/2):10–15. doi:10.1016/j.mce.2006.02.009
18. Zhou X, Xiang C, Zheng X, et al. miR-132 serves as a diagnostic biomarker in gestational diabetes mellitus and its regulatory effect on trophoblast cell viability. Diagn Pathol. 2019;14(1):119. doi:10.1186/s13000-019-0899-9
19. Zhang YL, Chen XQ. Dysregulation of microRNA-770-5p influences pancreatic-β-cell function by targeting TP53 regulated inhibitor of apoptosis 1 in gestational diabetes mellitus. Eur Rev Med Pharmacol Sci. 2020;24(2):793–801. doi:10.26355/eurrev_202001_20062
20. Wang F, Zhang X, Zhou H, et al. Role of cell free microRNA-19a and microRNA-19b in gestational diabetes mellitus patients. 3 Biotech. 2019;9(11):406. doi:10.1007/s13205-019-1952-9
21. Zhang N, Hu Z, Qiang Y, Zhu X. Circulating miR-130b- and miR-21- based diagnostic markers and therapeutic targets for hepatocellular carcinoma. Mol Genet Genomic Med. 2019;7(12):e1012. doi:10.1002/mgg3.1012
22. Gimadiev PP, Niiazov AR, Mukhin VE, Ogurtsov PP. The diagnostic importance of circulating microRNA for non-alcoholic fatty liver disease (review of literature). Klin Lab Diagn. 2019;64(12):723–729. doi:10.18821/0869-2084-2019-64-12-723-729
23. Rudge MVC, Damasceno DC, Volpato GT, Almeida FCG, Calderon IMP, Lemonica IP. Effect of Ginkgo biloba on the reproductive outcome and oxidative stress biomarkers of streptozotocin-induced diabetic rats. Brazilian J Med Biol Res. 2007;40(8):1095–1099. doi:10.1590/S0100-879X2006005000132
24. de Souza Mda S, Lima PHO, Sinzato YK, Rudge MVC, Pereira OCM, Damasceno DC. Effects of cigarette smoke exposure on pregnancy outcome and offspring of diabetic rats. Reprod Biomed Online. 2009;18(4):562–567. doi:10.1016/S1472-6483(10)60135-6
25. de Souza Mda S, Sinzato YK, Lima PHO, Calderon IMP, Rudge MVC, Damasceno DC. Oxidative stress status and lipid profiles of diabetic pregnant rats exposed to cigarette smoke. Reprod Biomed Online. 2010;20(4):547–552. doi:10.1016/j.rbmo.2010.01.002
26. Sinzato YK, Lima PH, de Campos KE, Kiss ACI, Rudge MVC, Damascene DC. Neonatally-induced diabetes: lipid profile outcomes and oxidative stress status in adult rats. Rev Assoc Med Bras. 2009;55(4):384–388. doi:10.1590/S0104-42302009000400010
27. Damasceno DC, Kiss ACI, Sinzato YK, et al. Maternal-fetal outcome, lipid profile and oxidative stress of diabetic rats neonatally exposed to streptozotocin. Experimental and clinical. Endocrinol Diab. 2011;119(7):408–413.
28. D’Anna R, Baviera G, Cannata ML, DeVivo A, DiBenedetto A, Corrado F. Midtrimester amniotic fluid leptin and insulin levels and subsequent gestational diabetes. Gynecol Obstet Invest. 2007;64:65–68. doi:10.1159/000099149
29. Angerstein W. Insulin resistance: definition and consequences. Exp Clin Endocrinol Diab. 2001;109:S135S148. doi:10.1055/s-2001-18576
30. Mayer CM, Belsham DD. Palmitate attenuates insulin signaling and induces endoplasmic reticulum stress and apoptosis in hypothalamic neurons: rescue of resistance and apoptosis through adenosine 5′ monophosphate-activated protein kinase activation. Endocrinology. 2010;151:576–585. doi:10.1210/en.2009-1122
31. Gabriely G, Wurdinger T, Kesari S, et al. MicroRNA 21 promotes glioma invasion by targeting matrix metalloproteinase regulators. Mol Cell Biol. 2008;28:5369–5380. doi:10.1128/MCB.00479-08
32. Kim YJ, Hwang SH, Cho HH, Shin KK, Bae YC, Jung JS. MicroRNA 21 regulates the proliferation of human adipose tissue-derived mesenchymal stem cells and high-fat diet-induced obesity alters microRNA 21 expression in white adipose tissues. J Cell Physiol. 2012;227:183–193. doi:10.1002/jcp.22716
33. Sheedy FJ. Turning 21: induction of miR-21 as a key switch in the inflammatory response. Front Immunol. 2015;6:19. doi:10.3389/fimmu.2015.00019
34. Si M-L, Zhu S, Wu H, Lu Z, Wu F. MiR-21 mediated tumor growth. Oncogene. 2007;26:2799–2803. doi:10.1038/sj.onc.1210083
35. Tai ES, Demissie S, Cupples LA, et al. Association between the PPAR-α L162V polymorphism and plasma lipid levels: the framingham offspring study. Arterioscler Thromb Vasc Biol. 2002;22(5):805–810. doi:10.1161/01.ATV.0000012302.11991.42
36. Janssen AW, Betzel B, Stoopen G, et al. The impact of PPARα activation on whole genome gene expression in human precision cut liver slices. Bmc Genomics. 2015;16:760. doi:10.1186/s12864-015-1969-3
 © 2020 The Author(s). This work is published and licensed by Dove Medical Press Limited. The
full terms of this license are available at https://www.dovepress.com/terms
and incorporate the Creative Commons Attribution
- Non Commercial (unported, 3.0) License.
By accessing the work you hereby accept the Terms. Non-commercial uses of the work are permitted
without any further permission from Dove Medical Press Limited, provided the work is properly
attributed. For permission for commercial use of this work, please see paragraphs 4.2 and 5 of our Terms.
© 2020 The Author(s). This work is published and licensed by Dove Medical Press Limited. The
full terms of this license are available at https://www.dovepress.com/terms
and incorporate the Creative Commons Attribution
- Non Commercial (unported, 3.0) License.
By accessing the work you hereby accept the Terms. Non-commercial uses of the work are permitted
without any further permission from Dove Medical Press Limited, provided the work is properly
attributed. For permission for commercial use of this work, please see paragraphs 4.2 and 5 of our Terms.