")
Back to Journals » Clinical Interventions in Aging » Volume 10
Dosing of U-100 insulin and associated outcomes among Medicare enrollees with type 1 or type 2 diabetes
Authors Eby E, Van Brunt K, Brusko C, Curtis B, Lage M
Received 9 December 2014
Accepted for publication 16 February 2015
Published 17 June 2015 Volume 2015:10 Pages 991—1001
DOI https://doi.org/10.2147/CIA.S76398
Checked for plagiarism Yes
Review by Single anonymous peer review
Peer reviewer comments 3
Editor who approved publication: Dr Richard Walker
Elizabeth L Eby,1 Kate Van Brunt,2 Cynthia Brusko,3 Bradley Curtis,4 Maureen J Lage5
1Global Patient Outcomes and Real World Evidence, Eli Lilly and Co., Indianapolis IN USA; 2Eli Lilly and Co., Windlesham, UK; 3Lilly USA, LLC, Indianapolis, IN, USA; 4Eli Lilly and Co., Indianapolis, IN, USA; 5HealthMetrics Outcomes Research, LLC, Bonita Springs, FL, USA
Objective: To examine costs, resource utilization, adherence, and hypoglycemic events among various doses of U-100 insulin regimens among elderly patients (age ≥65 years) diagnosed with diabetes.
Methods: Truven Health Analytics Medicare databases from January 1, 2008 through December 31, 2011 were utilized. General linear models with a gamma distribution and log link were used to examine costs, while logistic and negative binomial regressions were used to examine resource utilization and hypoglycemic events. Analyses controlled for patient characteristics, pre-period comorbidities, general health, and use of antidiabetic medications as well as index dose of insulin.
Results: All-cause inpatient, emergency room, and outpatients costs, as well as diabetes-related inpatient costs, were highest among individuals who were treated with an index dose of 10–100 units/day followed by >300 units/day, while drug costs and total costs generally increased as index dosage increased. Resource utilization generally followed the same pattern as costs, with number of office visits increasing as the dose increased and the highest hospital length of stay, number of hospitalizations, number of emergency room visits, and number of diabetes-related hospitalizations were generally highest among those in the lowest and highest index dose cohorts. Compared to patients who initiated with an index dose of 10–100 units/day, all other patients were significantly less likely to achieve an adherence threshold of 80% based upon index dose range, and while those with an index dose of >100–150 units/day were significantly more likely to experience a hypoglycemic event.
Conclusion: These results suggest that, for elderly individuals with diabetes, there is a higher patient burden among those who receive the lowest and highest insulin doses.
Keywords: insulin, diabetes, costs, resource utilization, adherence, hypoglycemia
Introduction
The US population is aging at a faster rate than at any other time in the history of the United States,1 with one projection estimating that the number of Americans aged 65 years and older will be more than double – from 47.7 to 97.1 million persons – between the years 2015 and 2060.2 Increasing age is a non-modifiable risk factor for type 2 diabetes mellitus (T2DM),3 which accounts for 90%–95% of all diabetes cases,4 and the aging of the population is a major driver of the Nation’s growing diabetes epidemic.5 As of 2012, one in four Americans 65 years of age or older has diabetes, compared to approximately one in eight among US adults overall (25.9% vs 12.3%),4 and the prevalence of the disease among elderly individuals is increasing.6 Elderly persons with diabetes have greater disability, a higher burden of illness, and a greater risk of institutionalization relative to their counterparts without the disease,5,7 and among Americans with diabetes, elderly patients have significantly higher rates of diabetes-related resource use, costs, and death.8 The average, annual, excess expenditures related to diabetes are approximately three times as high for an elderly patient relative to a patient under 45 years of age (US$11,825 vs $4,394), and approximately twice as high relative to an individual 45–64 years of age ($11,825 vs $5,611).9
The American Diabetes Association has stated that a fasting plasma glucose ≥126 mg/dL or an HbA1c ≥6.5% indicates a diagnosis of diabetes,10 and suggests that many non-pregnant adults should target HbA1c <7% to reduce microvascular complications associated with diabetes.10 However, they also state that a less stringent target, such as <8%, may be more appropriate for elderly individuals.10 Individuals diagnosed with type 1 diabetes mellitus (T1DM) require treatment with insulin to lower their blood glucose to target, because they are unable to produce insulin on their own.11 Elderly patients with T2DM also often require insulin, due either to the progressive nature of T2DM12,13 or to age-related renal impairment that precludes the use of some oral antidiabetic (OAD) drugs.12
However, treatment of elderly individuals with insulin is complicated by age-related factors which affect glucose metabolism. Elderly patients often have increased insulin resistance and poor β-cell function. In addition, elderly individuals have changes in body composition such as a larger proportion of adipose tissue and reduced muscle mass.14 Elderly patients often have changes in meal times, meal composition, and amount of food consumed.14 This population is also more likely to have comorbid conditions or use medications that impair insulin sensitivity, release, or action.14 Furthermore, impaired cognitive function among elderly individuals may result in poor adherence to treatment, resulting in worse glycemic control and an increased risk of hypoglycemia.15
Given the many complexities surrounding insulin treatment among elderly patients with diabetes, as well as the high costs associated with treatment for this subgroup, the present study sought to explore associations between insulin dose and outcomes among a population of Americans 65 years of age and older. This retrospective investigation used records from a US-wide commercial insurance database to examine the dosing of insulin among patients with T1DM or T2DM with coverage by Medicare, the agency that provides most of the diabetes care for elderly US adults.8 Total and component medical costs, medical resource use, patient adherence, and the likelihood of a hypoglycemic event were examined for associations with insulin dose.
Methods
The Truven Health Analytics Marketscan® Medicare Supplemental and Coordination of Benefits database provided the data used in this retrospective analysis. Encompassing a geographically diverse population of Americans 65 years of age and older, the Medicare Supplemental and Coordination of Benefits database contains patients’ demographics and enrollment as well as inpatient, outpatient, and prescription drug claims. The study data spanned the time period from January 1, 2008 through December 31, 2011. All data were fully compliant with the Health Insurance Portability and Accountability Act (HIPAA).
This study examined the associations between a patient’s highest daily mean dose of insulin over 90 days and direct medical costs, resource utilization, adherence, and probability of a hypoglycemic event. The highest mean daily dose over a 90-day period was defined as the “index dose range” and was calculated based upon the quantity of insulin received over a 90-day period and the number of days of insulin covered under prescription. The insulin was from pens or vials that contained 100 units of insulin/mL (U-100), which is the standard strength of non-concentrated insulin distributed in the United States,16–18 and the total daily dose encompassed basal, bolus, or premixed formulations. The date of the first prescription for insulin within the index dose range was identified as the “index date”. Patients with a highest mean daily dose of <10 units/day or >2,500 units/day were excluded from the analysis.
Patients were required to have received at least two diagnoses of type 1 or type 2 diabetes (ICD-9-CM code of 250.xx) over the time period from 6 months prior to the index date (eg, the pre-period) through 12 months post-index date (eg, the post-period), to be at least 65 years as of the index date, and to have had continuous insurance coverage from the start of the pre-period through the end of the post-period. Finally, given the requirement of a 1-year pre-period and 1-year post-period and a database that spanned the years 2008–2011, the index date was required to be between January 1, 2009 and January 1, 2011. These inclusion/exclusion criteria yielded a sample of 48,173 individuals.
Medical costs for these analyses were proxied by total gross payments to providers who submitted claims for covered services rendered and were inflated to 2011 dollars using the medical component of the consumer price index.19 Costs were also categorized as all-cause or diabetes-related if they had an accompanying diagnosis of 250.xx or were for the receipt of antidiabetic medication or diabetic supplies. Within these two groupings, costs were subdivided into inpatient, emergency room (ER), outpatient, and drug costs. Resource utilization included hospital length of stay, number of hospitalizations, ER visits, and office visits. Hospitalizations were categorized as either all-cause or diabetes-related (ie, having an accompanying diagnosis of diabetes). Adherence was proxied by the proportion of days covered (PDC), defined as the percentage of unique days in the post-period where the individual received insulin at their index dose range or higher. Finally, hypoglycemia was captured by receipt of a diagnosis for the condition (ICD-9-CM codes of 251.0x–251.2x; 270.3x, 775.0x, 775.6x, or 962.3x).
Multivariable analyses were used to examine the relationship between the outcomes of interest and index insulin dosage. All analyses controlled for the individual patient’s characteristics (age, sex, region of residence, insurance coverage, and type of diabetes), pre-period general health status, comorbidities, antidiabetic medication use, and resource use. General health was proxied by the Charlson Comorbidity Index (CCI).20,21 Pre-period comorbid diagnoses of interest included retinopathy, nephropathy, neuropathy, coronary artery disease, peripheral vascular disease, coronary heart disease, hypertension, depression, obesity, and malignancy. Medication use during the pre-period encompassed any prescription that was filled for an OAD agent, a non-insulin injectable, or an insulin pen, pump, or vial. An indicator variable for visits to an endocrinologist in the pre-period was also included.
Means and standard deviations for continuous variables and frequencies and percentages for categorical variables (ie, descriptive statistics) were used to characterize the sample. T-statistics and chi-square statistics were used to test for statistically significant differences between the cohorts. General linear models with a gamma distribution and log link were used to examine the costs. Two-part models were used to examine inpatient and ER costs, where the first part captured the probability of using the service and the second part estimated the costs among users of the service. Resource utilization was examined by estimating negative binomial regression, while logistic regressions analyzed the likelihood of achieving a PDC threshold of ≥80% or a hypoglycemic event. All analyses were conducted using SAS, version 9.3. A P-value of <0.05 was considered to be statistically significant.
Results
Table 1 presents patient characteristics based upon index dose. Results revealed that as the dose increased, the mean age of the patient decreased and the percentage of males increased. In addition, as the index dose increased, patients’ overall health generally worsened, as evidenced by the higher mean Charlson score and the greater percentage of individuals diagnosed with neuropathy, coronary artery disease, or obesity. Patients with a higher index dose were also generally more likely to have visited an endocrinologist in the pre-period and to have point-of-service insurance. Patients with the lowest index dose were found to have the highest rates of depression and malignancy in the pre-period. Finally, patients treated with the highest or lowest dosage of insulin were least likely to be identified as having T1DM.
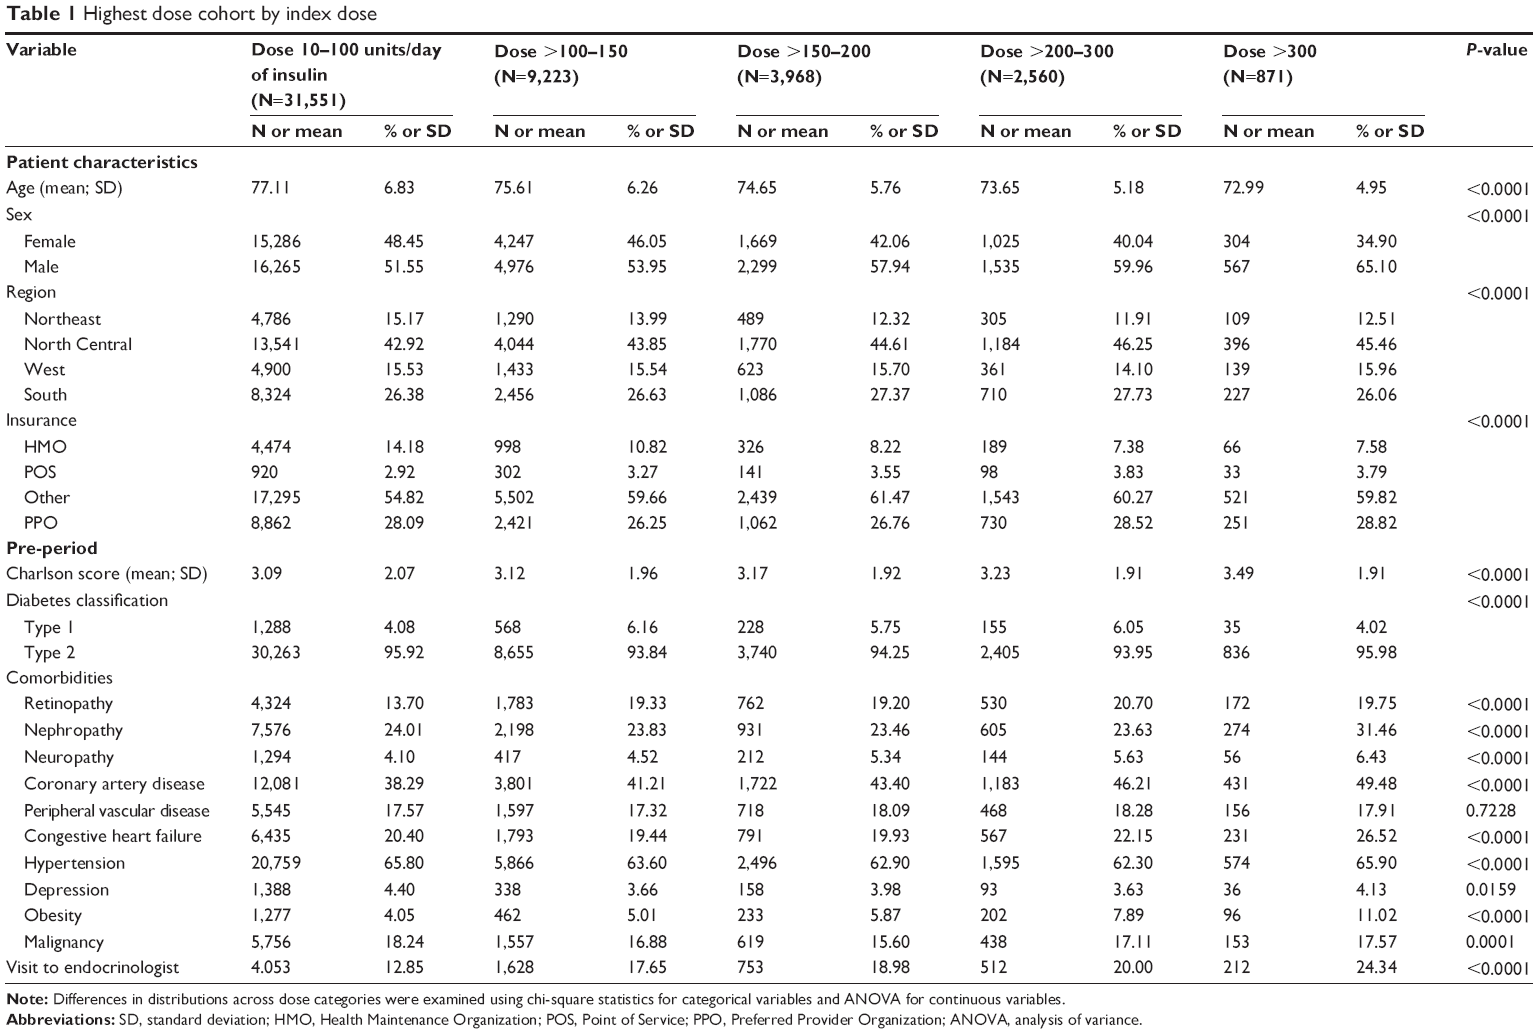 | Table 1 Highest dose cohort by index dose |
Table 2 reveals antidiabetic medication use, based upon index dose, both at the index date and during the pre-period. As index dosage increased, patients during the post-period were more likely to be prescribed a basal and bolus insulin, a basal and premix insulin, a bolus and premix, or a basal and bolus and premix concurrently, but were less likely to be prescribed only basal or only bolus insulin. Similarly, in the pre-period, increases in index dosage were associated with greater use of insulin in general, more use of basal, bolus, or analog insulin in particular, higher likelihood of using insulin delivered via pen or vial, greater likelihood of using an injectable other than insulin (ie, a glucagon-like peptide-1 or an amylin agonist), and an increased likelihood of using any type of antidiabetic medication. However, as the index dose increased, individuals became less likely to have been prescribed an OAD or a non-insulin injectable (glucagon-like peptide-1 analogues and amylin analogues) during the pre-period.
 | Table 2 Highest dose cohort antidiabetic medication use – by insulin dosage |
Table 3 focuses on the association between the index dose and total direct medical costs. Results revealed that as the index dosage increased, both all-cause and diabetes-related drug costs and diabetes-related total costs increased. All-cause and diabetes-related ER costs were highest among the lowest dose patients. All-cause and diabetes-related inpatient and all-cause outpatient costs were highest among the lowest and highest dose cohorts. Overall, non-drug costs constituted a larger share of total medical costs in the lower dose cohorts. For example, among individuals with an index dose of 10–100 units of insulin/day, non-drug costs accounted for 79.54% of direct medical costs and 73.99% of direct diabetes-related medical costs. In contrast, among individuals with an index dose >300 units of insulin/day, non-drug costs accounted for 61.76% of direct medical costs and 39.91% of direct diabetes-related medical costs.
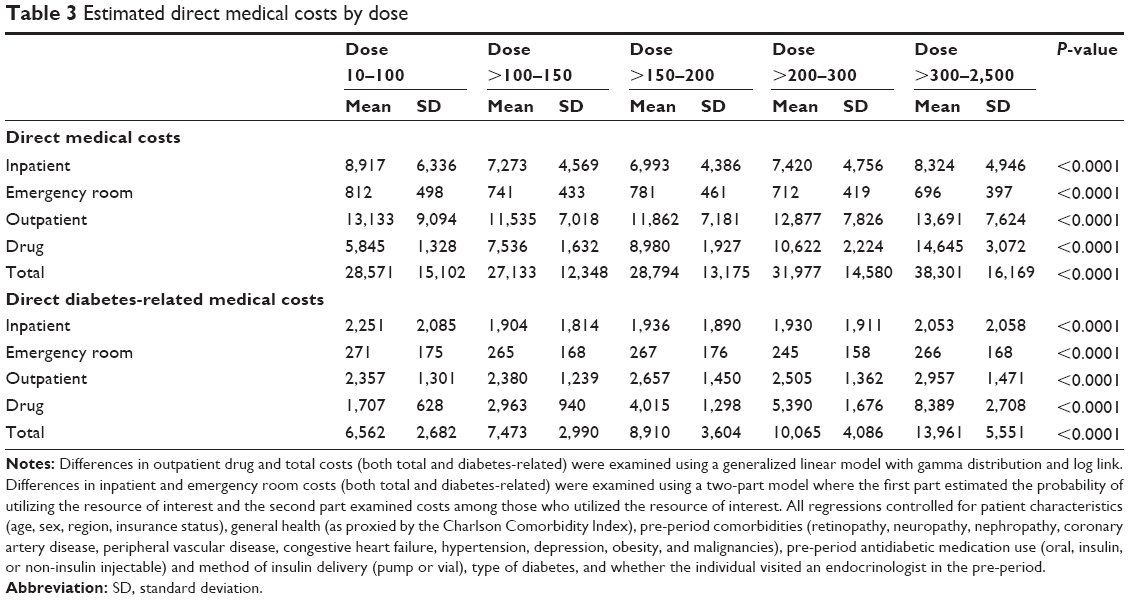 | Table 3 Estimated direct medical costs by dose |
Table 4 examines the differences in resource utilization associated with index insulin use. In general, these results are consistent with the cost results presented in Table 3. For example, the lowest dose cohort had the highest number of ER visits. The lowest and highest dose cohorts had the longest mean hospital length of stay for any cause or for a diabetes-related cause, as well as the largest mean number of any-cause hospitalizations.
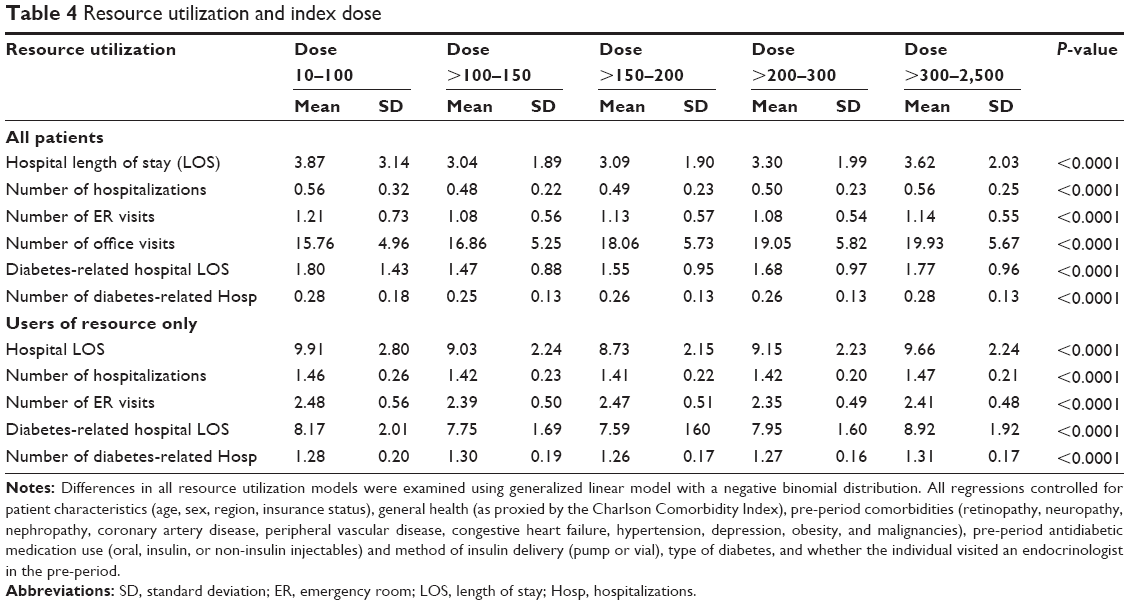 | Table 4 Resource utilization and index dose |
Finally, Figures 1 and 2 examine the probability of achieving a PDC threshold of at least 80% or having a hypoglycemic event in the post-period. Results revealed that compared to patients with an index dose of 10–100 units/day, patients who received a higher index dose were significantly less likely to achieve a PDC threshold of at least 80%. However, among patients prescribed >100 units of insulin/day, there was little difference in the likelihood of achieving the PDC threshold. For example, patients with an index dose >150–200 units/day had a 95% reduction in the likelihood of achieving a threshold of 80% (odds ratio =0.047; 95% confidence interval [CI] 0.037–0.057), while those with an index dose >200–300 units/day were 94% less likely to achieve this threshold (odds ratio =0.056; 95% CI 0.044–0.071). Figure 2 illustrates that there was little association between index insulin dose and probability of a hypoglycemic event in the post-period, with one exception: patients with an index dose >100–150 units/day were significantly more likely to have had a hypoglycemic event (odds ratio =1.171; 95% CI 1.050–1.307) compared to patients with an index dose of <100 units/day.
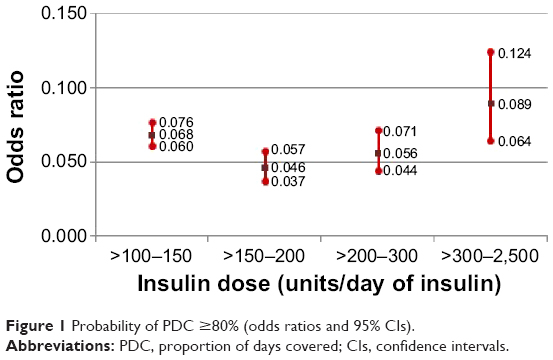 | Figure 1 Probability of PDC ≥80% (odds ratios and 95% CIs). |
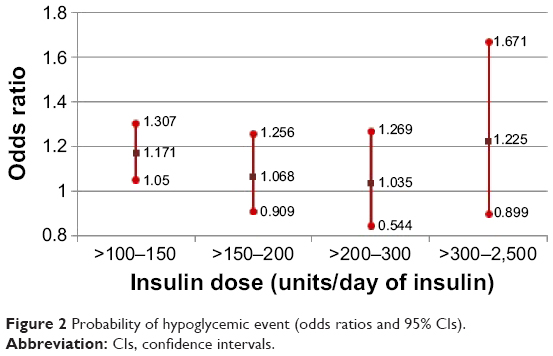 | Figure 2 Probability of hypoglycemic event (odds ratios and 95% CIs). |
Discussion
In 2012, persons 65 years of age or older were responsible for 59% of all diabetes-related expenditures in the United States, as well as the majority of diabetes-related resource use, including hospital inpatient days (63%), nursing/residential facility days (80%), hospice days (91%), outpatient physician visits (57%), and drug prescriptions (60%).9 To add to the current knowledge about this costly subgroup of patients, the present study examined the associations between insulin dosing and descriptive statistics, including age, sex, and general health, among a sample of patients 65 years of age or older with either T1DM or T2DM. In addition, this investigation looked at the connections between dosing and outcomes, including costs, resource use, hypoglycemic events, and adherence. The main results of this study revealed significant links between insulin dosing and specific patient characteristics as well as between dosing and costs and resource use.
Sex, age, and insulin dosing
In this study, men tended to have higher index insulin doses than women, consistent with the fact that men are, on average, larger than women in any population,22 and that insulin dosing has been found to be positively correlated with body weight as well as significantly higher in males compared to females.23 Among this sample of elderly patients, increasing age was linked to lower insulin dose, a finding which reflects American Diabetes Association (ADA) and European Association for the Study of Diabetes (EASD) treatment guidelines, which state: “If lower targets cannot be achieved with simple interventions (among patients 65 years of age and older), an HbA1c of <7.5%–8.0% may be acceptable, transitioning upward as age increases and capacity for self-care, cognitive, psychological and economic status, and support systems decline”.24,25 Likewise, previous research has also found that insulin dose is negatively related to age.23 This finding is consistent with evidence that women live longer than men26 as well as with research that found that hypoglycemia rates have been increasing for the elderly,27 suggesting a potential benefit associated with lower dosing of insulin among the elderly.
Other medication use, insulin type, and insulin dosing
The descriptive statistics revealed that patients with T2DM were more likely to receive both the highest and lowest insulin dose ranges. The receipt of relatively low dosages of insulin is consistent with research that found that insulin used adjunctively with oral medications may require a lower dose relative to insulin monotherapy.28 Furthermore, this hypothesis is consistent with the finding that those in the lowest dose range were most likely to receive an OAD and received the highest mean number of OAD medications. The receipt of the highest doses of insulin among those with T2DM is consistent with previous research that has found patients with T2DM were 3.13 times more likely to be classified as obese compared to those with T1DM.29
General health and insulin dosing
As the index dose increased, the patients in this study tended to have more comorbid diagnoses and a higher likelihood of a diagnosis of neuropathy, coronary artery disease, or obesity. A seemingly contradictory finding was that a pre-period diagnosis of hypertension, depression, or malignancy was associated with the “lowest” index insulin dose. Although apparently at odds, these observations may be explained by earlier research which has characterized comorbidities among patients with diabetes as concordant, discordant, or dominant. Specifically, concordant comorbidities, such as cardiovascular disease, are illnesses which overlap with diabetes in their pathogenesis and management plans, while discordant comorbidities, such as mental illnesses, have unrelated pathogenesis and management plans.30 Dominant illnesses, such as cancer, are those illnesses whose severity eclipse all other illness management plans.30 Given that research has shown that concordant comorbidities are associated with better diabetes care, while discordant or dominant illnesses are associated with diminished diabetes care,31 the findings that depression and malignancy are associated with lower doses of insulin suggest that patients with these conditions may be undertreated with insulin.
Associations between dosages, costs, and resource use
The patients receiving the lowest dosages in this study had the greatest acute care (inpatient and ER) costs and acute care usage, including the highest number of ER visits, the largest all-cause ER costs, and the highest diabetes-related ER costs. In addition, the lowest dose cohort had the greatest all-cause and diabetes-related inpatient costs, the longest mean hospital length of stay for any cause or for a diabetes-related cause, and the largest mean number of any-cause hospitalizations. These outcomes indicate that the lowest dose cohort had poorly controlled diabetes, likely due to what has been defined as “clinical inertia”,32 meaning their treatment dosages were lower than needed for adequate control. Previous research has suggested that the knowledge and attitude of health care providers, as well as fear of hypoglycemia, may be reasons for such undertreatment.32 While there are potential benefits of lowering insulin doses, especially among the elderly, this research suggests that there are also potential costs in terms of increased hospitalization and ER visits.
Despite having the highest acute care use and costs, the lowest dose cohort had the lowest all-cause and diabetes-related drug and total costs. However, as it has been argued, it is important to distinguish between “expectable” and “unexpectable” medical costs in the treatment of any chronic disease.33 “Expectable” costs are those incurred to support comprehensive and continuous care and tend to reflect patients’ engagement in their treatment. Such costs often include routine outpatient care, various medical tests and supplies, and medications.33 In contrast, “unexpectable” costs are those incurred for acute or intensive care, such as ER services and hospitalization. Acute care use is often linked to poorer long-term treatment outcomes,34,35 and acute care has been shown to be avoidable through the use of appropriate expectable outpatient care.33,36 As the lowest dose cohort comprised a large majority of patients in the overall sample (32,325 out of 43,547), our findings indicate that the costs of the undertreatment of diabetes are experienced not only by the individual patient but also by the overall health care system, which must struggle to keep up with the unpredictable and intensive needs of these patients.
Finally, the highest dose patients had the largest total health care costs, due mostly to their very high drug costs. In addition, the highest dose cohort was second only to the lowest dose cohort in having the highest acute care use and costs. Since the highest dose patients had the greatest burden of comorbid diagnoses, as well as a higher likelihood of having neuropathy, coronary artery disease, or obesity, it is possible that these individuals had advanced cases of diabetes, which tends to worsen over time due to the progressive decline of pancreatic β-cell function.37 It has been noted in the literature that “failure of β-cell function in the late stages of the disease is further compounded by the complications of diabetes and by the likelihood of significant comorbidities in elderly patients”.37 The highest dose cohort also may have had insulin resistance, given that the use of >200 units of insulin/day is a marker of insulin resistance,38 and this group used >300 units/day. Previous literature has noted a reluctance to prescribe and use very high doses of U-100 insulin as well as a reduced physiological response among patients on such regimens;38 this evidence may help to explain the poor outcomes among the highest dose patients in our study. In any case, the findings indicate that patients with U-100 insulin doses >300 units/day constitute a unique treatment subgroup whose diabetes may not be adequately controlled. It has been suggested that the use of U-500 may improve the likelihood of achieving optimal glycemic control among extremely insulin-resistant patients such as the highest dose patients in the present population.38
Dosing, adherence, and hypoglycemia
Medication adherence has been shown to be the single factor with the greatest impact on treatment costs, in studies where adherence was proxied by the medication possession ratio.39,40 In the present study, the lowest index dose (<100 units/day) was associated with improved adherence (ie, a PDC threshold of at least 80%). This finding supports earlier evidence that adherence to antidiabetic therapies tends to decrease as treatment complexity increases.40–42 Furthermore, the relatively poor adherence among high-dose cohorts is consistent with research suggesting that adherence among this group may be improved by utilizing strategies to lower the daily injection burden, such as using an insulin pump43 or using U-500 insulin.43,44
Hypoglycemic events are a serious potential consequence of insulin therapy, and such events have been linked to significant humanistic and economic costs.32 This study found no association between index insulin dose and the likelihood of experiencing a hypoglycemic event, with the exception that those with an index dose of >100–150 units/day were more likely to experience a hypoglycemic event compared to those with an index dose of 10–100 units/day. While this finding is inconsistent with the literature which has reported higher rates of hypoglycemia with intensive insulin therapy,45 it may reflect the limitation of relying upon diagnostic codes to identify hypoglycemia. Given the research that has found that fear of hypoglycemia is a common cause for not adjusting insulin dose upward among individuals with T1DM and HbA1c higher than 8.5%,46 the finding in this study that there is not an increased risk of hypoglycemia as dose increases suggests that patients and/or physicians may wish to consider increasing insulin doses when appropriate.
Limitations
The analyses were based on observational insurance claims data, which may affect the generalizability of the results. First, for instance, the claims database included only individuals with continuous medical and prescription benefit coverage, and insulin dosing categories resulted in unbalanced sample sizes. Second, the use of diagnostic codes is not as rigorous as formal assessments and may underrepresent certain conditions or events (eg, obesity, hypoglycemia). Third, the use of claims data precluded an examination of associations between outcomes and non-documented factors such as race, body mass index, insulin sensitivity, or duration of diabetes. Fourth, the dataset did not allow for an investigation of causes (eg, of differences in dosing). Fifth, the methodology precluded observation of the manner in which the insulin was self-administered (eg, whether/how the individual patient may have self-adjusted the dosing) and any related effects. Furthermore, while the analyses were not conducted separately for patients with type 1 or type 2 diabetes, all multivariable analyses controlled for differences in diabetes type. Finally, the analyses focused on statistical significance and were unable to determine whether differences in outcomes represented minimal clinically important changes.
Conclusion
In this study, elderly adult patients with diabetes who were using the highest doses observed (>300 units/day) constituted the smallest, but on average, most costly cohort of patients had the lowest adherence to index insulin dose. For example, this cohort had the highest average drug and total direct medical costs as well as the second highest average acute care costs. Another key finding of this study indicates that a large majority of US elderly patients with diabetes may be undertreated. For instance, all-cause inpatient and ER costs, as well as diabetes-related inpatient and ER costs, were highest among the largest cohort of individuals, who were treated with the lowest dose observed (ie, an index dose of 10–100 units/day), an observation which may indicate a humanistic and acute care burden associated with clinical inertia in the treatment of elderly persons with diabetes.
Furthermore, a U-shaped pattern for average, all-cause costs (except drug costs), diabetes-related inpatient costs, and resource use were also generally observed, with costs highest among those who received the lowest and highest index dose ranges. These results suggest higher patient burden among those with the lowest and highest insulin doses and suggests that physicians may wish to pay particular attention to these two groups of elderly individuals.
Acknowledgments
The authors thank Patricia Platt for her assistance in manuscript preparation, which was financially supported by HealthMetrics Outcomes Research.
Disclosure
Kate Van Brunt, Cynthia Brusko, Bradley Curtis, and Elizabeth L Eby completed this project while employed by Eli Lilly and Company. Maureen J Lage was compensated by Eli Lilly and Company for her work on this project. The authors report no other conflicts of interest in this work.
References
Centers for Disease Control and Prevention. CDC – State of Aging and Health in America (SAHA) – Aging – Healthy Aging for Older Adults; 2013. Available from: http://www.cdc.gov/aging/help/dph-aging/state-aging-health.html. Accessed April 3, 2014. | ||
U. S. Census Bureau DIS. 2012 National Population Projections: Summary Tables; 2013. Available from: http://www.census.gov/population/projections/data/national/2012/summarytables.html. Accessed April 3, 2014. | ||
American Diabetes Association. Non-Modifiable Risk Factors – DiabetesPro – American Diabetes Association. DiabetesPro Professional Resources Online; 2014. Available from: http://www.professional.diabetes.org/ResourcesForProfessionals.aspx?typ=17&cid=60390. Accessed April 5, 2014. | ||
Centers for Disease Control and Prevention. National Diabetes Statistics Report: Estimates of Diabetes and Its Burden in the United States, 2014. Atlanta, GA: U.S. Department of Health and Human Services; 2014. Available at http://www.cdc.gov/diabetes/pubs/statsreport14/national-diabetes-report-web.pdf. | ||
Sue Kirkman M, Briscoe VJ, Clark N, et al. Diabetes in older adults: a consensus report. J Am Geriatr Soc. 2012;60(12):2342–2356. doi:10.1111/jgs.12035. | ||
Zhang X, Decker FH, Luo H, et al. Trends in the prevalence and comorbidities of diabetes mellitus in nursing home residents in the United States: 1995–2004. J Am Geriatr Soc. 2010;58(4):724–730. doi:10.1111/j.1532-5415.2010.02786.x. | ||
California Healthcare Foundation/American Geriatrics Society Panel in Improving Care for Elders with Diabetes C. Guidelines for improving the care of the older person with diabetes mellitus. J Am Geriatr Soc. 2003;51(5s):265–280. doi:10.1046/j.1532-5415.51.5s.1.x. | ||
American Diabetes Association. Economic costs of diabetes in the U.S. in 2012. Dia Care. 2013;36(4):1033–1046. doi:10.2337/dc12-2625. | ||
American Diabetes Association. Standards of medical care in diabetes – 2014. Dia Care. 2014;37(suppl 1):S14–S80. doi:10.2337/dc14-S014. | ||
American Diabetes Association. Standards of medical care in diabetes – 2012. Dia Care. 2012;35(suppl 1):S11–S63. doi:10.2337/dc12-s011. | ||
American Diabetes Association. Type 1 Diabetes – American Diabetes Association®. American Diabetes Association; 2014. Available from: http://www.diabetes.org/diabetes-basics/type-1/. Accessed April 5, 2014. | ||
Fravel MA, McDanel DL, Ross MB, Moores KG, Starry MJ. Special considerations for treatment of type 2 diabetes mellitus in the elderly. Am J Health Syst Pharm. 2011;68(6):500–509. doi:10.2146/ajhp080085. | ||
Inzucchi SE, Bergenstal RM, Buse JB, et al. Management of hyperglycemia in type 2 diabetes: a patient-centered approach position statement of the American Diabetes Association (ADA) and the European Association for the Study of Diabetes (EASD). Dia Care. 2012;35(6):1364–1379. doi:10.2337/dc12-0413. | ||
Johnson EL, Brosseau JD, Soule M, Kolberg J. Treatment of diabetes in long-term care facilities: a primary care approach. Clin Diabetes. 2008;26(4):152–156. doi:10.2337/diaclin.26.4.152. | ||
Sinclair AJ. Special considerations in older adults with diabetes: meeting the challenge. Diabetes Spectr. 2006;19(4):229–233. doi:10.2337/diaspect.19.4.229. | ||
American Diabetes Association. Insulin administration. Dia Care. 2002;25(suppl 1):s112–s115. doi:10.2337/diacare.25.2007.S112. | ||
BD. Different Types of Insulin. BD Helping all people live healthy lives; 2014. Available from: http://www.bd.com/us/diabetes/page.aspx?cat=7001&id=7245. Accessed April 5, 2014. | ||
Clark A. USPharmacist.com > U-500 Insulin: Not for Ordinary Use; 2010. Available from: http://www.uspharmacist.com/content/s/126/c/20822/. Accessed April 5, 2014. | ||
U.S. Bureau of Labor Statistics. U.S. Bureau of Labor Statistics. Databases, Tables & Calculators by Subject. Available from http://www.bls.gov/data/. | ||
D’Hoore W, Sicotte C, Tilquin C. Risk adjustment in outcome assessment: the Charlson comorbidity index. Methods Inf Med. 1993;32(5):382–387. | ||
Quan H, Sundararajan V, Halfon P, et al. Coding algorithms for defining comorbidities in ICD-9-CM and ICD-10 administrative data. Med Care. 2005;43(11):1130–1139. | ||
Touraille P, Gouyon P-H. Why are women smaller than men? When anthropology meets evolutionary biology. Nat Preced. 2008;(713). doi:10.1038/npre.2008.1832.1. | ||
Gill G, Hardy K, Lorains J. Relationship between insulin dose, body weight and glycaemic control in insulin-dependent diabetes. Pract Diab Int. 1994;11(6):248–249. doi:10.1002/pdi.1960110609. | ||
Inzucchi SE, Bergenstal RM, Buse JB, et al. Management of hyperglycemia in type 2 diabetes: a patient-centered approach: position statement of the American Diabetes Association (ADA) and the European Association for the Study of Diabetes (EASD). Diabetes Care. 2012;35(6):1364–1379. doi:10.2337/dc12-0413. | ||
Ismail-Beigi F, Moghissi E, Tiktin M, Hirsch IB, Inzucchi SE, Genuth S. Individualizing glycemic targets in type 2 diabetes mellitus: implications of recent clinical trials. Ann Intern Med. 2011;154(8):554–559. doi:10.7326/0003-4819-154-8-201104190-00007. | ||
Bale GS, Entmacher PS. Estimated life expectancy of diabetics. Diabetes. 1977;26(5):434–438. | ||
Lipska KJ, Ross JS, Wang Y, et al. National trends in US hospital admissions for hyperglycemia and hypoglycemia among Medicare beneficiaries, 1999 to 2011. JAMA Intern Med. 2014;174(7):1116–1124. doi:10.1001/jamainternmed.2014.1824. | ||
Kabadi MU, Kabadi UM. Efficacy of sulfonylureas with insulin in type 2 diabetes mellitus. Ann Pharmacother. 2003;37(11):1572–1576. doi:10.1345/aph.1C492. | ||
Daousi C, Casson IF, Gill GV, MacFarlane IA, Wilding JPH, Pinkney JH. Prevalence of obesity in type 2 diabetes in secondary care: association with cardiovascular risk factors. Postgrad Med J. 2006;82(966): 280–284. doi:10.1136/pmj.2005.039032. | ||
Piette JD, Kerr EA. The impact of comorbid chronic conditions on diabetes care. Dia Care. 2006;29(3):725–731. doi:10.2337/diacare.29.03.06.dc05-2078. | ||
Pentakota SR, Rajan M, Fincke BG, et al. Does diabetes care differ by type of chronic comorbidity?: An evaluation of the Piette and Kerr framework. Dia Care. 2012;35(6):1285–1292. doi:10.2337/dc11-1569. | ||
Ahren B. Avoiding hypoglycemia: a key to success for glucose-lowering therapy in type 2 diabetes. Vasc Health Risk Manag. 2013;9:155–163. doi:10.2147/VHRM.S33934. | ||
Tunis SL, Ascher-Svanum H, Stensland M, Kinon BJ. Assessing the value of antipsychotics for treating schizophrenia: the importance of evaluating and interpreting the clinical significance of individual service costs. Pharmacoeconomics. 2004;22(1):1–8. | ||
Da Costa S, Brackenridge B, Hicks D. A comparison of insulin pen use in the United States and the United Kingdom. Diabetes Educ. 2002;28(1):52–56, 59–60. | ||
Grimmer K, Beaton K, Kumar S, et al. Estimating the risk of functional decline in the elderly after discharge from an Australian public tertiary hospital emergency department. Aust Health Rev. 2013;37(3):341–347. doi:10.1071/AH12034. | ||
McCusker J, Verdon J. Do geriatric interventions reduce emergency department visits? A systematic review. J Gerontol A Biol Sci Med Sci. 2006;61(1):53–62. | ||
Fonseca VA. Defining and Characterizing the Progression of Type 2 Diabetes. Dia Care. 2009;32(suppl 2):S151–S156. doi:10.2337/dc09-S301. | ||
Cochran E, Musso C, Gorden P. The use of U-500 in patients with extreme insulin resistance. Dia Care. 2005;28(5):1240–1244. doi:10.2337/diacare.28.5.1240. | ||
Balkrishnan R, Rajagopalan R, Camacho FT, Huston SA, Murray FT, Anderson RT. Predictors of medication adherence and associated health care costs in an older population with type 2 diabetes mellitus: a longitudinal cohort study. Clin Ther. 2003;25(11):2958–2971. | ||
Curkendall SM, Thomas N, Bell KF, Juneau PL, Weiss AJ. Predictors of medication adherence in patients with type 2 diabetes mellitus. Curr Med Res Opin. 2013;29(10):1275–1286. doi:10.1185/03007995.2013.821056. | ||
García-Pérez L-E, Alvarez M, Dilla T, Gil-Guillén V, Orozco-Beltrán D. Adherence to therapies in patients with type 2 diabetes. Diabetes Ther. 2013;4(2):175–194. doi:10.1007/s13300-013-0034-y. | ||
Nau DP. Recommendations for improving adherence to type 2 diabetes mellitus therapy – focus on optimizing oral and non-insulin therapies. Am J Manag Care. 2012;18(suppl 3):S49–S54. | ||
Eby EL, Zagar AJ, Wang P, et al. Healthcare costs and adherence associated with human regular u-500 versus high-dose u-100 insulin in patients with diabetes. Endocr Pract. 2014;20(7):663–670. doi:10.4158/EP13407.OR. | ||
Eby EL, Wang P, Curtis BH, et al. Cost, healthcare resource utilization, and adherence of individuals with diabetes using U-500 or U-100 insulin: a retrospective database analysis. J Med Econ. 2013;16(4):529–538. doi:10.3111/13696998.2013.772059. | ||
Rubin DJ, Rybin D, Doros G, McDonnell ME. Weight-based, insulin dose-related hypoglycemia in hospitalized patients with diabetes. Diabetes Care. 2011;34(8):1723–1728. doi:10.2337/dc10-2434. | ||
Reach G, Zerrouki A, Leclercq D, d’ Ivernois J-F. Adjusting insulin doses: from knowledge to decision. Patient Educ Couns. 2005;56(1):98–103. doi:10.1016/j.pec.2004.01.001. |
 © 2015 The Author(s). This work is published and licensed by Dove Medical Press Limited. The
full terms of this license are available at https://www.dovepress.com/terms.php
and incorporate the Creative Commons Attribution
- Non Commercial (unported, v3.0) License.
By accessing the work you hereby accept the Terms. Non-commercial uses of the work are permitted
without any further permission from Dove Medical Press Limited, provided the work is properly
attributed. For permission for commercial use of this work, please see paragraphs 4.2 and 5 of our Terms.
© 2015 The Author(s). This work is published and licensed by Dove Medical Press Limited. The
full terms of this license are available at https://www.dovepress.com/terms.php
and incorporate the Creative Commons Attribution
- Non Commercial (unported, v3.0) License.
By accessing the work you hereby accept the Terms. Non-commercial uses of the work are permitted
without any further permission from Dove Medical Press Limited, provided the work is properly
attributed. For permission for commercial use of this work, please see paragraphs 4.2 and 5 of our Terms.