Back to Journals » Neuropsychiatric Disease and Treatment » Volume 14
Do eyes with and without optic neuritis in multiple sclerosis age equally?
Authors Lizrova Preiningerova J, Grishko A ![]() , Sobisek L
, Sobisek L ![]() , Andelova M
, Andelova M ![]() , Benova B, Kucerova K, Havrdova EK
, Benova B, Kucerova K, Havrdova EK ![]()
Received 4 April 2018
Accepted for publication 29 May 2018
Published 5 September 2018 Volume 2018:14 Pages 2281—2285
DOI https://doi.org/10.2147/NDT.S169638
Checked for plagiarism Yes
Review by Single anonymous peer review
Peer reviewer comments 3
Editor who approved publication: Dr Roger Pinder
Jana Lizrova Preiningerova,1 Anna Grishko,2 Lukas Sobisek,2 Michaela Andelova,1 Barbora Benova,1 Karolina Kucerova,1 Eva Kubala Havrdova1
1Center of Clinical Neuroscience, Department of Neurology, General University Hospital, 1st Faculty of Medicine, Charles University, Prague Czech Republic; 2Department of Statistics and Probability, University of Economics, Prague, Czech Republic
Purpose: Anterior visual pathway reflects axonal loss caused by both optic neuritis (ON) and neurodegeneration in multiple sclerosis (MS). Although the axonal injury post-ON is thought to be complete by 6 months of onset, most studies using optical coherence tomography (OCT) to evaluate retinal changes as a marker of neurodegeneration exclude eyes with a history of ON or consider them separately. The objective of this study was to assess whether the eyes post-ON (>6 months) show in later years different rate of chronic retinal changes than the fellow eyes not affected by ON.
Patients and methods: Fifty-six patients with MS with a history of ON in one eye (ON eyes) and no ON in the fellow (FL) eye, who were followed by OCT for >2 years, were selected from a cohort of patients with MS. Paired eye analysis was performed.
Results: Mean interval post-ON at baseline was 5.65 (SD 5.05) years. Mean length of follow-up by OCT was 4.57 years. There was no statistical difference in absolute or relative thinning of retinal nerve fiber layer in peripapillary area between the ON and FL eyes.
Conclusion: This study has shown that we do not need to exclude eyes with a history of ON from longitudinal studies of neurodegeneration in MS, provided that we use data outside of the frame of acute changes post-ON. Long-term changes of peripapillary retinal nerve fiber layer in ON and FL eyes are equal.
Keywords: optical coherence tomography, neurodegeneration, multiple sclerosis, retina
Introduction
Multiple sclerosis (MS) is an autoimmune disease of the central nervous system characterized by a highly variable disease course and degree of symptoms.1 While the cause of the disease remains to be elucidated, it is evident that both inflammation and neurodegeneration, focal and diffuse changes, lead to injury of the central nervous system tissue in MS. Axonal loss may be unnoticed in early stages of the disease and difficult to quantify on standard brain imaging, but it ultimately results in disability.2 Thinning of retinal layers reflects a degree of axonal injury in the brain in MS and can be noninvasively imaged using optical coherence tomography (OCT).3,4 It has been shown that thinning of peripapillary retinal nerve fiber layer (pRNFL) correlates with objective neurological findings measured by Expanded Disability Status Scale (EDSS) and other biomarkers of MS, such as lesion volume and brain atrophy measures.5–8
The visual pathway is affected by slow changes reflecting chronic axonal injury as well as by acute inflammatory episodes of optic neuritis (ON).9 Up to 75% of patients with MS experience at least one episode of ON in their lifetime.10,11 Within the first 6 months of the symptom onset, one episode of ON leads, in most patients, to a significant decrease in pRNFL thickness (about 20 μm).5,12 Studies looking at retinal measurements as a marker of neurodegeneration either exclude all eyes with a history of ON and focus on eyes without ON, as the event of ON disrupts the correlations with measures of axonal loss, or consider them in a separate analysis.13–15 Previous studies looking at the damage to retinal structures as a consequence of ON in MS had shown that retinal changes occur early and assessment at 6 months after the onset of ON is considered to be a final outcome of ON.12,16 Therefore, we hypothesize that eyes with a history of ON do not have to be excluded from later studies, as they reflect the same rate of neurodegeneration as the eyes without ON.
The objective of this study was to assess whether the eyes post-ON (>6 months) show in later years the same rate of chronic retinal changes as the fellow (FL) eyes not affected by ON.
Patients and methods
From a cohort of patients followed in an academic MS center longitudinally by OCT and clinical assessments were selected patients with a diagnosis of MS or a clinically isolated syndrome, who had a history of at least one ON (N=409). All subjects gave written informed consent for participation in the longitudinal OCT study (IRB# 00002705 General University Hospital). Diagnosis of MS was supported by findings on magnetic resonance imaging of the brain and results of cerebrospinal fluid assessment.17 Diagnosis and date of ON were obtained from the chart review. Neurological exam expressed as EDSS was performed by an MS specialist.18
Peripapillary ring scans (3.4 mm in diameter, ART 100) manually centered around the optic nerve head were obtained by two operators at room light conditions on one Spectral Domain OCT device (Heidelberg Spectralis) with the use of an eye tracking function and marking the first OCT scan as a reference for all follow-ups. The pupils were not dilated. Thickness of retinal fiber layer (RNFL) was automatically measured by a built-in software (software version 5.8.3.0) in temporal segment (RNFL T), nasal segment (RNFL N) and as a mean thickness of RNFL in peripapillary ring that averages temporal, nasal, superior and inferior segments (RNFL G).
From this dataset were excluded patients meeting the following criteria: history of more than one unilateral ON before or during the follow-up, history of diabetes, glaucoma, uveitis or other eye diseases, refractive errors over 6 D. Scans performed <6 months after the onset of ON and scans not meeting the consensus criteria for retinal OCT quality assessment (OSCAR-IB criteria), for instance, due to a failure of segmentation algorithm or a poor signal quality due to unclear ocular media, were also excluded.19,20 Out of 130 patients meeting the above criteria, we further selected only those patients followed for at least 2 years and with at least four analyzable OCT assessments. The four OCT measurements were required to be able to fit individual linear regression model, because we lost one measurement due to a computation of differences between each pair of eyes. Three measurements are the meaningful minimum number of data points to apply linear regression model (ordinary least squares [OLS] estimates). Paired eyes (FL and ON eyes) of 56 patients were accepted for the analysis.
Statistical analysis
First, we compared the ON and FL eyes’ RNFL parameters (variables) at baseline and their (absolute and relative) changes toward the end of the follow-up (last time point), running Welch’s one-way analysis of means for normally distributed variables and Mann–Whitney test for non-normally distributed variables. Lilliefors normality test was used to assess whether the variable was normally or non-normally distributed. Second, we tested the (null) hypothesis that both eyes (ON and FL eyes belonging to one object = patient) mirror each other in a gradual decline of RNFL thickness during the follow-up by estimating the linear trend of absolute differences between relative changes (to baseline) of ON and FL eyes within each patient. We fitted the linear mixed-effects model for the absolute differences (response variable) on time in years (fixed effect) with random intercept. By doing this, an inter-eye dependency was considered, and each pair of eyes was analyzed as one object belonging to the same patient. The estimated regression coefficient beta1 (fixed effect of time) is assumed to be not statistically different from zero if the null hypothesis is true, for example, in case that both paired eyes’ relative changes from baseline are not different during the follow-up. The statistical significance of the coefficient beta1 was tested by Student’s t-test for regression coefficient with Satterthwaite approximations to degrees of freedom. Calculations were performed in the statistical system R (www.r-project.org).21
Results
Fifty-six subjects met the criteria for the analysis. There were 15 men and 41 women, with a mean age 39 years and with median EDSS score 2.5 (range 1.0–5.5). At the time of the first admittable OCT scan post-ON (baseline), 6 patients had diagnosis of clinically isolated syndrome, 49 had relapsing MS and 1 patient was diagnosed with secondary progressive MS. Demographic data and treatment status are summarized in Table 1.
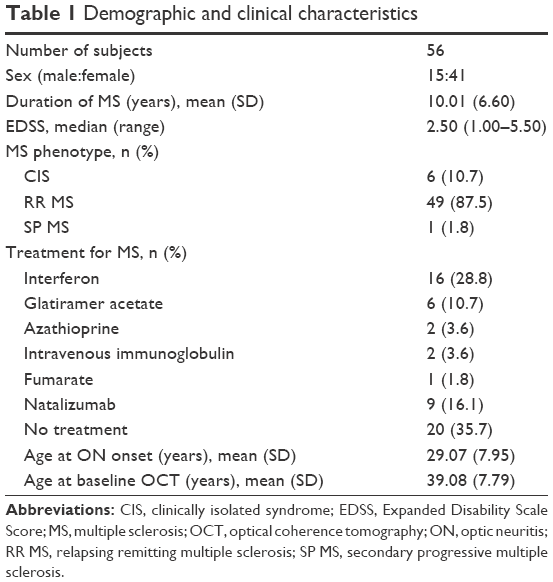 | Table 1 Demographic and clinical characteristics |
Mean interval between the onset of ON and the baseline of the study was 5.65 (SD 5.05) years. Mean length of follow-up by OCT was 4.57 (SD 1.44) years. Patients had between four OCT and ten OCT scans over the follow-up with the median time (interquartile range) between the scans being 0.96 (0.50–1.09) years. Characteristics for RNFL parameters at baseline and changes during the follow-up (from baseline to the last available assessment) are shown in Table 2.
 | Table 2 Descriptive characteristics for RNFL parameters (baseline values and changes during follow-up) and their comparison between ON and FL eyes |
As expected, mean RNFL T at baseline in the ON eyes was significantly thinner than in the FL eyes (53.93 vs 65.02 μm, P<0.001). There was no statistical difference in absolute or relative thinning of RNFL (delta RNFL T, delta RNFL N, delta RNFL G) between the ON and FL eyes during the follow-up (Table 2).
The mixed-effects model was fitted using absolute differences between ON and FL eyes’ relative change to baseline (Table 3). The beta’s values around zero and the corresponding P-values give an evidence of nonsignificance between ON and FL eyes aging during follow-up years. Mean linear trends for ON and FL eyes’ aging were estimated separately for RNFL G, RNFL T and RNFL N (shown in Figure 1).
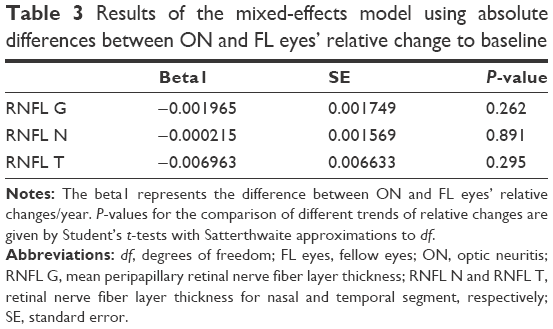 | Table 3 Results of the mixed-effects model using absolute differences between ON and FL eyes’ relative change to baseline |
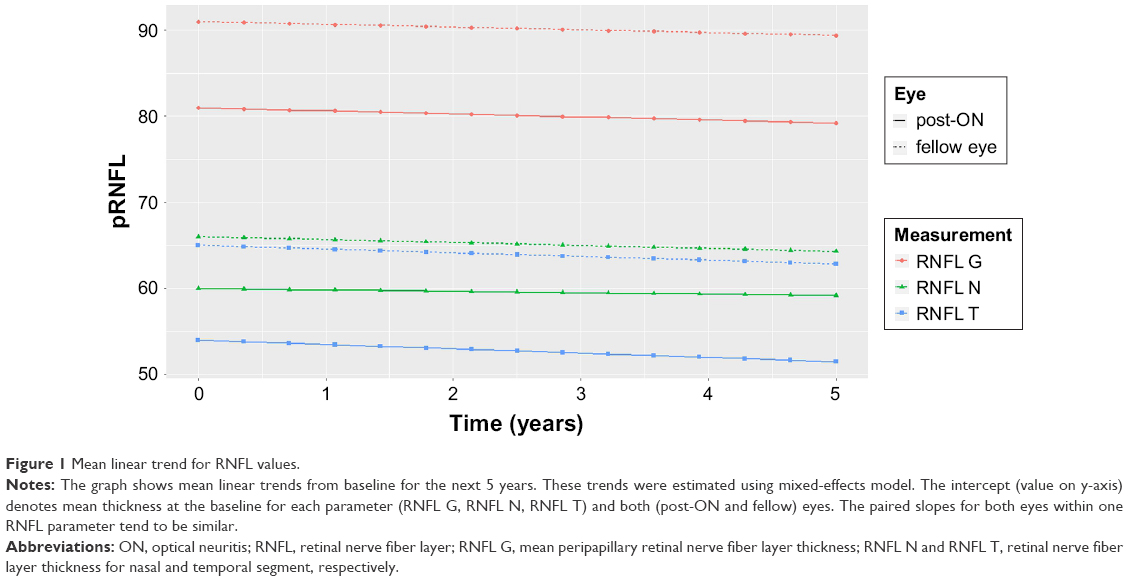 | Figure 1 Mean linear trend for RNFL values. |
Discussion
OCT has a unique role in neurology, as it allows noninvasive, highly reproducible measurements of changes in anterior visual pathway. OCT biomarkers, such as peripapillary RNFL thickness, became valuable tools in monitoring the axonal injury in MS. Major studies evaluating retinal changes in MS as a measure of neurodegeneration include only eyes without ON perhaps due to uncertainty of a confounding process lingering in the affected eye post-ON.7,14,22,23 Biomarkers, in general, have high utility if they are widely applicable. Therefore, it is important to answer the question whether such restriction is necessary.
In this study, we had shown that long-term decline in RNFL thickness is not different between eyes without ON and eyes post-ON, provided that we include only measures obtained >6 months after the onset of ON. We chose analysis of paired eyes (one affected by ON and the other one unaffected) followed by the same OCT instrument and the same protocol over time to eliminate potential confounding factors such as treatment effect, disease activity, technical variability and so on.
It has been shown that damage to retinal structures starts early in a course of ON and can be detected within a month of onset.24 Henderson et al, in a study following eyes with acute ON for up to 18 months, had shown that 99% of the decline in pRNFL occurs by 6 months after the onset of clinical symptoms.16 Garcia-Martin et al have followed eyes post-ON up to 24 months and also concluded that ON is not a risk factor for increased chronic damage in MS patients.25
One question that cannot be answered by our study is whether the FL eyes have a different rate of RNFL thinning than the eyes of MS patients without a history of ON in either eye. It has been shown that RNFL in the FL eyes of patients with MS post-ON is thinner than RNFL in the eyes of patients with no ON in history. It is not clear whether this is caused by subclinical episodes of ON26 or it reflects a different rate of RNFL thinning. A longitudinal study by Saidha et al that followed retinal changes (Cirrus HD-OCT) and brain atrophy measures in patients with MS had shown that history of ON in one or neither eye has affected relationship between GCIP (ganglion cell + inner plexiform layer) and brain atrophy measures.15 That supports a notion that patients with and without history of ON may have different rates of retinal atrophy in eyes unaffected by ON. Another limitation of our study is the lack of full retinal segmentation, which limits us in assessing ganglion cell + inner plexiform and other layers.
Conclusion
Measurements of axonal injury are an essential tool in monitoring severity of the disease in MS. OCT as a highly reproducible, noninvasive and well-tolerated imaging method is a great candidate to become a predictive tool in MS. Biomarkers are most valuable in clinical practice when applicable to a wide spectrum of patients. This study has shown that we do not need to exclude all eyes with a history of ON from longitudinal studies, provided that we use data outside of the frame of acute changes post-ON. Long-term changes of pRNFL in ON and FL eyes of patients with MS are equal.
Acknowledgments
Data collection and statistical analysis were supported by a research grant provided by Biogen Idec. This work was supported by the Czech Ministry of Education project PROGRES-Q27/LF1. LS also received long-term institutional support of research activities by Faculty of Informatics and Statistics, University of Economics, Prague.
Disclosure
The authors report no conflicts of interest in this work.
References
Matthews PM, Roncaroli F, Waldman A, et al. A practical review of the neuropathology and neuroimaging of multiple sclerosis. Pract Neurol. 2016;16(4):279–287. | ||
Azevedo CJ, Pelletier D. Whole-brain atrophy: ready for implementation into clinical decision-making in multiple sclerosis? Curr Opin Neurol. 2016;29(3):237–242. | ||
Frohman EM, Fujimoto JG, Frohman TC, Calabresi PA, Cutter G, Balcer LJ. Optical coherence tomography: a window into the mechanisms of multiple sclerosis. Nat Clin Pract Neurol. 2008;4(12):664–675. | ||
Petzold A, Balcer LJ, Calabresi PA, et al. Retinal layer segmentation in multiple sclerosis: a systematic review and meta-analysis. Lancet Neurol. 2017;16(10):797–812. | ||
Petzold A, de Boer JF, Schippling S, et al. Optical coherence tomography in multiple sclerosis: a systematic review and meta-analysis. Lancet Neurol. 2010;9(9):921–932. | ||
Frohman EM, Dwyer MG, Frohman T, et al. Relationship of optic nerve and brain conventional and non-conventional MRI measures and retinal nerve fiber layer thickness, as assessed by OCT and GDx: a pilot study. J Neurol Sci. 2009;282(1–2):96–105. | ||
Saidha S, Sotirchos ES, Oh J, et al. Relationships between retinal axonal and neuronal measures and global central nervous system pathology in multiple sclerosis. JAMA Neurol. 2013;70(1):34–43. | ||
Galetta SL, Villoslada P, Levin N, et al. Acute optic neuritis: unmet clinical needs and model for new therapies. Neurol Neuroimmunol Neuroinflamm. 2015;2(4):e135. | ||
Petzold A, Wattjes MP, Costello F, et al. The investigation of acute optic neuritis: a review and proposed protocol. Nat Rev Neurol. 2014;10(8):447–458. | ||
Frohman TC, Graves J, Balcer LJ, Galetta SL, Frohman EM. The neuro-ophthalmology of multiple sclerosis. Continuum (Minneap Minn). 2010;16(5):122–146. | ||
Szilasiová J, Klímová E, Veselá D. Optic neuritis as the first sign of multiple sclerosis. Cesk Slov Oftalmol. 2002;58(4):259–264. | ||
Costello F, Hodge W, Pan YI, Eggenberger E, Coupland S, Kardon RH. Tracking retinal nerve fiber layer loss after optic neuritis: a prospective study using optical coherence tomography. Mult Scler. 2008;14(7):893–905. | ||
Zimmermann H, Freing A, Kaufhold F, et al. Optic neuritis interferes with optical coherence tomography and magnetic resonance imaging correlations. Mult Scler. 2013;19(4):443–450. | ||
Martinez-Lapiscina EH, Arnow S, Wilson JA, et al. Retinal thickness measured with optical coherence tomography and risk of disability worsening in multiple sclerosis: a cohort study. Lancet Neurol. 2016;15(6):574–584. | ||
Saidha S, Al-Louzi O, Ratchford JN, et al. Optical coherence tomography reflects brain atrophy in multiple sclerosis: a four-year study. Ann Neurol. 2015;78(5):801–813. | ||
Henderson AP, Altmann DR, Trip AS, et al. A serial study of retinal changes following optic neuritis with sample size estimates for acute neuroprotection trials. Brain. 2010;133(9):2592–2602. | ||
Polman CH, Reingold SC, Banwell B, et al. Diagnostic criteria for multiple sclerosis: 2010 revisions to the McDonald criteria. Ann Neurol. 2011;69(2):292–302. | ||
Kurtzke JF. Rating neurologic impairment in multiple sclerosis: an expanded disability status scale (EDSS). Neurology. 1983;33(11):1444–1452. | ||
Tewarie P, Balk L, Costello F, et al. The OSCAR-IB consensus criteria for retinal OCT quality assessment. PLoS One. 2012;7(4):e34823. | ||
Schippling S, Balk LJ, Costello F, et al. Quality control for retinal OCT in multiple sclerosis: validation of the OSCAR-IB criteria. Mult Scler. 2015;21(2):163–170. | ||
R: a language and environment for statistical computing [computer program]. Version; 2013. Available from: http://www.r-project.org/. Accessed August 6, 2018. | ||
Oberwahrenbrock T, Schippling S, Ringelstein M, et al. Retinal damage in multiple sclerosis disease subtypes measured by high-resolution optical coherence tomography. Mult Scler Int. 2012;2012:530305–530310. | ||
Abalo-Lojo JM, Limeres CC, Gómez MA, et al. Retinal nerve fiber layer thickness, brain atrophy, and disability in multiple sclerosis patients. J Neuroophthalmol. 2014;34(1):23–28. | ||
Sanchez-Dalmau B, Martinez-Lapiscina EH, Torres-Torres R, et al. Early retinal atrophy predicts long-term visual impairment after acute optic neuritis. Mult Scler. 2018;24(9):1196–1204. | ||
Garcia-Martin E, Pueyo V, Ara JR, et al. Effect of optic neuritis on progressive axonal damage in multiple sclerosis patients. Mult Scler. 2011;17(7):830–837. | ||
Naismith RT, Tutlam NT, Xu J, et al. Optical coherence tomography is less sensitive than visual evoked potentials in optic neuritis. Neurology. 2009;73(1):46–52. |
 © 2018 The Author(s). This work is published and licensed by Dove Medical Press Limited. The
full terms of this license are available at https://www.dovepress.com/terms
and incorporate the Creative Commons Attribution
- Non Commercial (unported, 3.0) License.
By accessing the work you hereby accept the Terms. Non-commercial uses of the work are permitted
without any further permission from Dove Medical Press Limited, provided the work is properly
attributed. For permission for commercial use of this work, please see paragraphs 4.2 and 5 of our Terms.
© 2018 The Author(s). This work is published and licensed by Dove Medical Press Limited. The
full terms of this license are available at https://www.dovepress.com/terms
and incorporate the Creative Commons Attribution
- Non Commercial (unported, 3.0) License.
By accessing the work you hereby accept the Terms. Non-commercial uses of the work are permitted
without any further permission from Dove Medical Press Limited, provided the work is properly
attributed. For permission for commercial use of this work, please see paragraphs 4.2 and 5 of our Terms.