")
Back to Journals » Clinical Ophthalmology » Volume 18
Distal Nasal Part of the Visual Field and RNFL in Primary Open-Angle Glaucoma
Authors Lestak J , Fůs M , Pitrova S
Received 1 November 2023
Accepted for publication 14 December 2023
Published 3 January 2024 Volume 2024:18 Pages 1—7
DOI https://doi.org/10.2147/OPTH.S444057
Checked for plagiarism Yes
Review by Single anonymous peer review
Peer reviewer comments 2
Editor who approved publication: Dr Scott Fraser
Jan Lestak, Martin Fůs, Sarka Pitrova
Department of Natural Sciences, Faculty of Biomedical Engineering, Czech Technical University in Prague, Kladno 2, 27201, Czech Republic
Correspondence: Jan Lestak, Department of Natural Sciences, Faculty of Biomedical Engineering, CTU in Prague, Sitna sq. 3105, Kladno 2, 27201, Czech Republic, Email [email protected]
Purpose: The aim of this study was to compare changes in the conventionally undiagnosed distal nasal visual field with RNFL in patients with early primary open-angle glaucoma (POAG).
Material and Methods: 59 eyes of 32 patients (18 women, 14 men) with early stage POAG were included. All eyes were found to have a normal visual field (fast threshold program of 50 degrees nasally and 22 degrees temporally) with the Medmont M700. Visual acuity was 1.0 (with a possible correction ± 3 D), and they had no other ocular pathology except glaucoma. The visual field was subsequently examined with the same instrument by moving the fixation point 40 degrees temporally (spatially adaptive program) and simultaneously turning the head 10 degrees nasally. A total of 89 examination points were included using flicker stimuli in a range of 0– 120 degrees nasally. Nerve fiber layer (RNFL) and vessel density (VD) was measured using the in-built software of the Avanti RTVue XR instrument. Using Pearson’s correlation coefficient, the results of visual field examination with RNFL without and after correction (by subtracting VD from total RNFL value) in the superior-nasal (SN-5) and inferior-nasal (IN-8) segments were compared.
Results: In all eyes, changes were found in the distal periphery of the nasal part of the visual field. No correlation was noted by comparison with RNFL. After adjusting RNFL for VD, we observed no correlation in the SN segment (5) (r=− 0.03) and a very weak correlation in the IN segment (8) (r=− 0.16).
Conclusion: With a normal visual field tested by the rapid threshold glaucoma program, changes in the distal part of the nasal periphery of the visual field were found in the entire cohort and did not correlate with the RNFL and RNFL results after correction from VD.
Keywords: early diagnosis of POAG, distal nasal visual field, RNFL
Introduction
Glaucoma is a progressive disease in which early diagnosis is very important to preserve visual function.
Due to the asymptomatic nature of glaucoma, early detection before its severe stages is challenging and the number of diagnosed glaucoma patients is lower than the number of undiagnosed patients.1,2
There is now sufficient evidence that retinal ganglion cells (mostly magnocellular) die first in glaucoma,3–7 then their axons located retrolaminarly and finally preliminarily.8,9
Because the magnocellular ganglion cells are located in the periphery of the retina,10–12 their early damage cannot be verified by examination of the central part of the visual field.13
Therefore, we investigated whether examination of the distal nasal periphery can detect visual field abnormalities in early stage POAG. With a normal visual field tested by the fast threshold glaucoma program (nasal to 50, temporal to 22 degrees), distal nasal periphery visual field changes were found in the entire cohort.14
In our previous study, where we investigated the relationship between RNFL and pathological IOP, we demonstrated peripapillary RNFL damage in inferior-temporal (1), superior-temporal (4), superior-nasal (5), and inferior-nasal (8) segments in pathological intraocular pressure (IOP).15
As vessel density (VD) also makes a significant contribution to the total value of RNFL, we performed statistical correction of VD from RNFL using the partial correlation coefficient, the most significant correlation of these parameters was found in segments 5 and 8.16
Similarly, after subtracting VD values from RNFL, we found statistically significant changes in the same segments. 5 (r = −0.32, P = 0.002) and 8 (r = −0.21, P = 0.037).17
This is consistent with primary damage selectively greater loss of large optic nerve fibers that enter the optic nerve target in these segments.8
The aim of the study was to find out the relationship between peripapillary RNFL and changes in the distal nasal visual field in patients with early stage POAG.
Materials and Methods
We enrolled 59 eyes, 32 patients with early stage POAG (none of them had been diagnosed with normotensive glaucoma). Of these, 18 were women (34 eyes) aged 23–67 years (mean age 46.6 years) and 14 were men (25 eyes) aged 26–66 years (mean age 52 years). In addition to an adequate diagnosis, follow-up inclusion criteria were established as physiological ocular findings including pupillary response, visual acuity of 1.0 with correction to ±3 diopters, and visual field (examined by the fast threshold glaucoma program without artificial mydriasis using the Medmont M700 Australia)) without pathological changes.
The methodology of testing the nasal part of the visual field was based on the use of the spatially adaptive test, where the tested range was adjusted to a total of 89 points, each tested on average 2.5 times. The minimum horizontal distance between two measured points was equal to 10°. Exposures were performed using the flicker method (6–18 Hz) according to the adaptive patient response rate algorithm without false positive and negative stimuli. The fixation point was shifted 40 degrees temporally and the subject’s head was rotated nasally so that the range of the nasal part of the visual field under examination reached 120 degrees. Because the program in question examines the visual field at 89 points, we included only those eyes with more than four unseen points. This was done to avoid random variations.
Original VD and RNFL was measured using the in-built software of the Avanti RTVue XR instrument (version 2018.0.018; Optovue, Inc.) in eight peripapillary segments. The resulting scan images were automatically divided into the following segments: inferior-temporal (IT, segment 1), followed by temporal-inferior (TI, segment 2), temporal-superior (TS, segment 3), superior-temporal (ST, segment 4), superior-nasal (SN, segment 5), nasal-superior (NS, segment 6), nasal-inferior (NI, segment 7) and inferior-nasal (IN, segment 8). The statistical parameters were calculated using the software STATISTICA 12.
The effect of VD on total RNFL thickness was corrected for the percentage distribution of vessels within the entire volume of a given segment as a volume difference, yielding the parameter RNFLc. In our previous works, we found a correlation between pathological IOP and RNFLc only in segments 5 (SN) and 8 (IN), we evaluated precisely these segments in this work.16,17
The resulting value was evaluated in relation to visual field using the standard Pearson correlation coefficient r divided by segment. The value of the correlation coefficient r was used to distinguish between: weak (|r|<0.3), moderate (0.3<|r|<0.8) and strong (|r|>0.8) linear relationships. All tests were performed at the 5% level of significance.
Results
Table 1 presents the results of RNFL, number of unregistered points in the distal nasal part of the visual field, VD and RNFL thickness in the superior-nasal (5) and inferior-nasal (8) segments and their values after VD correction.
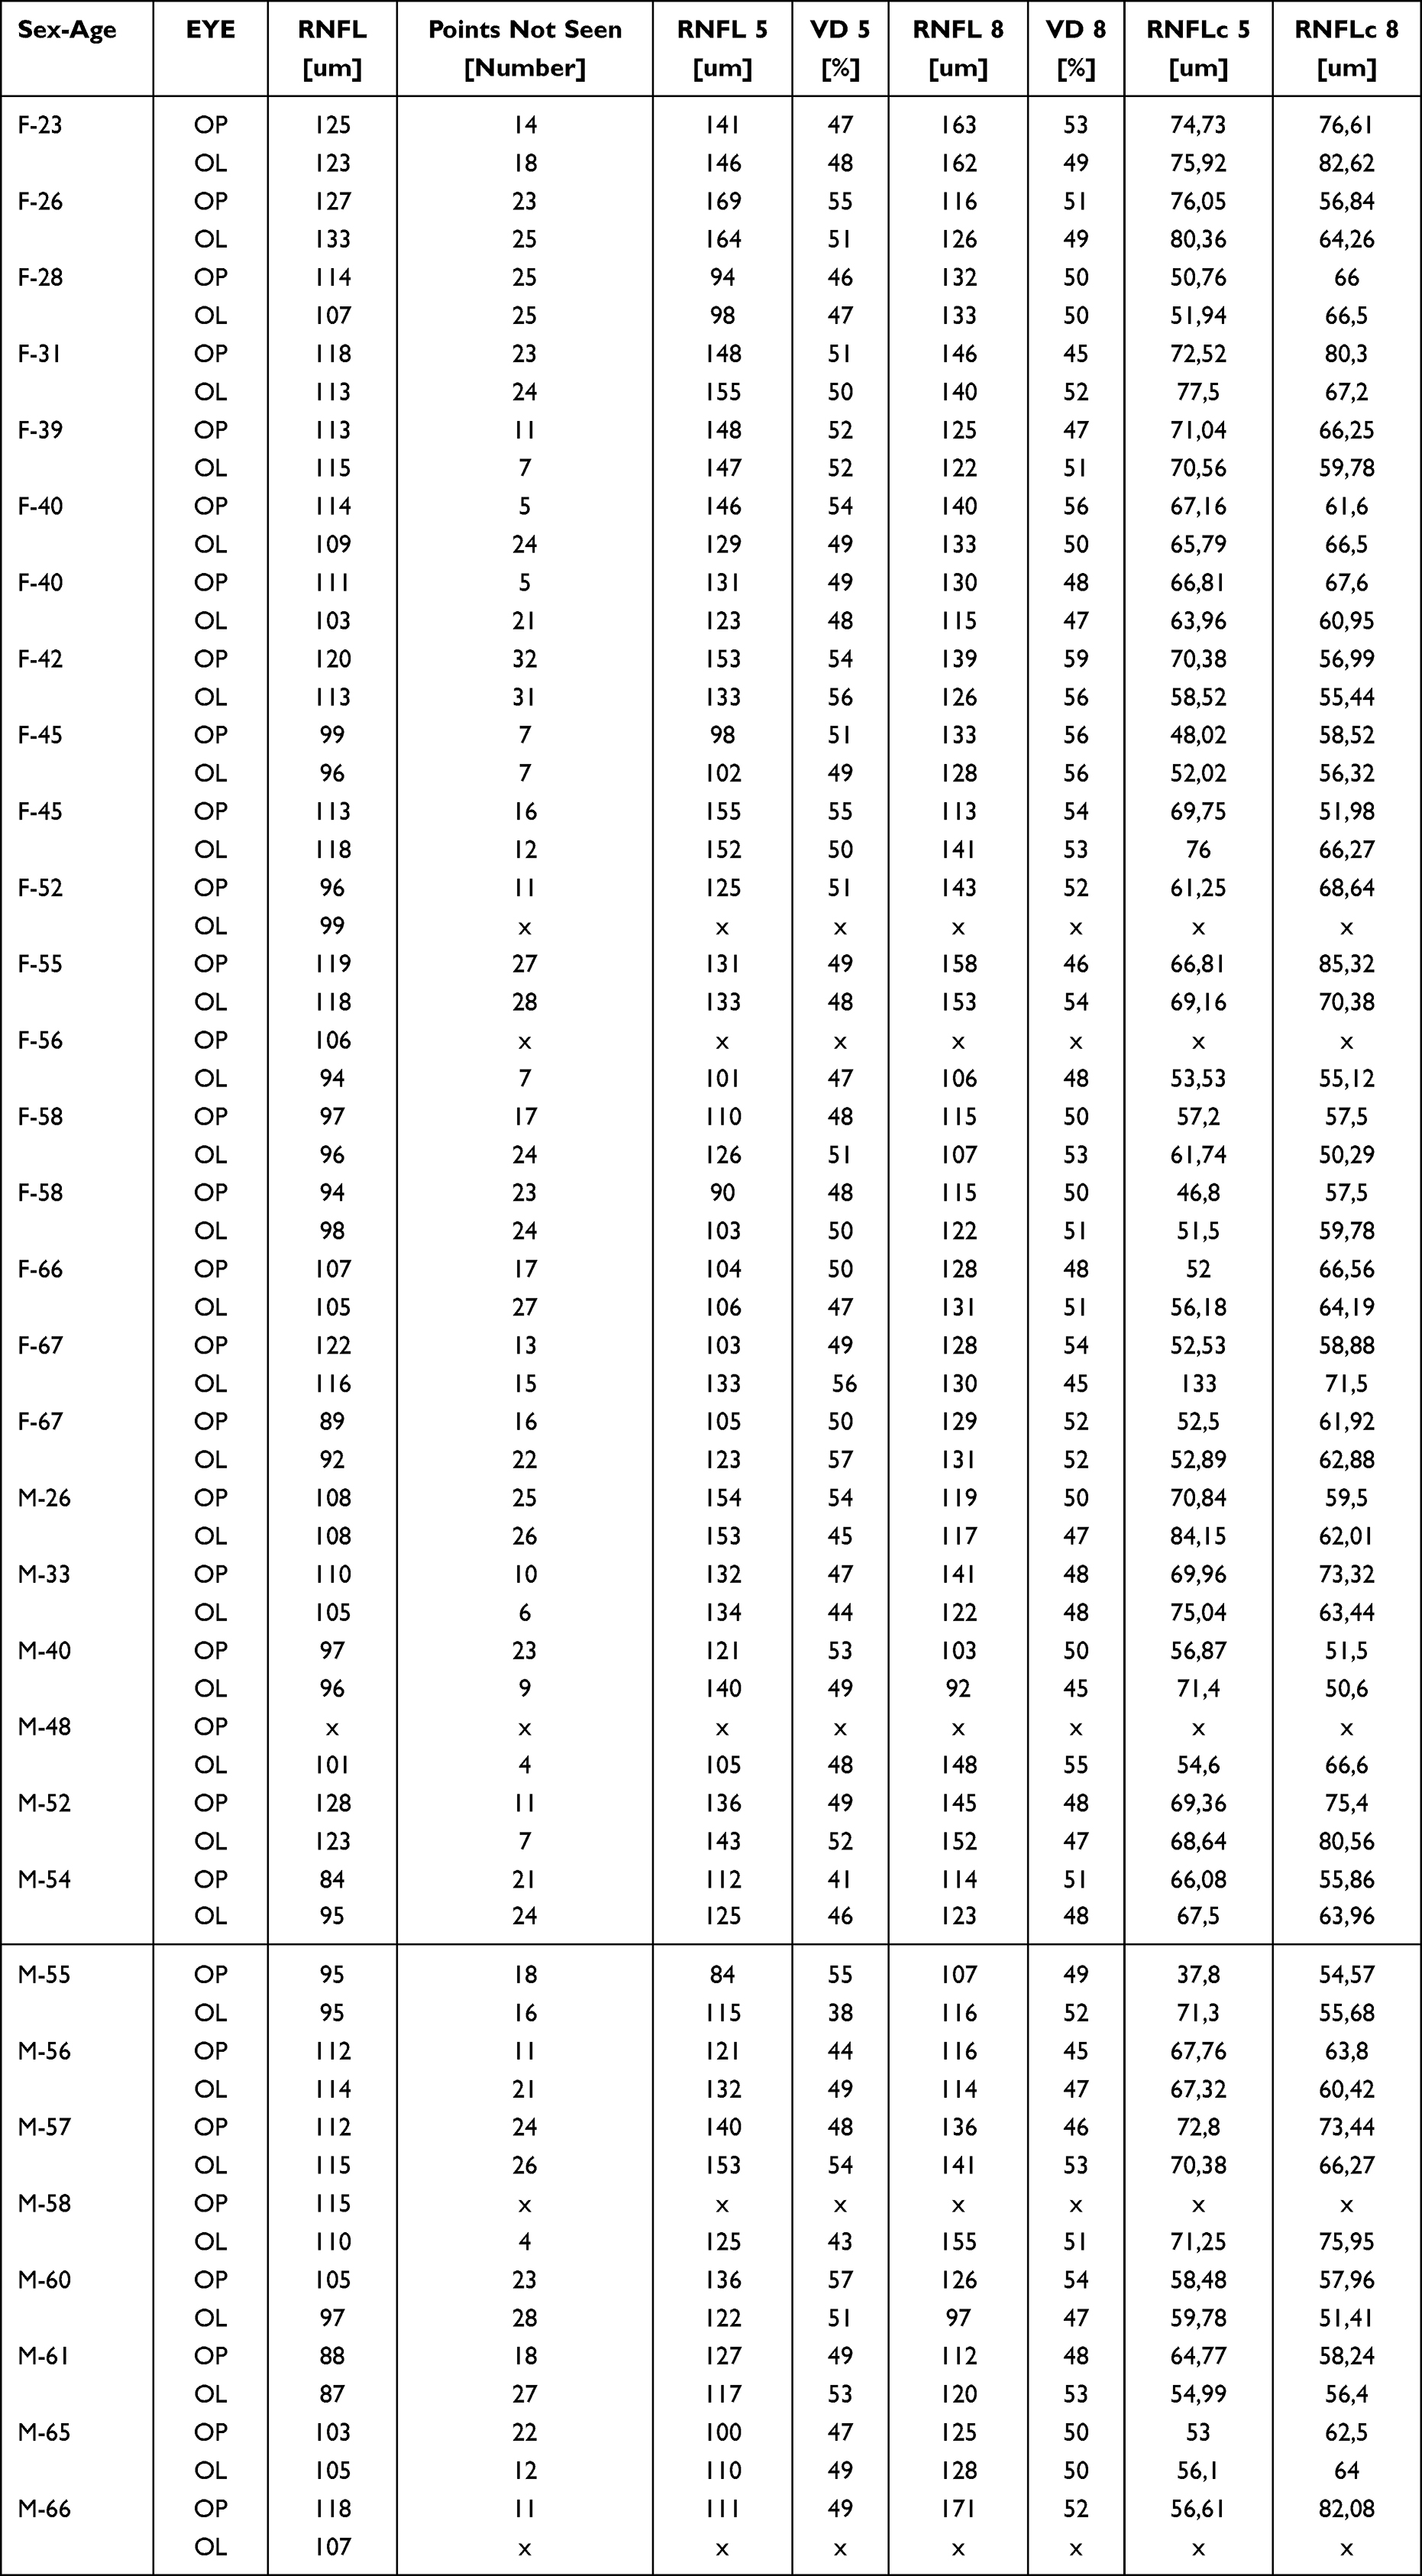 |
Table 1 The Table Summarizes RNFL Data, Number of Unseen Points, VD in Segments 5 (SN) and 8 (IN), RNFL in Segments 5 and 8 and RNFL After Correction in Segments 5 and 8 |
Figures 1 and 2 show the template and the extent of the distal nasal part of the visual field examined and Table 2 presents results of Pearson correlation coefficient.
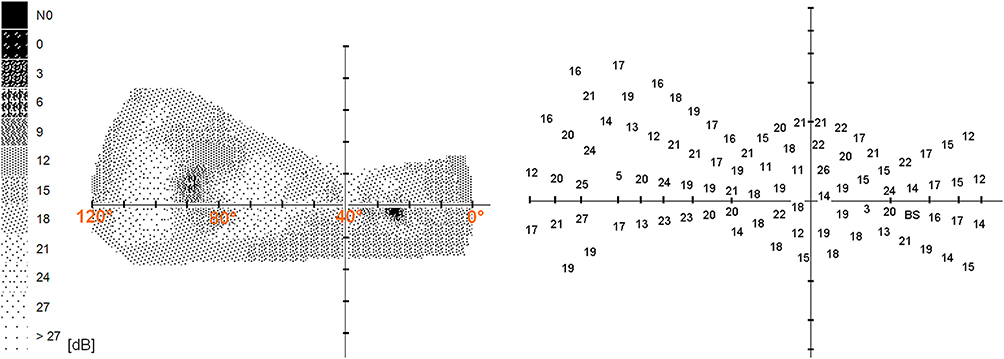 |
Figure 1 Extent of the nasal part of the visual field of the healthy right eye. |
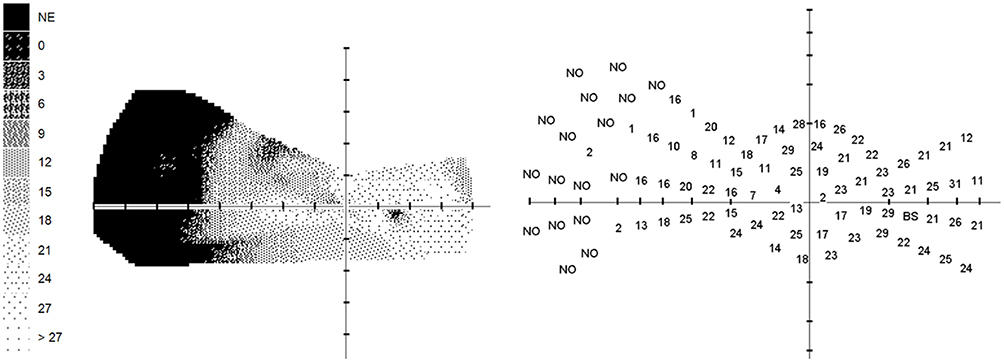 |
Figure 2 Distal nasal part of the visual field in POAG with a 17-point drop out. |
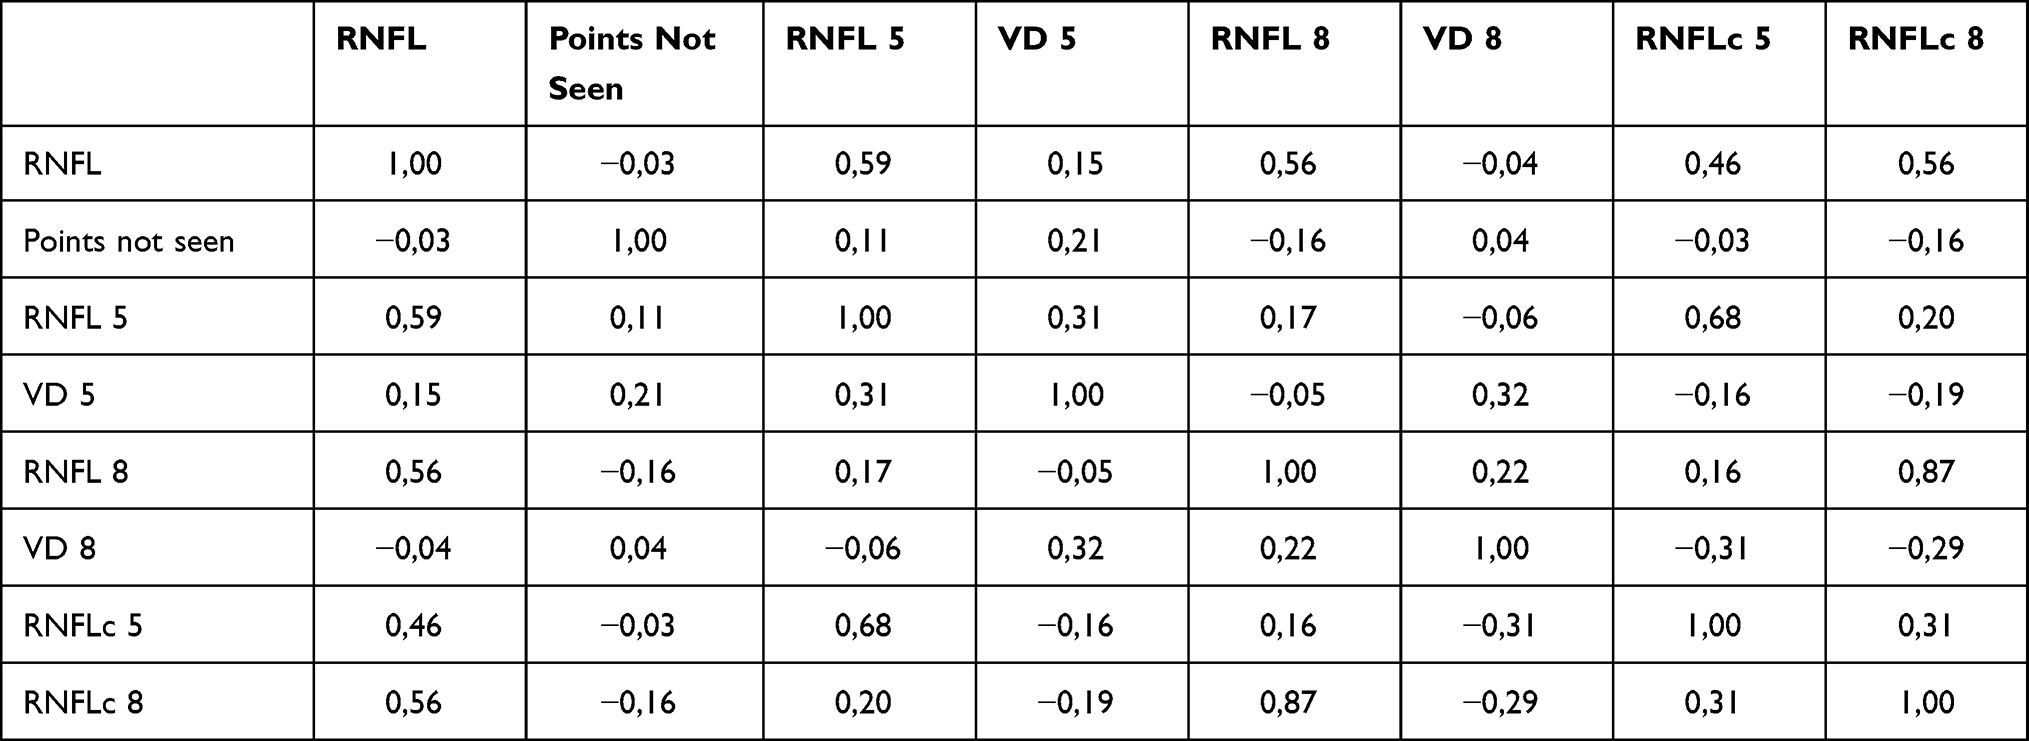 |
Table 2 Results of Pearson Correlation Coefficient. The Value of the Correlation Coefficient r Was Used to Distinguish Between Weak (|r|<0.3), Moderate (0.3<|r|<0.8) and Strong (|r|>0.8) Linear Relationships. All Tests Were Performed at the 5% Level of Significance |
After evaluating the Pearson correlation coefficient, we found no correlation between the number of unseen points and the RNFL value. Similarly, we found no correlation when comparing the number of unseen visual field points with the corrected RNFL value in segment 5 (r = −0.03). A very weak and negative correlation was observed in segment 8 (r = −0.16).
Discussion
The first changes after IOP increase occur in ganglion cells themselves (shrinking of the dendritic tree and the cell’s somata) and that their axons narrow only subsequently was described by Weber et al.18
Similarly, Naskar et al showed in an experimental study that changes at the level of ganglion cells occur earlier than changes in their axons.5
As we mentioned in the introduction of our study, major part of magnocellular ganglion cells die in the early stages. These are located mainly in the periphery of the retina.12
In the temporal periphery of the retina there are three times less ganglion cells than in the nasal part.19
If it is to cover the same area by a smaller number of cells, then their lesions are more prominent in the temporal periphery of the retina.
That the dendritic fields of both parasol (magnocellular) and midget (parvocellular) ganglion cells are smaller in the nasal retina than in the temporal retinal site, which is equidistant from the fovea, has been shown by Perry et al20 and Rodieck et al.21
This means that the loss of the same number of magnocellular cells in the temporal periphery of the retina has a greater functional impact than in the nasal periphery.
Curcio and Allen19 calculated that there should be approximately 10,000 ganglion cells in the inferior temporal quadrant periphery, 16,000 in the superior temporal quadrant periphery, 30,000 in the inferior nasal quadrant periphery, and 48,000 in the superior nasal quadrant periphery.
When we look at the correlation of RNFL after correction with the number of unseen points, we find a weak correlation in the places where axons enter mainly from the inferior temporal periphery (segment 8). Because axons are the strongest here, their change is also most noticeable.
Postmortem examinations have shown that the most susceptible fibers of the optic nerve head appear to fall within an hourglass-shaped zone, with the two widest portions located at the 12th and 6th hours.22,23 These are the SN (5) and IN (8) segments.
The fact that they are mostly magnocellular cell fibers was confirmed by the study of Quigley et al. Optic nerve fibers larger than average died faster than smaller ones although no fibre size was completely spared at any stage of atrophy.8
Magnocellular retinal cells are morphologically characterized not only by large somata and dendritic tree but also by thicker axons.21
Tu et al found that the lower and upper quadrants of the optic nerve target are the most sensitive quadrants to IOP elevation, with the rate of RNFL changes almost parallel to the IOP level.24
In our previous studies, we have also demonstrated damage to retinal ganglion cell fibers in high IOP.15,16
This study showed that there were no changes in total RNFL values when abnormalities were found in the distal nasal part of the visual field. When we compared the visual field results with the VD-corrected RNFL values in segment 5 (SN), we observed no correlation (r = −0.03) and a very weak correlation in segment 8 (r = −0.16).
Thus, we confirmed that magnocellular ganglion cells localized in the temporal half of the retina overtake changes in the RNFL. And not only in the total value but also in the values “cleaned” from VD in the segments where the axons of magnocellular cells enter the target. Another important conclusion of this study is that any ophthalmology department equipped with a suitable perimeter can perform examination of the distal nasal periphery of the visual field. This cannot be done when using the OCT devices. This finding is crucial for early diagnosis of POAG. The introduction of distal nasal visual field examination in patients with POAG suspect and eyes with intraocular hypertension may confirm the diagnosis earlier than previous methods. From our point of view, this could have not only a health but also a social impact. An application for this methodology has been filed with the Patent and Invention Office under the number: PV 2023–150.
Ethic Statement
The Ethics Committee of the Ophthalmology Clinic of the JL FBMI CTU at its meeting on 11 January 2021 discussed the request of the Head of the Ophthalmology Clinic of the JL FBMI CTU about the intention to determine, in patients with different values of intraocular pressure, its influence on vessel densities, nerve fibre layer and visual field. The Commission found that this is not a clinical study, and the non-contact outpatient examinations performed will not affect or interfere with the health of the patient according to the Declaration of Helsinki of the World Medical Association (revised version 1 September 2000), and therefore this plan was not subject to approval by the Ethics Committee. Informed consent to the use of the evaluated data was obtained from the participants with the condition of maintaining anonymity.
Conclusion
Methodology proposing the extension of the horizontal range of the visual field by the distal part of the nasal half of the visual field is of greater importance for the early diagnosis of POAG than the RNFL examination, or corrected RNFL by VD. The results of this study also showed that damage to ganglion cells in the temporal periphery of the retina precedes changes in the RNFL.
Funding
This research received no external funding.
Disclosure
The authors declare no conflict of interest.
References
1. Burgoyne CF, Downs JC, Bellezza AJ, Suh JK, Hart RT. The optic nerve head as a biomechanical structure: a new paradigm for understanding the role of IOP-related stress and strain in the pathophysiology of glaucomatous optic nerve head damage. Prog Retin Eye Res. 2005;24:39–73. doi:10.1016/j.preteyeres.2004.06.001
2. Weinreb RN, Aung T, Medeiros FA. The pathophysiology and treatment of glaucoma: a review. JAMA. 2014;311(18):1901–1911. doi:10.1001/jama.2014.3192
3. Glovinsky Y, Quigley HA, Dunkelberger GR. Retinal ganglion cell loss is size dependent in experimental glaucoma. Invest Ophthalmol Vis Sci. 1991;32:484–491.
4. Morgan JE, Uchida H, Caprioli J. Retinal ganglion cell death in experimental glaucoma. Br J Ophthalmol. 2000;84:303–310. doi:10.1136/bjo.84.3.303
5. Naskar R, Wissing M, Thanos S. Detection of Early Neuron Degeneration and Accompanying Microglial Responses in the Retina of a Rat Model of Glaucoma. Invest Ophthalmol Vis Sci. 2002;43:2962–2968.
6. Shou T, Liu J, Wang W, Zhou Y, Zhao K. Differential dendritic shrinkage of alpha and beta retinal ganglion cells in cats with chronic glaucoma. Invest Ophthalmol Vis Sci. 2003;44:3005–3010. doi:10.1167/iovs.02-0620
7. Mukai R, Park DH, Okunuki Y, et al. Mouse model of ocular hypertension with retinal ganglion cell degeneration. PLoS One. 2019;14(1):e0208713. doi:10.1371/journal.pone.0208713
8. Quigley HA, Dunkelberger GR, Green WR. Chronic human glaucoma causing selectively greater loss of large optic nerve fibers. Ophthalmology. 1988;95(3):357–363. doi:10.1016/S0161-6420(88)33176-3
9. Soto I, Oglesby E, Buckingham BP, et al. Retinal ganglion cells downregulate gene expression and lose their axons within the optic nerve head in a mouse glaucoma model. J Neurosci. 2008;28(2):548–561. doi:10.1523/JNEUROSCI.3714-07.2008
10. Dawson WW, Hawthorne MN, Parmer R, Hope GM, Hueter R. Very large neurons of the inner retina of humans and other mammals. Retina. 1989;9(1):69–74. doi:10.1097/00006982-198909010-00009
11. Dacey DM. Physiology, morphology and spatial densities of identified ganglion cell types in primate retina. Ciba Found Symp. 1994;184:12–28. doi:10.1002/9780470514610.ch2
12. Skalicky SE. Ocular and Visual Physiology Clinical Application. Springer; 2015.
13. Lestak J, Fus M. Visual Field Assessment in Hypertension Glaucoma. Cesk Slov Oftalmol. 2021;77(1):22–26. doi:10.31348/2021/2
14. Lestak J, Fus M, Lestak T, Pitrova S. The far nasal part of the visual field – part II – contribution to the early diagnosis of glaucoma. Cesk Slov Oftalmol. 2023;79:312–316. doi:10.31348/2023/37
15. Lešták J, Fůs M, Král J. The Relationship Between the Thickness of cpRNFL in Segments and Intraocular Pressure. Clin Ophthalmol. 2022;16:3673–3679. doi:10.2147/OPTH.S388936
16. Lešták J, Fůs M, Král J. retinal ganglion cells on the optic nerve disc following vessel density correction at different IOP values. Exp Ther Med. 2023;25(6):261. doi:10.3892/etm.2023.11960
17. Lešták J, Fůs M, Pitrová Š. Peripapillary retinal nerve fiber layer following vessel density correction at different IOP values. Biomed Pap Med Fac Univ Palacky Olomouc Czech Repub. 2024;168:56.
18. Weber AJ, Kaufman PL, Hubbard WC. Morphology of single ganglion cells in the glaucomatous primate retina. Invest Ophthalmol Vis Sci. 1998;39(12):2304–2320.
19. Curcio CA, Allen KA. Topography of ganglion cells in human retina. J Comp Neurol. 1990;300(1):5–25. doi:10.1002/cne.903000103
20. Perry VH, Oehler R, Cowey A. Retinal ganglion cells that project to the dorsal lateral geniculate nucleus in the macaque monkey. Neurosci. 1984;12(4):1101–1123. doi:10.1016/0306-4522(84)90006-X
21. Rodieck RW, Binmoeller KF, Dineen J. Parasol and midget ganglion cells of the human retina. J Comp Neurol. 1985;233(1):115–132. doi:10.1002/cne.902330107
22. Quigley HA, Addicks EM. Regional differences in the structure of the lamina cribrosa and their relation to glaucomatous optic nerve damage. Arch Ophthalmol. 1981;99(1):137–143. doi:10.1001/archopht.1981.03930010139020
23. Quigley HA, Addicks EM, Green WR. Optic nerve damage in human glaucoma: 111. Quantitative correlation of nerve fiber loss and visual field defect in glaucoma, ischemic neuropathy, papilledema, and toxic neuropathy. Arch Ophthalmol. 1982;100:135–146. doi:10.1001/archopht.1982.01030030137016
24. Tu S, Li K, Ding X, Hu D, Li K, Ge J. Relationship between intraocular pressure and retinal nerve fibre thickness loss in a monkey model of chronic ocular hypertension. Eye (Lond). 2019;33(12):1833–1841. doi:10.1038/s41433-019-0484-1
 © 2024 The Author(s). This work is published and licensed by Dove Medical Press Limited. The full terms of this license are available at https://www.dovepress.com/terms.php and incorporate the Creative Commons Attribution - Non Commercial (unported, v3.0) License.
By accessing the work you hereby accept the Terms. Non-commercial uses of the work are permitted without any further permission from Dove Medical Press Limited, provided the work is properly attributed. For permission for commercial use of this work, please see paragraphs 4.2 and 5 of our Terms.
© 2024 The Author(s). This work is published and licensed by Dove Medical Press Limited. The full terms of this license are available at https://www.dovepress.com/terms.php and incorporate the Creative Commons Attribution - Non Commercial (unported, v3.0) License.
By accessing the work you hereby accept the Terms. Non-commercial uses of the work are permitted without any further permission from Dove Medical Press Limited, provided the work is properly attributed. For permission for commercial use of this work, please see paragraphs 4.2 and 5 of our Terms.