Back to Journals » Neuropsychiatric Disease and Treatment » Volume 14
Disrupted interhemispheric functional connectivity in chronic insomnia disorder: a resting-state fMRI study
Authors Zhou F ![]() , Zhao Y
, Zhao Y ![]() , Huang M, Zeng X
, Huang M, Zeng X ![]() , Wang B, Gong H
, Wang B, Gong H
Received 12 January 2018
Accepted for publication 28 March 2018
Published 14 May 2018 Volume 2018:14 Pages 1229—1240
DOI https://doi.org/10.2147/NDT.S162325
Checked for plagiarism Yes
Review by Single anonymous peer review
Peer reviewer comments 2
Editor who approved publication: Professor Wai Kwong Tang
Fuqing Zhou,1,2 Yanlin Zhao,1,2 Muhua Huang,1,2 Xianjun Zeng,1,2 Bo Wang,1,2 Honghan Gong1,2
1Department of Radiology, The First Affiliated Hospital, Nanchang University, Nanchang, China; 2Neuroradiology Lab, Jiangxi Province Medical Imaging Research Institute, Nanchang, China
Background: Abnormalities in both cerebral structure and intrinsic activity have been increasingly reported in patients with chronic insomnia disorder (CID). However, the interhemispheric integration function in CID is still not well understood. Functional homotopy reflects an essential aspect of the intrinsic functional architecture involved in interhemispheric coordination.
Methods: In this study, voxel-mirrored homotopic connectivity (VMHC) was used to analyze the patterns of interhemispheric intrinsic functional connectivity in patients with CID (n=29).
Results: Reduced homotopic connectivity was observed in the middle occipital/posterior middle temporal gyrus in CID patients relative to control subjects. Further analyses demonstrated different insomnia-related heterotopic connectivity patterns in the right and left middle occipital/posterior middle temporal gyrus. Furthermore, within the CID group, the connectivity coefficient within the connectivity network of the middle occipital/posterior middle temporal gyrus was associated with anxiety measures.
Conclusion: Negative significant findings of group differences were found in terms of both the local gray matter density and fractional anisotropy of the white matter skeletal measures in this study; this structural finding, together with the results of VMHC, suggested that disruptions in the intrinsic functional architecture of interhemispheric communication associated with CID can be observed in the absence of detectable microstructural or local morphometric changes in white and gray matter.
Keywords: homotopic connectivity, interhemispheric integration, voxel-mirrored homotopic connectivity, chronic primary insomnia, sleep disorders, resting-state fMRI
Introduction
Chronic insomnia disorder (CID) is one of the most common sleep disturbances, often presenting with difficulties in initiating and/or in maintaining sleep, and the experience of significant daytime consequences, such as fatigue, memory problems, and poor psychosocial function.1 This condition occurs in 6%–10% of the population (especially in women and older adults) and is often associated with a wide range of negative health outcomes and poor quality of life.2 With advances in neuroimaging techniques, functional brain imaging, in particular, has emerged as a useful tool for exploring the neuromechanisms of insomnia and the neural correlates of the associated symptoms.3
Several structural magnetic resonance imaging (MRI) studies4,5 have indicated variant neuro-structural modifications in the hippocampus (Hipp),6 anterior cingulate cortex (ACC),7 and orbitofrontal cortex (OFC);8,9 despite this, there are relative inconsistencies among the available studies. Functional neuroimaging evidence has not only demonstrated hypoperfusion and abnormal metabolism, but also provided evidence of the existence of the hyperarousal of several systems.10,11 Apart from both task-based and resting-state studies, functional MRI (fMRI) has provided further findings, such as hypo-activation or hypo-activity in the prefrontal cortex,12 emotional circuits,13 and working memory areas,14 as well as over-activity in the default mode network (DMN).9 Furthermore, altered local15,16 and remote functional connectivity17 and frequency-dependent changes in low-frequency oscillations (LFO)18 have also been observed in CID patients.
The human brain involves distributed processing and is a complex modular organizational system of which robust homotopic connectivity is a key characteristic, in addition to the organizing principles of the intrinsic functional architecture of the brain across the lifespan.19 Voxel-mirrored homotopic connectivity (VMHC) is designed to quantify the high degree of synchrony in the spontaneous activity of mirrored structures of the brain, likely reflecting the importance of interhemispheric communication in the integration of brain functions that underlie coherent temporal activity and its associated behavior and cognition.19,20 A number of studies have already demonstrated that VMHC is a reliable and reproducible resting-state fMRI (rs-fMRI) metric,19,20 and have revealed aberrant interhemispheric functional connectivity in several neuropsychiatric disorders, including nonclinical depressive symptoms,21 schizophrenia,22 traumatic axonal injury,23 and postherpetic neuralgia.24 In general, the corpus callosum and local neuronal status play central or key roles in mediating this coordination; the former provides fiber connections that straddle both sides of the brain, while the latter impacts the interhemispheric coordination involved in functional coherence.19,25,26
In this study, we hypothesized that alterations in homotopic connectivity may provide a sensitive indicator of the effects on interhemispheric communication inflected by the coherent temporal activity; this result is due to insomnia-associated regional neuronal status in patients with CID. However, there have been no studies that have investigated possible impairments in homotopic resting-state functional connectivity in CID patients so far. In this study, we investigated VMHC in order to reveal potential differences in interhemispheric mirrored connectedness between a group of CID patients and a group of healthy controls (HCs). In addition, we used a seed-based intrinsic functional connectivity analysis to reveal the heterotopic connectivity patterns in seed regions with altered VMHC (flowchart in Figure 1). Briefly, we believe that the interhemispheric intrinsic functional connectivity patterns could reveal abnormalities in the connectedness across the whole brain, which could contribute to an improved understanding of interhemispheric functional coordination in CID patients.
 | Figure 1 A flowchart of VMHC and the influenced connectivity patterns in CID patients. (A) The resting-state fMRI and T1-weighted data were preprocessed. (B and C) The time series of each voxel was extracted using a symmetrical hemisphere template in the MNI space. (D) Then, the VMHC was calculated. (E) The group mean of the VMHC was calculated to show the spatial distribution. (F) Group comparisons of the VMHC and (G) clinical associations in the CID patients were performed. (H) Finally, the network patterns (heterotopic connectivity) that were influenced by the altered VMHC in CID patients are shown. |
Participants and methods
Study participants and clinical assessment
At first, 32 paired gender-, age-, and education level-matched CID patients and HCs who were recruited from the local hospital and community underwent MRI scanning, but only 29 CID patients and 30 HCs were ultimately included due to excessive abnormal white and gray matter (GM) appearances and head movement, respectively.
This study was approved and performed in accordance with the guidelines of the Medical Research Ethics Committee and the Institutional Review Board of the First Affiliated Hospital, Nanchang University, China, and in accordance with the Declaration of Helsinki (2000). All subjects read and signed written informed consent before beginning any of the study procedures.
The inclusion criteria for the CID group were as follows: (1) aged between 25 and 60 years; (2) an independent primary insomnia syndrome, as defined and diagnosed by the Diagnostic and Statistical Manual of Mental Disorders, version 5 (DSM-5) criteria;27 (3) duration of insomnia≥1 year, with sleep difficulty occurring at least 3 nights per week with accompanying distress or daytime dysfunction; and (4) no history of mood disorders or other psychiatric diagnoses and no clinical history of stroke or other severe cerebrovascular diseases, including other diseases revealed by the neuroradiological assessment of the conventional MR images. All CID patients reported difficulty in initiating or maintaining sleep or having non-restorative sleep, and they were free of medications. All the subjects were instructed not to consume caffeine, alcohol, or other specific central nervous system (CNS) medications for 48 h before the scanning.
The exclusion criteria for the CID patients and HCs were as follows: (1) clinical evidence of other sleep disorders, such as restless legs syndrome, narcolepsy, or obstructive sleep apnea; (2) abnormal sleep–wake rhythms determined by sleep–wake cycles of sleep (such as day and night alternating work); (3) severe general medical disorders, including diabetes, hypertension, cerebrovascular disease, heart diseases, or respiratory diseases; (4) other neurological disease, eg, traumatic head injury, local brain lesions, epilepsy, neurodegenerative or psychiatric diseases, including anxiety (Hamilton Anxiety Scale>29), depression (Hamilton Depression Scale>35), psychosis, or illicit alcohol or drug abuse; (5) MRI contraindications, such as metallic implants, claustrophobia or devices in the body; (6) Epworth sleepiness scale show doze off or fall asleep in the fMRI scanning; and (7) MRI data quality that did not meet the requirements, which included head movement in the rs-fMRI data that was less than 2 mm of translation along any axis and less than 2° of angular rotation along any axis.
Each participant underwent a battery of tests that included a detailed clinical interview, physical examination, and clinical follow-up by trained doctoral-level individuals. The Pittsburgh Sleep Quality Index (PSQI) measures sleep quality and disturbances in sleep quality; it includes nine questions (PSQI>5 indicates poor sleep quality) that reflect seven problems of sleep quality, ie, duration of sleep, subjective sleep quality, latency, habitual sleep efficiency, sleep disturbance, the use of sleeping medication, and daytime dysfunction.28 According to the DSM-5 diagnostic criteria and the literature, the State Trait Anxiety Inventory-state (STAI-s), the State Trait Anxiety Inventory-trait (STAI-t), and the Beck Depression Inventory-II (BDI-II) scores were derived from an interview with the participants, which were used to identify state anxiety, trait anxiety, and depression (emotional disorders), respectively.
MRI data acquisition
All the MRI data were acquired with a 3.0 Tesla MRI system (Trio; Siemens, Munich, Germany) at the First Affiliated Hospital, Nanchang University. Resting-state fMRI was performed using an echo planar imaging (EPI) sequence with the following parameters: repetition time/echo time (TR/TE)=2,000 ms/30 ms, matrix=64×64, raw voxel size=3.44×3.44×4 mm, and 30 interleaved axial slices with a 1.2 mm slice gap in each volume. Each functional scan lasted for 8 min. Sagittal high-resolution T1-weighted anatomical images were acquired using a 3-dimensional magnetization-prepared rapid acquisition gradient echo sequence for spatial registration. The parameters were as follows: TR/TE=1,900 ms/2.26 ms, matrix=240×256, FOV=215×230 mm, and 176 slices with 1.0 mm thickness and without a slice gap. Additional conventional T2-weighted and T2-fluid-attenuated inversion recovery (FLAIR) images were acquired of the brain for the diagnosis of each subject.
All subjects were asked to remain awake without systematically thinking and to lie quietly in the scanner with their eyes closed during scanning. At the end of the scanning sessions, in regard to their waking state, all subjects were required to report that they had not fallen asleep during the scan via the Epworth sleepiness scale questionnaire.
MRI data preprocessing
The rs-fMRI data preprocessing was conducted using the Data Processing and Analysis of Brain Imaging (DPABI) v2.1 (http://www.rfmri.org/dpabi) toolbox,29 which is based on the Statistical Parametric Mapping software (SPM12, http://www.fil.ion.ucl.ac.uk/spm/software/spm12/) for the MATLAB platform (The MathWorks Inc., Natick, MA, USA), using a method consistent with protocols of previously published studies.23 The preprocessing steps included the following: (1) discarding of the first 10 images to eliminate any magnetic saturation effects, and the remaining 230 images were used for further preprocessing; (2) slice-time and motion corrections; (3) registration of the high-resolution individual T1-weighted images to the mean functional data; (4) segmentation of the high-resolution T1-weighted images with the Diffeomorphic Anatomical Registration Through Exponentiated Lie Algebra (DARTEL) toolkit (this data also used in the analysis of local gray matter density) and generation of a group template; (5) transformation and normalization of the resulting aligned data to the Montreal Neurological Institute (MNI) space with the segmented information from DARTEL; (6) resampling of the normalized rs-fMRI data to 3×3×3 mm voxels and spatial smoothing with an isotropic 6-mm FWHM Gaussian kernel; (7) nuisance linear regression with the white matter, cerebrospinal fluid, and Friston-24 head motion parameters (including 6 head motion parameters and their historical effects as well as the 12 corresponding squared items);30 and (8) removal of the linear trend and temporal bandpass (0.01–0.1 Hz) filtering.
Finally, each subject was limited to a maximum displacement in any cardinal direction (x, y, z) of less than 2 mm and a maximum rotation (x, y, z) of less than 2° during each rs-fMRI scan. We also evaluated the group differences in head motion between the CID patients and the HCs according to the criteria of Van Dijk et al31 (Table 1).
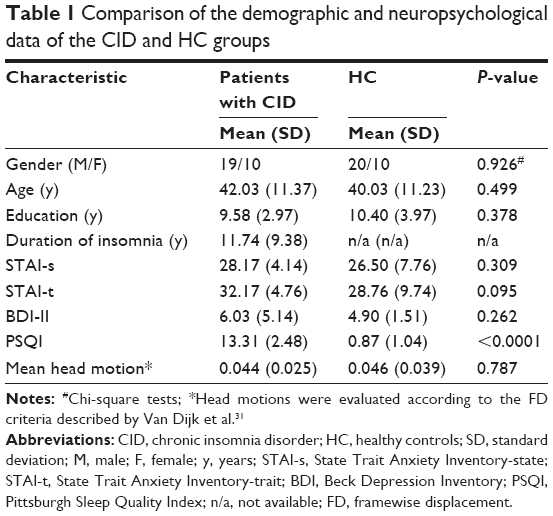 | Table 1 Comparison of the demographic and neuropsychological data of the CID and HC groups |
Calculation of voxel-mirrored homotopic connectivity
To obtain the interhemispheric connectivity at the single-voxel level, VMHC was performed using the DPABI toolkit. A group-specific symmetrical left–right hemisphere template was generated from the normalized T1 image of all subjects to minimize the geometric differences between hemispheres.19 The same transformation of the T1-weighted image was then applied to the individual preprocessed resting-state functional images. For each subject, the homotopic connectivity coefficient was computed as the Pearson correlation between every pair of mirrored interhemispheric voxels’ time series. A group mean of VMHC was calculated to show the spatial distribution in the CID and HC groups.
Heterotopic connectivity pattern in the altered homotopic regions
For the examination of the specific networks that were influenced by homotopic connectivity, regions with altered VMHC were selected as regions of interest (ROIs). The mean time course of each of the ROIs was extracted, and the whole-brain voxelwise Pearson’s correlation coefficient (CC) associated with the mean time series of each ROI was computed. Individual connectivity maps were converted using Fisher’s z-transformation to improve the normality and the group comparison.
Statistical analyses
We compared the demographic and clinical metrics between the two groups using SPSS software (version 18.0; IBM, Armonk, NY, USA). An independent two-sample Student’s t-test was used to compare the differences in age, education, and mean head motion, as well as the PSQI, Beck Depression Inventory-II, STAI-s, and STAI-t scores, and the chi-square test was used to compare the differences in gender (categorical data). P-values<0.05 were considered statistically significant.
After Fisher’s z-transformation, the resultant homotopic correlations were used for subsequent group analyses at the voxel level using SPM12, including general linear model (GLM) two-sample t-tests for the groups of VMHC with the conjunct GM template/mask (with age and gender treated as covariates; voxelwise P<0.001, Gaussian random field (GRF) theory connected cluster level, P<0.05).
We also performed t-tests to compare the global VMHC within a unilateral hemispheric gray matter mask (same VMHC in each pair of homotopic voxels), which was created using the MNI152 gray matter tissue prior in FMRIB’s software library (FSL) (threshold=25% tissue-type probability). The significance threshold was P<0.05 with the Bonferroni multiple comparisons correction.
The individual z-scores of heterotopic connectivity maps were entered into a GLM two-sample t-test in SPM12 to identify the regions of altered connectivity patterns with a significantly altered homotopic region (with age and gender treated as covariates; voxelwise P<0.001, GRF connected cluster level, P<0.05).
The relationships among the VMHC in the altered brain regions, average connectivity coefficient measured in altered VMHC-associated connectivity regions, regional density, and the clinical metrics (disease duration of insomnia and PSQI scores) were evaluated using partial correlation analyses in SPSS for the CID group, with age and gender treated as covariates. The significance level was set to P<0.05.
Discriminant analysis
Regions with significant between-group differences were selected as ROIs for receiver operator characteristic (ROC) measurements to evaluate the ability of the VMHC values from the ROIs to distinguish the CID patients from HCs. A leave-one-out cross-validation (LOOCV) test was used to assess the validity of the results.
Results
Demographics and clinical characteristics
In total, 29 CID patients and 30 well-matched HCs were enrolled for the VMHC analysis in this study, they reported a 0 score on the Epworth sleepiness scale, and their demographic and clinical characteristics are shown in Table 1. Significantly higher PSQI scores were detected in the CID group than in the HC group (t=25.279, P<0.001). The CID and control individuals exhibited no significant differences in terms of the BDI-II (t=1.142, P=0.262), STAI-s (t=1.027, P=0.309), or STAI-t (t=1.695, P=0.095) scores.
Spatial pattern and group comparison of VMHC
Figure 2 shows the spatial distributions of the group means of VMHC for the CID and HC groups, respectively (P<0.001, false discovery rate-corrected). In the CID group, the higher VMHC was mainly distributed in the posterior cingulate cortex (PCC), precuneus (PCUN), ACC, primary visual cortex (V1), and the precentral gyrus (PrCG), with a spatial pattern similar to that of the HC group.
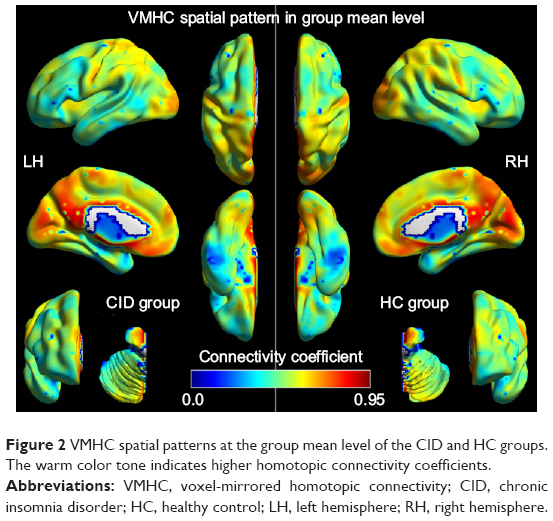 | Figure 2 VMHC spatial patterns at the group mean level of the CID and HC groups. The warm color tone indicates higher homotopic connectivity coefficients. |
The differences in the VMHC between the CID patients and the HCs are shown in Table 2 and Figure 3 (P<0.01, GRF-corrected at a cluster level of P<0.05). The regions with lower VMHC were located in the right and left middle occipital gyri (MOG)/posterior middle temporal gyrus (pMTG), while no higher VMHC values were detected in the CID group. However, no gray matter density changes were observed in the regions with altered VMHC (right and left MOG/pMTG, shown in Figure 3) in either the CID group or the HC group.
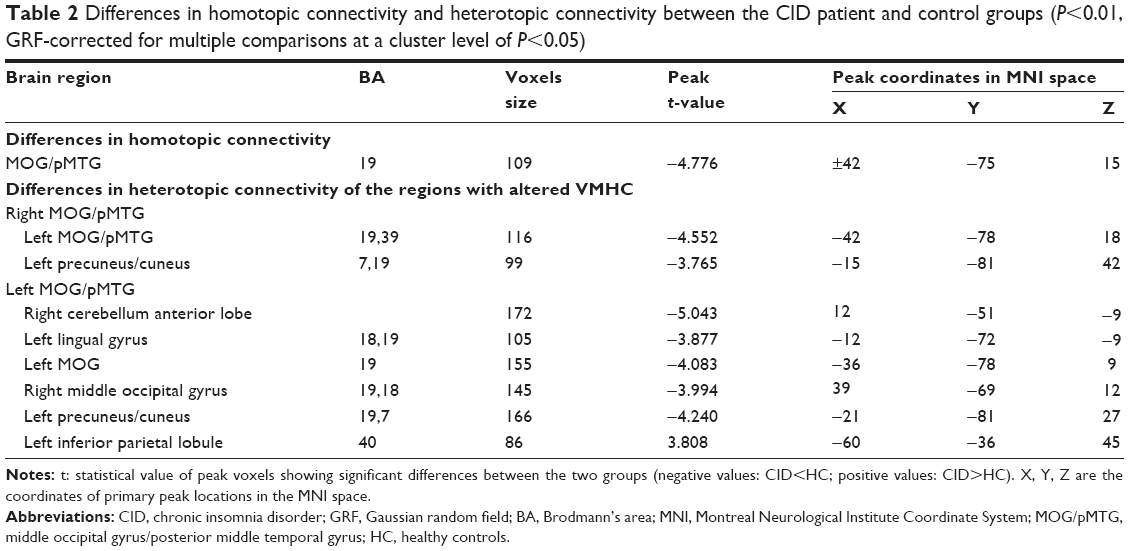 | Table 2 Differences in homotopic connectivity and heterotopic connectivity between the CID patient and control groups (P<0.01, GRF-corrected for multiple comparisons at a cluster level of P<0.05) |
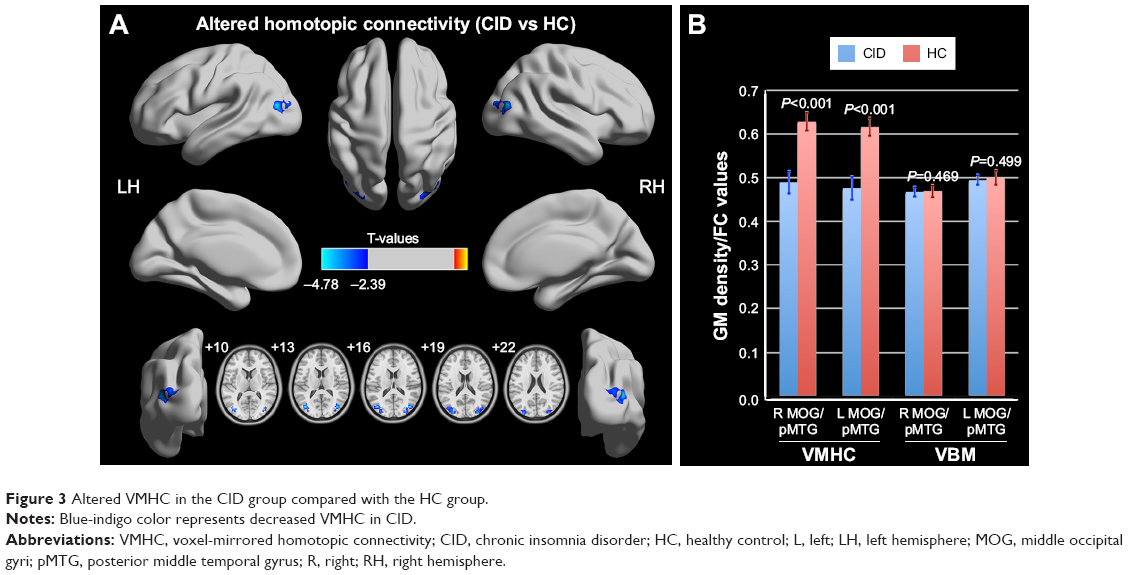 | Figure 3 Altered VMHC in the CID group compared with the HC group. |
Heterotopic connectivity comparison in the regions with altered VMHC
Compared with the HC group, the CID group demonstrated significantly reduced heterotopic connectivity between the right MOG/pMTG and the left MOG/pMTG and the left PCUN/cuneus (PCUN/Cune) (Figure 4A and Table 2, P<0.01, GRF-corrected at a cluster level of P<0.05); significantly reduced the heterotopic connectivity between the left MOG/pMTG and the right cerebellum anterior lobe, left lingual gyrus, left MOG, right MOG, and left PCUN/Cune; and significantly increased the heterotopic connectivity between the left MOG/pMTG and the left inferior parietal lobule (IPL) (Figure 4B and Table 2, P<0.01, GRF-corrected at a cluster level of P<0.05).
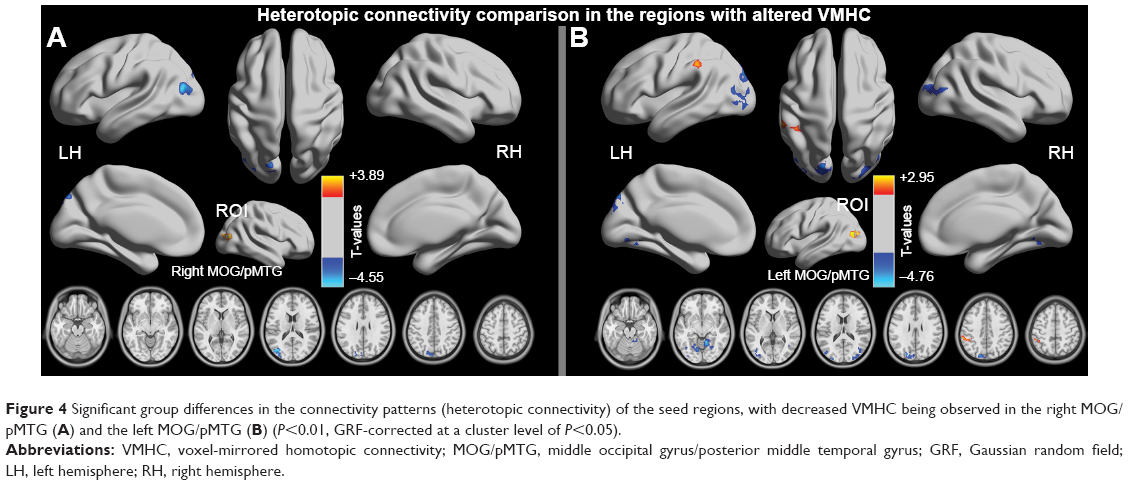 | Figure 4 Significant group differences in the connectivity patterns (heterotopic connectivity) of the seed regions, with decreased VMHC being observed in the right MOG/pMTG (A) and the left MOG/pMTG (B) (P<0.01, GRF-corrected at a cluster level of P<0.05). |
Discriminatory analysis of the VMHC indexes
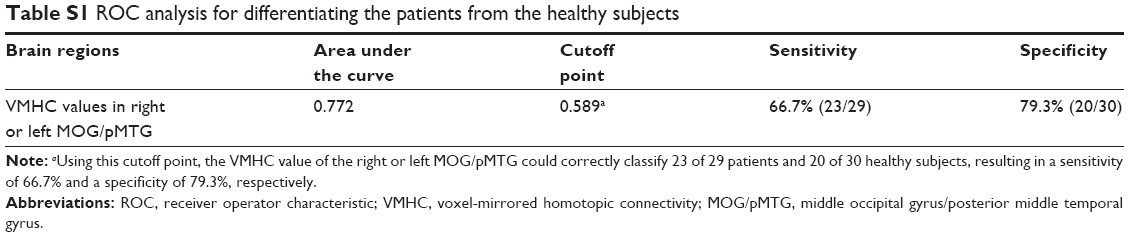
To verify the ability to distinguish the CID patients from the HCs, the mean connectivity coefficients were extracted from the regions with significantly decreased VMHC in the CID patients. The ROC analysis revealed that the areas under the curves (AUCs) for the four regions were 0.772 for the right or left MOG/pMTG (Figure 5 and Table S1 in the Supplementary Materials 1). The LOOCV showed cross-validated AUCs to be 0.772±0.009 (0.764–0.795) for the right or left MOG/pMTG.
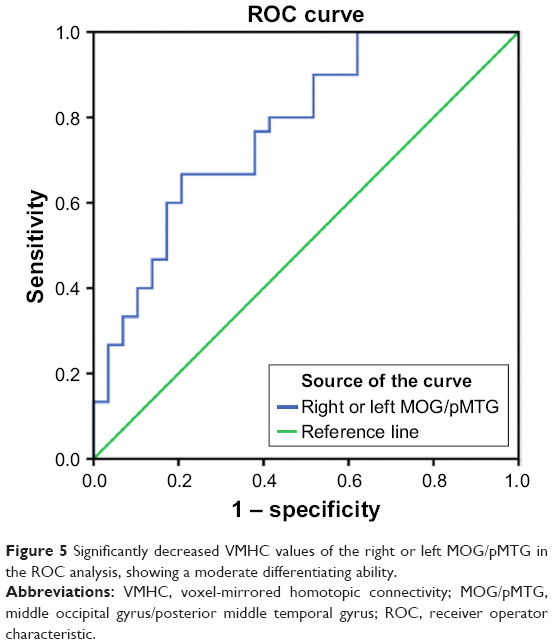 | Figure 5 Significantly decreased VMHC values of the right or left MOG/pMTG in the ROC analysis, showing a moderate differentiating ability. |
Clinical metrics associated with connectivity coefficient in CID patients
In the CID group, no significant relationship was observed between the mean VMHC in the right and left MOG/pMTG and the clinical metrics, such as the local GM density; the disease duration of insomnia; and the STAI-s, STAI-t, BDI-II, or PSQI scores (P=0.135–0.981).
In contrast, several associations of the clinical metrics were observed with the heterotopic connectivity of the right or left MOG/pMTG in the CID patients; specifically, the connectivity coefficients between the right MOG/pMTG and the left PCUN/Cune (P=0.044), the left MOG/pMTG and right cerebellum anterior lobe (P=0.015), the left MOG/pMTG and left lingual gyrus (P=0.004), the left MOG/pMTG and left PCUN/Cune (P=0.010), and the left MOG/pMTG and right MOG (P=0.016) were all negatively related to the STAI-s scores, while the coefficients between the left MOG/pMTG and right cerebellum anterior lobe (P=0.014), the left MOG/pMTG and left lingual gyrus (P=0.039), and the left MOG/pMTG and left PCUN/Cune (P=0.031) were negatively related to the STAI-t scores (Figure 6). No significant relationship was observed between the altered heterotopic connectivity of the right and left MOG/pMTG and other clinical metrics, such as the duration of insomnia (0.148–0.984).
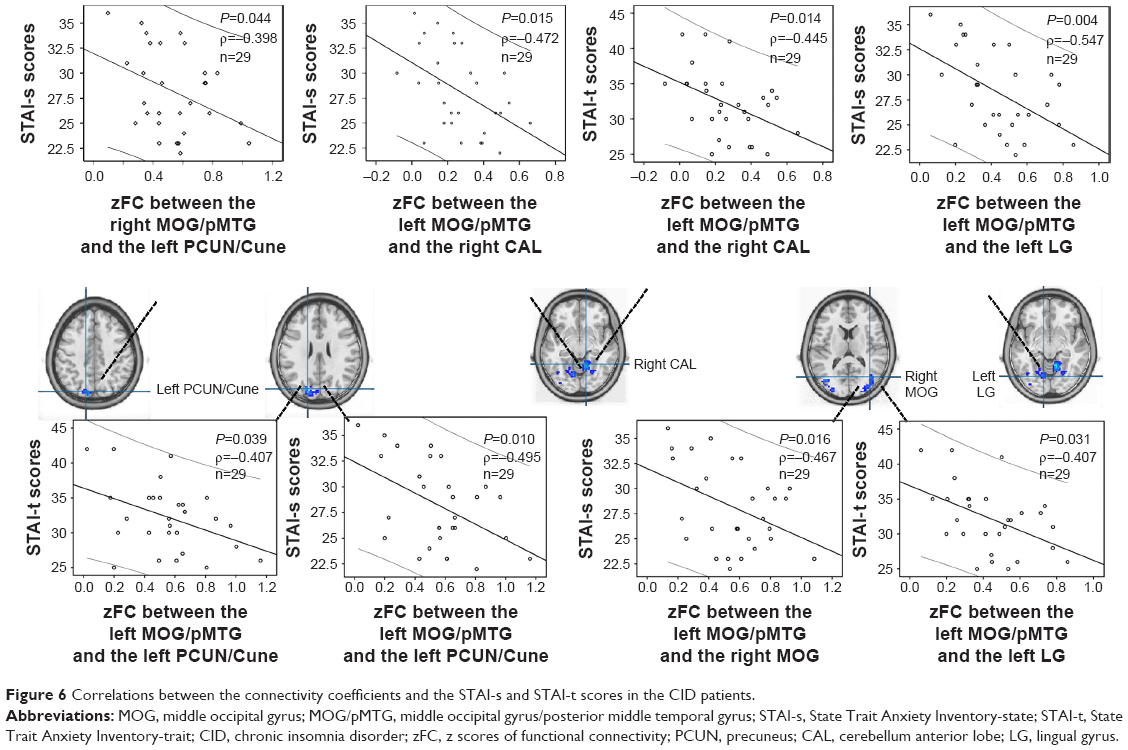 | Figure 6 Correlations between the connectivity coefficients and the STAI-s and STAI-t scores in the CID patients. |
Discussion
To the best of our knowledge, this study is only one of a few to have used VMHC mapping to investigate interhemispheric functional coordination in CID patients.32 Here, three findings should be noted. First, the main finding of this study was the significantly reduced VMHC observed in the right and left MOG/pMTG of the CID patients. Further, the ROC and LOOCV analyses showed a moderate sensitivity and specificity of the homotopic connectivity of the MOG/pMTG as a differentiating indicator. Second, the heterotopic connectivity patterns were different between the right and left MOG/pMTG: decreased interhemispheric connectivity was observed in the right MOG/pMTG, whereas alterations in both the inter- and intra-hemispheric connectivities of the left MOG/pMTG were observed. Third, a significant correlation was observed between the STAI-s and STAI-t scores and the heterotopic connectivity coefficient in the regions with decreased VMHC (left or right MOG/pMTG) in the CID patients.
In this study, we observed only significantly reduced VMHC in the CID patients in the right and left MOG/pMTG. Evidence from functional neuroimaging studies has revealed that one structure of the reduced cluster, the MOG, shows a preference for spatial over non-spatial processing of auditory and tactile stimuli, and category-selective, attention-modulated unconscious processing.33 Another structure, the pMTG, on the other hand, seems to be a part of the traditional sensory language area.34 As far as we know, no structural studies have suggested that the MOG and/or the pMTG have anatomical atrophy or disrupted connectivity via white matter fibers in primary insomnia, including our study (negative finding of white matter fibers in the MOG and/or the pMTG, shown in Figure S1; Supplementary materials 2 show the detailed tract-based spatial statistics [TBSS] analysis). However, in previous fMRI studies, an increased intrinsic activity has been demonstrated in the MOG in CID patients18 and in cases of sleep deprivation,35 but altered homotopic connectivity has not been reported in the MOG or pMTG. In fact, only increased VMHC has been found in healthy participants after sleep deprivation36 or with insomnia symptoms32 in the hyperarousal (thalamus/posterior insula), salience (anterior insula), and visual (fusiform and lingual gyrus) networks. This finding of compensatory increases in homotopic connectivity may initially be adaptive in sleep deprivation or a status of acute insomnia. However, in our study, the insomnia patients have endured a relatively long period with not getting enough sleep and/or daytime symptoms, resulting in disrupted interhemispheric intrinsic functional connectivity at the resting state. Disrupted homotopic connectivity of the MOG and/or the pMTG might link the daytime impairments reported in patients with insomnia, like spatial memory decline and distraction.2,14 Our findings in CID patients are different from those of previous studies of interhemispheric connectivity in sleep deprivation36 or acute insomnia32 subjects. Thus, for the patients who suffer from long-term insomnia, negative findings in terms of both local gray matter densities and fractional anisotropy of white matter skeletal measures, together with decreased VMHC in the MOG/pMTG, have indicated an interhemispheric incoordination in functional coherence.
In the current study, another important finding was the disparate heterotopic connectivity patterns in the right and left MOG/pMTG. A decreased connectivity pattern in the abovementioned regions, along with the altered heterotopic connectivity of the right and left MOG/pMTG, may reflect a functional decline in the processing of emotion-related cognitive functions, whereas higher order cognitive functions, including language and spatial attention, are predominantly lateralized, thus requiring integration of hemispheric information.37 Our analyses showed that significant correlations between both the STAI-s and STAI-t scores and the connectivity coefficient in the insomnia-related heterotopic connectivity of the right and left MOG/pMTG were related to higher levels of anxiety (STAI-s and STAI-t) in the CID patients, which may represent an important factor in anxiety associated with insomnia. In this study, insomnia-related alterations in the homotopic and heterotopic connectivities of the right and left MOG/pMTG together indicated that the reduced interhemispheric coherence observed in patients with CID might be due to a mismatch in the temporal patterns of neuronal intrinsic activity or of the functional statuses of the regions mentioned above.
Finally, the decreased VMHC of the MOG/pMTG could differentiate CID patients from control subjects with moderate sensitivity and specificity. To the best of our knowledge, few studies have attempted to use connectivity metrics from rs-fMRI analyses as a classification tool for diagnosing CID. Hence, the classification results presented here are preliminary because they have not been verified in a separate group. VMHC metrics might be useful for diagnosing or for pattern recognition in CID patients, but further studies are warranted.
In addition, a recent state-of-the-art analysis was used to investigate the physiopathological mechanism in patients with CID, but it should be noted that noninvasive brain stimulation techniques (such as transcranial magnetic stimulation [TMS]) could probe cortical excitability in vivo, in terms of functional connectivity and neurochemical pathways.38 Plasticity phenomena due to TMS might provide a further understanding of the role of neurotransmission pathways and the remodeling of networks, which could be used to explore interhemispheric functional connectivity in CID patients.
This exploratory finding is promising, but some limitations should be noted. First, the sample size of this study was relatively small; thus, the findings will require replication in a larger study. Second, in this study, only three neuropsychological tests were used, and we observed no significant differences in depression or anxiety among the CID patients in this study. In the future, we could include a broader spectrum of tests to evaluate the emotional and cognitive functions of CID patients. Third, the human brain is not symmetrical. We tried to solve this issue by applying a symmetrical structural template and by smoothing the functional data to improve the functional correspondence between homotopic regions. Hence, morphometric asymmetry could not account for the altered VMHC. Fourth, these current results were obtained under a resting condition, without participants’ electroencephalograph state in MRI scanning. Future studies should combine both resting-state and task-based fMRI (with monitoring electroencephalograph) to observe whether the interhemispheric connectivity in the currently reported regions is also disturbed under task conditions or whether this functional status is improved after treatment. Additionally, the underlying mechanisms of altered homotopic connectivity in patients with CID are largely unknown; future research that uses other techniques such as TMS is necessary to clarify the homotopic connectivity mechanisms in CID patients.
Conclusion
In conclusion, this study revealed aberrant homotopic connectivity in the right and left MOG/pMTG in CID patients, with different insomnia-related heterotopic connectivity patterns in these regions with decreased VMHC. Alterations in the homotopic intrinsic connectivity of the MOG/pMTG and the associated heterotopic connectivity may provide a useful and sensitive screening approach for observed chronic insomnia status impacted by interhemispheric communication.
Acknowledgments
The authors would like to thank all of the participants in this study. This study was supported by the National Natural Science Foundation of China (81560284, 81660286, and 81771808); the Natural Science Foundation of Jiangxi, China (20161BAB205245); and the Distinguished Young Scholars of Jiangxi Province (20171BCB23089). The funders had no role in the study design, data collection and analysis, decision to publish, or preparation of the manuscript.
Author contributions
All authors contributed toward the data analysis, as well as the drafting and critical revision of the paper, and agree to be accountable for all aspects of the work.
Disclosure
The authors report no conflicts of interest in this work. None of the authors have any personal or financial involvement with organizations that have financial interest in its content.
References
Benca RM. Diagnosis and treatment of chronic insomnia: a review. Psychiatr Serv. 2005;56(3):332–343. | ||
Medalie L, Cifu AS. Management of chronic insomnia disorder in adults. JAMA. 2017;317(7):762–763. | ||
Chee MW. Functional imaging of primary insomnia: new images and fresh opportunities. Sleep. 2013;36(9):1273–1274. | ||
Joo EY, Noh HJ, Kim JS, et al. Brain gray matter deficits in patients with chronic primary insomnia. Sleep. 2013;36(7):999–1007. | ||
Li S, Tian J, Bauer A, et al. Reduced integrity of right lateralized white matter in patients with primary insomnia: a diffusion-tensor imaging study. Radiology. 2016;280(2):520–528. | ||
Riemann D, Voderholzer U, Spiegelhalder K, et al. Chronic insomnia and MRI-measured hippocampal volumes: a pilot study. Sleep. 2007;30(8):955–958. | ||
Winkelman JW, Plante DT, Schoerning L, et al. Increased rostral anterior cingulate cortex volume in chronic primary insomnia. Sleep. 2013;36(7):991–998. | ||
Altena E, Vrenken H, Van Der Werf YD, van den Heuvel OA, Van Someren EJ. Reduced orbitofrontal and parietal gray matter in chronic insomnia: a voxel-based morphometric study. Biol Psychiatry. 2010;67(2):182–185. | ||
O’Byrne JN, Berman Rosa M, Gouin JP, Dang-Vu TT. Neuroimaging findings in primary insomnia. Pathol Biol. 2014;62(5):262–269. | ||
Kay DB, Buysse DJ. Hyperarousal and beyond: new insights to the pathophysiology of insomnia disorder through functional neuroimaging studies. Brain Sci. 2017;7(3):poi:E23. | ||
Kay DB, Karim HT, Soehner AM, et al. Sleep-wake differences in relative regional cerebral metabolic rate for glucose among patients with insomnia compared to good sleepers. Sleep. 2016;39(10):1779–1794. | ||
Altena E, Van Der Werf YD, Sanz-Arigita EJ, et al. Prefrontal hypoactivation and recovery in insomnia. Sleep. 2008;31(9):1271–1276. | ||
Huang Z, Liang P, Jia X, et al. Abnormal amygdala connectivity in patients with primary insomnia: evidence from resting state fMRI. Eur J Radiol. 2012;81(6):1288–1295. | ||
Drummond SP, Walker M, Almklov E, Campos M, Anderson DE, Straus LD. Neural correlates of working memory performance in primary insomnia. Sleep. 2013;36(9):1307–1316. | ||
Dai XJ, Peng DC, Gong HH, et al. Altered intrinsic regional brain spontaneous activity and subjective sleep quality in patients with chronic primary insomnia: a resting-state fMRI study. Neuropsychiatr Dis Treat. 2014;10:2163–2175. | ||
Wang T, Li S, Jiang G, et al. Regional homogeneity changes in patients with primary insomnia. Eur Radiol. 2016;26(5):1292–1300. | ||
Huang S, Zhou F, Jiang J, et al. Regional impairment of intrinsic functional connectivity strength in patients with chronic primary insomnia. Neuropsychiatr Dis Treat. 2017;13:1449–1462. | ||
Zhou F, Huang S, Zhuang Y, Gao L, Gong H. Frequency-dependent changes in local intrinsic oscillations in chronic primary insomnia: a study of the amplitude of low-frequency fluctuations in the resting state. Neuroimage Clin. 2016;15:458–465. | ||
Zuo XN, Kelly C, Di Martino A, et al. Growing together and growing apart: regional and sex differences in the lifespan developmental trajectories of functional homotopy. J Neurosci. 2010;30(45):15034–15043. | ||
Gee DG, Biswal BB, Kelly C, et al. Low frequency fluctuations reveal integrated and segregated processing among the cerebral hemispheres. NeuroImage. 2011;54(1):517–527. | ||
Wei XH, Ren JL, Liu WH, et al. Increased interhemispheric functional connectivity in college students with non-clinical depressive symptoms in resting state. Neurosci Lett. 2015;589:67–72. | ||
Guo W, Xiao C, Liu G, et al. Decreased resting-state interhemispheric coordination in first-episode, drug-naive paranoid schizophrenia. Prog Neuropsychopharmacol Biol Psychiatry. 2014;48:14–19. | ||
Li J, Gao L, Xie K, et al. Detection of functional homotopy in traumatic axonal injury. Eur Radiol. 2017;27(1):325–335. | ||
Jiang J, Gu L, Bao D, et al. Altered homotopic connectivity in postherpetic neuralgia: a resting state fMRI study. J Pain Res. 2016;9:877–886. | ||
Stark DE, Margulies DS, Shehzad ZE, et al. Regional variation in interhemispheric coordination of intrinsic hemodynamic fluctuations. J Neurosci. 2008;28(51):13754–13764. | ||
Agosta F, Galantucci S, Riva N, et al. Intrahemispheric and interhemispheric structural network abnormalities in PLS and ALS. Hum Brain Mapp. 2014;35(4):1710–1722. | ||
Reynolds CF 3rd, O’Hara R. DSM-5 sleep-wake disorders classification: overview for use in clinical practice. Am J Psychiatry. 2013;170(10):1099–1101. | ||
Ong JC, Cardé NB, Gross JJ, Manber R. A two-dimensional approach to assessing affective states in good and poor sleepers. J Sleep Res. 2011;20(4):606–610. | ||
Yan CG, Wang XD, Zuo XN, Zang YF. DPABI: data processing & analysis for (resting-state) brain imaging. Neuroinformatics. 2016;14(3):339–351. | ||
Yan CG, Craddock RC, Zuo XN, Zang YF, Milham MP. Standardizing the intrinsic brain: towards robust measurement of inter-individual variation in 1000 functional connectomes. NeuroImage. 2013;80:246–262. | ||
Van Dijk KR, Sabuncu MR, Buckner RL. The influence of head motion on intrinsic functional connectivity MRI. NeuroImage. 2012;59(1):431–438. | ||
Li X, Guo S, Wang C, Wang B, Sun H, Zhang X. Increased interhemispheric resting-state functional connectivity in healthy participants with insomnia symptoms. Medicine. 2017;96(27):e7037. | ||
Tu S, Qiu J, Martens U, Zhang Q. Category-selective attention modulates unconscious processes in the middle occipital gyrus. Conscious Cogn. 2013;22(2):479–485. | ||
Xu J, Wang J, Fan L, et al. Tractography-based parcellation of the human middle temporal gyrus. Sci Rep. 2015;5:18883. | ||
Gao L, Bai L, Zhang Y, et al. Frequency-dependent changes of local resting oscillations in sleep-deprived brain. PLoS One. 2015;10(3):e0120323. | ||
Zhu Y, Feng Z, Xu J, et al. Increased interhemispheric resting-state functional connectivity after sleep deprivation: a resting-state fMRI study. Brain Imaging Behav. 2016;10(3):911–919. | ||
Toga AW, Thompson PM. Mapping brain asymmetry. Nat Rev Neurosci. 2003;4(1):37–48. | ||
Lanza G, Cantone M, Lanuzza B, et al. Distinctive patterns of cortical excitability to transcranial magnetic stimulation in obstructive sleep apnea syndrome, restless legs syndrome, insomnia, and sleep deprivation. Sleep Med Rev. 2015;19:39–50. |
Supplementary material 1: supplementary table
 | Table S1 ROC analysis for differentiating the patients from the healthy subjects |
Supplementary material 2: TBSS analysis of diffusion tensor imaging
Data acquisition of diffusion tensor imaging (DTI)
A SIEMENS Trio 3.0 Tesla MRI scanner was used to acquire the DTI images. DTI scans were acquired using an echo planar imaging sequence: TR/TE=7,200/104 ms; matrix=128×128; FOV=230×230 mm; number of slices=49; slice thickness=2.5 mm; orientation=axial; NEX=2; 64 nonlinear diffusion weighting gradient directions with b=1,000 s/mm2 and one additional image without diffusion weighting (ie, b=0 s/mm2).
Processing of the DTI data and tract-based spatial statistics (TBSS) analysis
The DTI data analysis was performed using the FSL program tract-based spatial statistics. The analysis is briefly described as follows: each participant’s DTI data were concatenated and corrected for eddy currents and motion using FMRIB’s diffusion toolbox (FDT v2.0; http://fsl.fmrib.ox.ac.uk/fsl/fslwiki/FDT), and DTIFIT was used to fit a single tensor model at each voxel of the preprocessed eddy current-corrected diffusion weighted data for reconstruction of the FA maps for each subject.
Tract-based spatial statistics of the FA images were carried out using TBSS in the FMRIB software library. For a detailed description of the methods, see https://fsl.fmrib.ox.ac.uk/fsl/fslwiki/TBSS. In this study, voxelwise group comparisons were performed using nonparametric, two-sample t-tests between the CID and HC groups after controlling for the effect of age.
Result of the TBSS analysis
Voxelwise nonparametric group comparisons of the skeletonized FA data revealed no significant group differences. Even when the age and sex covariates were removed (P<0.05, FWE-corrected for multiple comparisons), only slightly decreased FA values were observed in the right anterior corona radiate, bilateral posterior limbs of the internal capsule, and bilateral body of the corpus callosum (P<0.05, without correction).
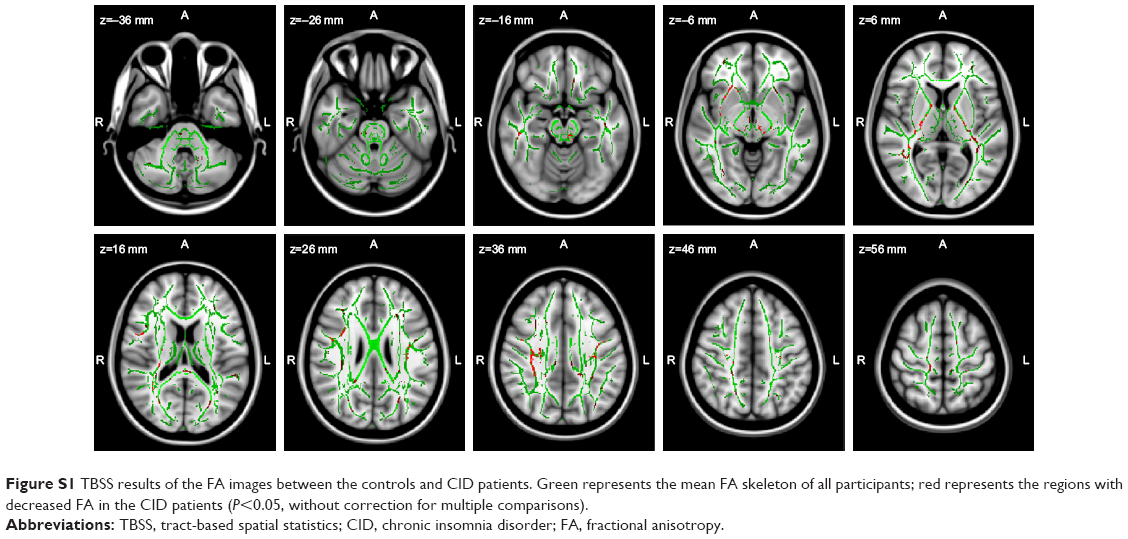 | Figure S1 TBSS results of the FA images between the controls and CID patients. Green represents the mean FA skeleton of all participants; red represents the regions with decreased FA in the CID patients (P<0.05, without correction for multiple comparisons). |
 © 2018 The Author(s). This work is published and licensed by Dove Medical Press Limited. The
full terms of this license are available at https://www.dovepress.com/terms
and incorporate the Creative Commons Attribution
- Non Commercial (unported, 3.0) License.
By accessing the work you hereby accept the Terms. Non-commercial uses of the work are permitted
without any further permission from Dove Medical Press Limited, provided the work is properly
attributed. For permission for commercial use of this work, please see paragraphs 4.2 and 5 of our Terms.
© 2018 The Author(s). This work is published and licensed by Dove Medical Press Limited. The
full terms of this license are available at https://www.dovepress.com/terms
and incorporate the Creative Commons Attribution
- Non Commercial (unported, 3.0) License.
By accessing the work you hereby accept the Terms. Non-commercial uses of the work are permitted
without any further permission from Dove Medical Press Limited, provided the work is properly
attributed. For permission for commercial use of this work, please see paragraphs 4.2 and 5 of our Terms.