Back to Journals » Neuropsychiatric Disease and Treatment » Volume 12
Discriminating poststroke depression from stroke by nuclear magnetic resonance spectroscopy-based metabonomic analysis
Authors Xiao J, Zhang J, Sun D, Wang L, Yu L, Wu H, Wang D, Qiu X
Received 15 April 2016
Accepted for publication 9 May 2016
Published 2 August 2016 Volume 2016:12 Pages 1919—1925
DOI https://doi.org/10.2147/NDT.S110613
Checked for plagiarism Yes
Review by Single anonymous peer review
Peer reviewer comments 3
Editor who approved publication: Professor Wai Kwong Tang
Jianqi Xiao,1,* Jie Zhang,2,* Dan Sun,3,* Lin Wang,4,* Lijun Yu,5 Hongjing Wu,5 Dan Wang,5 Xuerong Qiu5
1Department of Neurosurgery, The First Hospital of Qiqihar City, Qiqihar, 2Department of Internal Medicine, Central Hospital of Jiamusi City, Jiamusi, 3Department of Geriatrics, General Hospital of Daqing Oil Field, Daqing, 4Department of Nursing, 5Department of Neurology, The First Hospital of Qiqihar City, Qiqihar, Heilongjiang, People’s Republic of China
*These authors contributed equally to this work
Abstract: Poststroke depression (PSD), the most common psychiatric disease that stroke survivors face, is estimated to affect ~30% of poststroke patients. However, there are still no objective methods to diagnose PSD. In this study, to explore the differential metabolites in the urine of PSD subjects and to identify a potential biomarker panel for PSD diagnosis, the nuclear magnetic resonance-based metabonomic method was applied. Ten differential metabolites responsible for discriminating PSD subjects from healthy control (HC) and stroke subjects were found, and five of these metabolites were identified as potential biomarkers (lactate, α-hydroxybutyrate, phenylalanine, formate, and arabinitol). The panel consisting of these five metabolites provided excellent performance in discriminating PSD subjects from HC and stroke subjects, achieving an area under the receiver operating characteristic curve of 0.946 in the training set (43 HC, 45 stroke, and 62 PSD subjects). Moreover, this panel could classify the blinded samples from the test set (31 HC, 33 stroke, and 32 PSD subjects) with an area under the curve of 0.946. These results laid a foundation for the future development of urine-based objective methods for PSD diagnosis and investigation of PSD pathogenesis.
Keywords: poststroke depression, PSD, stroke, nuclear magnetic resonance, NMR, metabonomic
Introduction
Poststroke depression (PSD), the most common psychiatric disease that stroke survivors face, is estimated to affect ~30% of poststroke patients.1,2 Researchers reported that there were 7.5 million stroke survivors in the People’s Republic of China, and the number of PSD patients was ~3 million.3 PSD has deleterious effects on the cognitive and motivation functions of patients and negatively impacts the functional recovery.4 A previous study found that the improvement in depressive symptoms in poststroke patients was associated with better recovery in activities of daily living.5 Thus, an early and accurate diagnosis of PSD is very important.
However, there are still no objective laboratory-based tests to diagnose PSD until now. Currently, PSD diagnosis still relies on the subjective identification of the clinical symptoms, according to the Diagnostic and Statistical Manual of Mental Disorders, fourth edition (DSM-IV) criteria.6 However, this method often results in a considerable error rate in clinical practice, due to the highly clinical heterogeneity of depression. To address this issue, there is an urgent need to develop an objective laboratory-based test for PSD diagnosis.
Metabonomics – the analysis of expression of metabolites in biosamples – could help us better understand the pathophysiological mechanisms of diseases and aid in the development of diagnostic tools.7,8 At present, three major analytical techniques are suited for nontargeted metabonomic mapping, including nuclear magnetic resonance (NMR) spectroscopy, gas chromatography–mass spectroscopy, and liquid chromatography–mass spectroscopy.9 Many researchers have successfully used metabonomics to identify some potential biomarkers for psychiatry disorders, such as depression, bipolar disorder, and schizophrenia.10–12 Meanwhile, Jung et al13 reported that there were urinary metabolic abnormalities in stroke patients. These studies indicated that it was possible to use metabonomics to discriminate PSD patients from stroke patients. Therefore, in this study, an NMR spectroscopy combined with multivariate pattern recognition techniques was used to profile the metabolites in urine samples from PSD patients and stroke patients, in order to identify potential biomarkers for PSD diagnosis.
Patients and methods
Study subjects
Totally, 94 PSD and 78 stroke patients were recruited in the Department of Neurology of The First Hospital of Qiqihar City and Central Hospital of Jiamusi City between April 2013 and March 2015. Patients with hemorrhagic or ischemic stroke were included. The stroke diagnosis was performed by a neurologist according to the World Health Organization criteria and confirmed by magnetic resonance imaging.14 The depression diagnosis was performed by a trained psychologist according to the DSM-IV criteria. The Hamilton Depression Rating Scale was used to assess the severity of depressive symptoms, and the included PSD patients had a score >8.15 The PSD and stroke patients who met the following criteria were excluded: 1) preexisting depression prior to stroke; 2) unable to complete the clinical psychological test; 3) concomitant with Parkinson’s disease, inflammatory diseases, psychiatric illness, or severe physical diseases; and 4) illicit drug use or alcohol abuse. Additionally, 74 healthy control (HC) subjects who were without previous lifetime history of DSM-IV Axis I/II and neurological or systemic medical illness were recruited. The clinical characteristics of the included PSD, stroke, and HC subjects are shown in Table 1. Written informed consents were provided by all included subjects. The ethical committee of The First Hospital of Qiqihar City reviewed and approved this study.
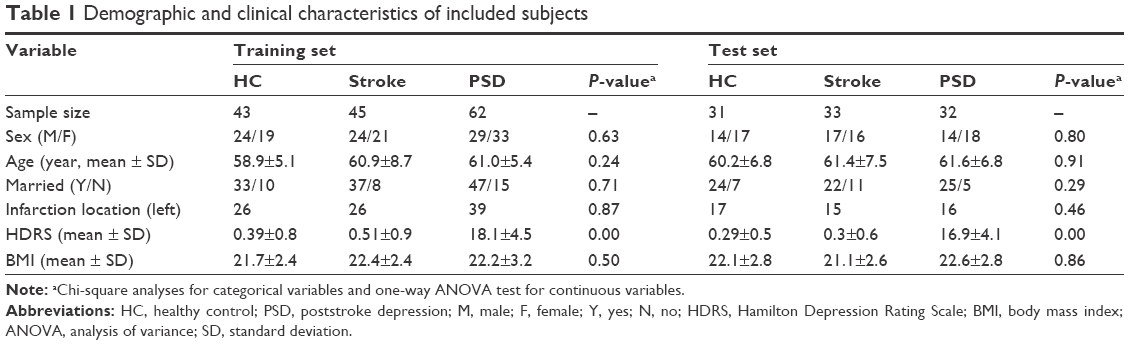 | Table 1 Demographic and clinical characteristics of included subjects |
Sample collection
Urine samples were collected in a sterile cup between 8 am and 10 am after overnight fasting and immediately placed on ice. The samples were centrifuged at 1,500× g for 10 minutes at normal temperature. The resultant supernatant was immediately aliquoted and stored at −80°C. These procedures were completed within 1 hour of collection.
NMR acquisition
The procedure for NMR was performed referring to a previous study.16 Briefly, there were seven steps: 1) thawing the samples and centrifuging at 1,500 g for 10 minutes; 2) mixing 500 μL sample and 100 μL phosphate buffer and centrifuging at 12,000 rpm for 10 minutes; 3) collecting proton spectra using a Bruker Avance II 600 spectrometer (600.13 MHz 1H frequency); 4) passing the obtained spectra and baseline referenced to TSP resonance at δ0.0; 5) removing the spectral regions of urea and water resonances (δ4.13–6.8); 6) segmenting the spectra into equal widths using the AMIX package; 6) normalizing the spectral segments in each NMR spectrum to the total sum of the spectral intensity; and 7) importing the normalized integral values into the SIMCA-P 12.0 software.
Multivariate pattern recognition
Orthogonal partial least-squares discriminant analysis (OPLS-DA) was used to visualize the discrimination between PSD and stroke/HC subjects. The two parameters (R2Y and Q2Y) were used to assess the quality of the built OPLS-DA model. The 199-iteration permutation test was used to rule out the nonrandomness of separation. The coefficient loading plot of the built OPLS-DA model was used to identify the important metabolites contributing to the separation. Based on the number of samples, a correlation coefficient of |r|>0.250 (equivalent to a P-value of <0.05) was adopted as a cut-off value. The multivariate logistic regression analysis was used to identify a potential and simplest biomarker panel for PSD diagnosis. The receiver operating characteristic (ROC) curve analysis was used to assess the diagnostic performance of the identified panel. The workflow of this work is described in Figure 1.
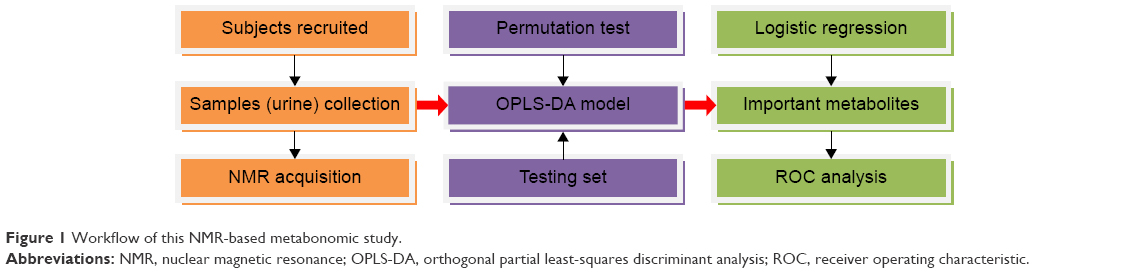 | Figure 1 Workflow of this NMR-based metabonomic study. |
Statistical analysis
Mean and standard deviation were used to express the data characterized by a normal distribution. Chi-squared test or one-way analysis of variance (ANOVA) was used when appropriate. If there was a significant difference, Bonferroni or Tamhane’s T2 post hoc test was applied to determine which two groups differed significantly according to the equal variance criterion. For all analyses, P-value <0.05 was considered to be statistically significant.
Results
Metabonomic analysis
OPLS-DA analysis was used to identify the significantly different metabolites in the urine of PSD subjects compared to stroke and HC subjects. In the training set (43 HC, 45 stroke, and 62 PSD subjects), the score plot of the built OPLS-DA model showed that PSD subjects were distinguishable from stroke and HC subjects with little overlap (Figure 2A). The values of R2Y cum (0.79) and Q2Y (0.65) indicated that this model had a good goodness of fit and predictability. Moreover, the 199-iteration permutation test showed that this model was valid as the corresponding permutated values of R2 and Q2 were significantly lower than the original values (Figure 2B). In order to validate the discrimination power of this model, the testing set (31 HC, 33 stroke, and 32 PSD subjects) was used. The T-predicted scatter plot from the built OPLS-DA model showed that only ten of the 64 (15.6%) nondepressed subjects (HC and stroke subjects; Figure 3A) were predicted as PSD subjects and 29 of the 32 PSD subjects (90.6%) were correctly predicted (Figure 3B), yielding a predictive accuracy of 86.4%. These results demonstrated that this model generated by the urinary metabolite profiling might become an empirical diagnostic tool for PSD.
 | Figure 2 Built OPLS-DA model with the training set and validated with the permutation test. |
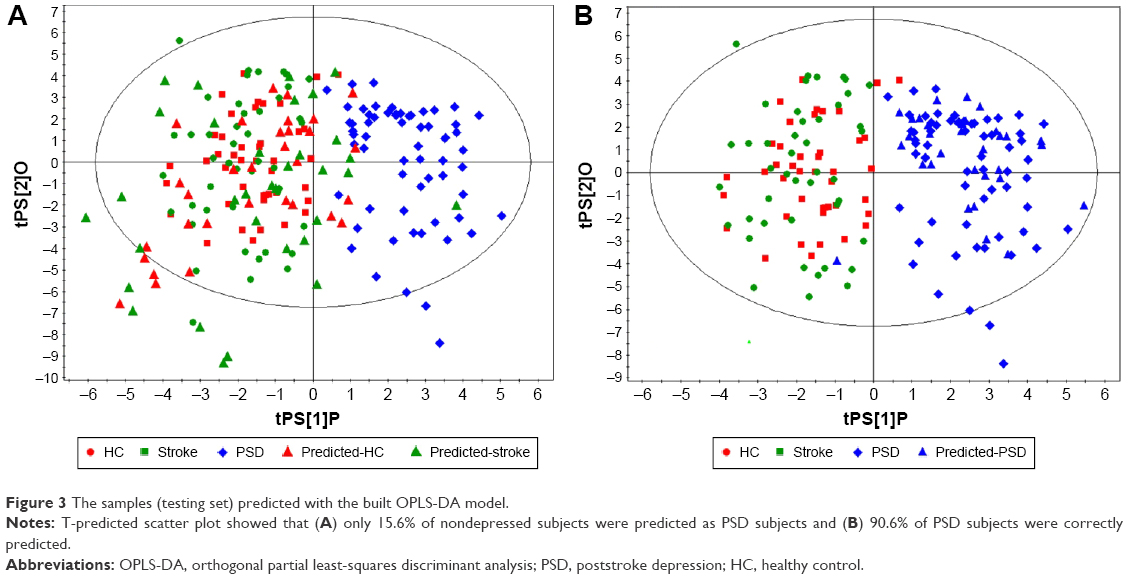 | Figure 3 The samples (testing set) predicted with the built OPLS-DA model. |
Differential metabolites
By analyzing the loading coefficient plot of the built OPLS-DA model, ten differential metabolites (|r|>0.250) responsible for the separation of PSD subjects from stroke and HC subjects were identified. Compared to stroke and HC subjects, the levels of the following five metabolites were significantly increased in the urine of PSD subjects: carnosine, arabinitol, α-glucose, phenylalanine, and formate. The levels of the following five metabolites were significantly decreased in the urine of PSD subjects: glutamate, lactate, α-hydroxybutyrate, sarcosine, and acetamide. Meanwhile, the one-way ANOVA was used to validate the metabolites identified by the multivariate statistical analysis. The results showed that the majority of the identified metabolites remained significantly changed (Table 2).
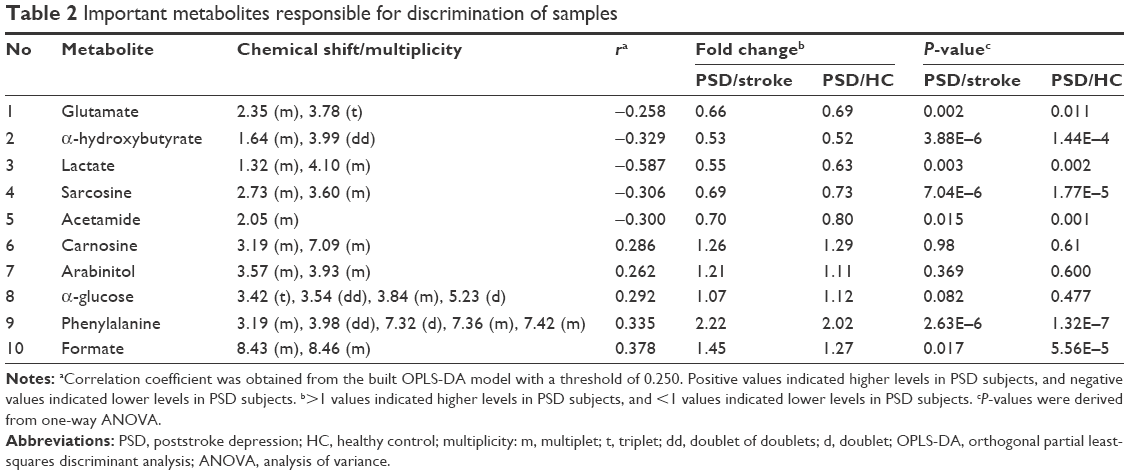 | Table 2 Important metabolites responsible for discrimination of samples |
Important metabolites
In clinical practice, quantitative measuring of the total ten metabolites was not very convenient and economical. Therefore, the multivariate logistic regression analysis was performed to further decrease the number of metabolites used to diagnose PSD. The forward stepwise regression search algorithm based on Akaike information criterion (AIC) was used. The results demonstrated that the most significant deviations between PSD subjects and HC/stroke subjects could be described by the following five metabolites: lactate, α-hydroxybutyrate, phenylalanine, formate, and arabinitol (Figure 4). These five metabolites could yield a diagnostic accuracy of 83.9% in the training set and a predictive accuracy of 81.3% in the testing set for PSD diagnosis.
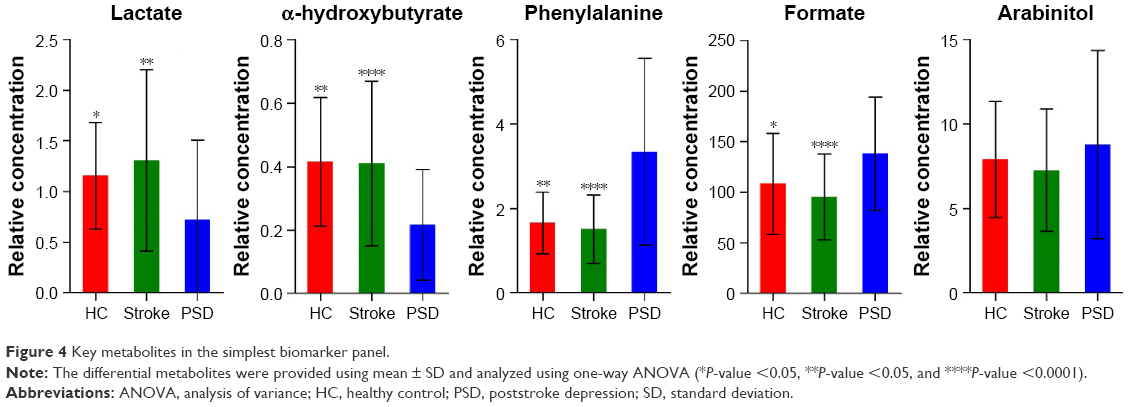 | Figure 4 Key metabolites in the simplest biomarker panel. |
ROC analysis
To assess the diagnostic performance of the potential biomarker panel consisting of the five identified important metabolites by AIC rule (Figure 5A), ROC analysis was performed. The value of the area under the curve (AUC) was viewed as the assessment index. Generally speaking, the AUC value of 1.0 represented the best diagnostic performance, while the AUC value of 0.5–0.75 represented the weakly diagnostic performance. Here, the AUC value of this panel was 0.946 (95% confidence interval: 0.912–0.979, P<0.0001) in the training set (Figure 5B) and 0.946 (95% confidence interval: 0.906–0.987, P<0.0001) in the testing set (Figure 5C). These results indicated that the diagnostic performance of this panel was similar to the built OPLS-DA model with all differential metabolites, demonstrating the efficacy of this panel in PSD diagnosis.
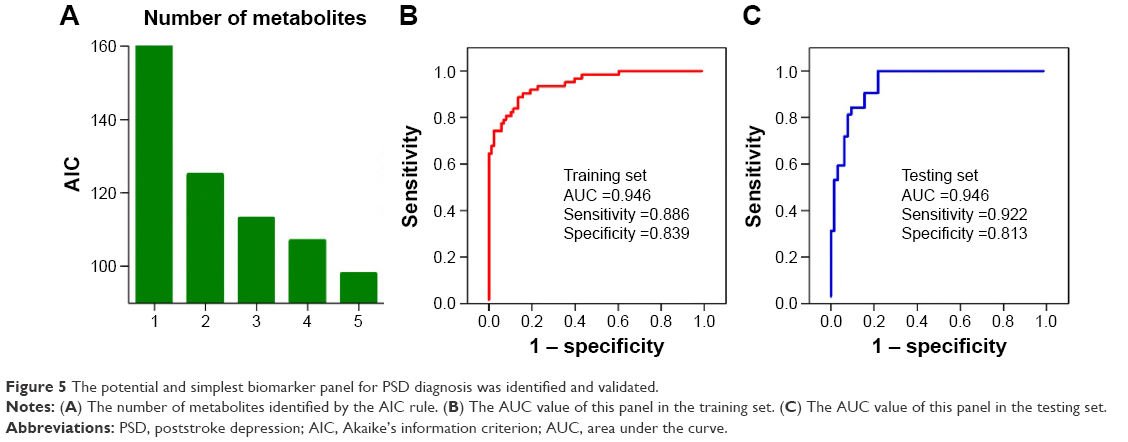 | Figure 5 The potential and simplest biomarker panel for PSD diagnosis was identified and validated. |
Discussion
Depression is the common neuropsychiatric consequence of stroke. PSD has been associated with poor rehabilitation, increased distress, physical disability, and suicidal ideation.17 Moreover, PSD might affect the acceptability and effectiveness of therapy for patients and increases the length of hospital stay.18 However, the current PSD diagnosis still remains the subjective identification of depressive symptoms rather than objective laboratory tests, and the underlying molecular mechanism is still unclear. Here, an NMR-based metabonomic method was performed to identify the significantly changed metabolites in the urine of PSD subjects. This method could discriminate PSD subjects from HC and stroke subjects with high accuracy in both the training set and testing set. In addition, a urinary metabolite biomarker panel consisting of lactate, α-hydroxybutyrate, phenylalanine, formate, and arabinitol was identified. This panel could yield an AUC of 0.946 in both the training set and testing set. The satisfactory predictability of this panel indicated that it might serve as a “good” classifier for PSD diagnosis.
Here, the levels of ten initially identified metabolites in the urine of PSD subjects were significantly changed, and the OPLS-DA built with these metabolites could provide excellent performance in distinguishing PSD subjects from HC and stroke subjects. This finding demonstrated a robust diagnostic performance of these ten metabolites. These metabolites might aid in the future investigation of the pathogenesis of PSD and the development of an objective diagnostic method for PSD. To make the clinical PSD diagnosis more economical and feasible, a stepwise optimization algorithm based on AIC rule was applied. Finally, a simplified potential biomarker panel consisting of only five metabolites was identified. The accuracy of this panel in discriminating PSD subjects from HC and stroke subjects was still high. Owing to this analytical and rigorous selective strategy, the smaller number of metabolites in the panel could probably have more clinical value than those identified by a previous metabolomic study on PSD diagnosis.19 Among the five identified potential metabolite biomarkers, the levels of lactate and α-hydroxybutyrate were increased and the levels of phenylalanine, formate, and arabinitol were decreased in the urine of PSD subjects. Although the difference in arabinitol level between PSD subjects and HC/stroke subjects was not statistically significant in the univariate analysis, this metabolite was still identified as an important metabolite and included in the potential metabolite biomarker panel. This was done because the OPLS-DA and binary logical regression analysis showed that the addition of this metabolite could significantly increase the discriminatory and predictive power. These results indicated that the multivariate statistical analysis had an advantage over the univariate analysis in detecting the subtle metabolic differences between different groups.16,20 To better understand the underlying molecular mechanisms of PSD, these differential metabolites were analyzed using the online software MetaboAnalyst in terms of metabolic activity in vivo.21 The results showed that these metabolites were primarily involved in 1) pyruvate metabolism (lactate and formate); 2) propanoate metabolism (lactate and α-hydroxybutyrate); 3) nitrogen metabolism (phenylalanine and formate); and 4) D-glutamine and D-glutamate metabolism (α-glucose). A previous study reported on nonsignificantly changed lactate, α-hydroxybutyrate, and phenylalanine levels in patients with major depressive disorder (MDD),12 but in this study the lactate and α-hydroxybutyrate levels were significantly decreased and the phenylalanine level was significantly increased. Meanwhile, when using the previously identified biomarker panel for MDD diagnosis to diagnose PSD,16 its accuracy was inferior to that of the identified panel in this work. These results might indicate that there were different pathogeneses between PSD and MDD and it was not appropriate to use the diagnostic method for MDD to diagnose PSD.
Several limitations should be mentioned in this work: 1) due to the same ethnicity of the included subjects, ethno-specific biases might exist; 2) due to the wide concentration range of human metabolome,22 this study might miss some of the differential metabolites in the urine of PSD subjects; 3) it was unknown whether the identified panel could be used to discriminate PSD subjects from stroke patients with other psychiatric disorders; and finally, 4) cerebrospinal fluid from PSD subjects should be analyzed to ensure the relationship between these potential biomarkers and disease pathogenesis.
Conclusion
This study showed that the NMR-based urinary metabonomics approach might be an effective tool in the clinical diagnosis of PSD. There were ten differential metabolites in the urine of PSD subjects compared to those of HC and stroke subjects. Meanwhile, a potential and an effective biomarker panel consisting of lactate, α-hydroxybutyrate, phenylalanine, formate, and arabinitol was identified. These results laid a foundation for the future development of urine-based objective methods for PSD diagnosis and investigation of PSD pathogenesis.
Disclosure
The authors report no conflicts of interest in this work.
References
Allan LM, Rowan EN, Thomas AJ, Polvikoski TM, O’Brien JT, Kalaria RN. Long-term incidence of depression and predictors of depressive symptoms in older stroke survivors. Br J Psychiatry. 2013;203(6):453–460. | ||
Meader N, Moe-Byrne T, Llewellyn A, Mitchell AJ. Screening for poststroke major depression: a meta-analysis of diagnostic validity studies. J Neurol Neurosurg Psychiatry. 2014;85(2):198–206. | ||
Tu WJ, Dong X, Zhao SJ, Yang DG, Chen H. Prognostic value of plasma neuroendocrine biomarkers in patients with acute ischaemic stroke. J Neuroendocrinol. 2013;25(9):771–778. | ||
Schmid AA, Kroenke K, Hendrie HC, Bakas T, Sutherland JM, Williams LS. Poststroke depression and treatment effects on functional outcomes. Neurology. 2011;76(11):1000–1005. | ||
Saxena SK, Ng TP, Koh G, Yong D, Fong NP. Is improvement in impaired cognition and depressive symptoms in post-stroke patients associated with recovery in activities of daily living? Acta Neurol Scand. 2007;115(5):339–346. | ||
Berg A, Lönnqvist J, Palomäki H, Kaste M. Assessment of depression after stroke: a comparison of different screening instruments. Stroke. 2009;40(2):523–529. | ||
Chen JJ, Liu Z, Fan SH, et al. Combined application of NMR- and GC-MS-based metabonomics yields a superior urinary biomarker panel for bipolar disorder. Sci Rep. 2014;4:5855. | ||
Kaddurah-Daouk R, Kristal BS, Weinshilboum RM. Metabolomics: a global biochemical approach to drug response and disease. Annu Rev Pharmacol Toxicol. 2008;48:653–683. | ||
Nicholson JK, Lindon JC. Systems biology: metabonomics. Nature. 2008;455(7216):1054–1056. | ||
Chen JJ, Huang H, Zhao LB, et al. Sex-specific urinary biomarkers for diagnosing bipolar disorder. PLoS One. 2014;9(12):e115221. | ||
Yang J, Chen T, Sun L, et al. Potential metabolite markers of schizophrenia. Mol Psychiatry. 2013;18(1):67–78. | ||
Chen JJ, Zhou CJ, Liu Z, et al. Divergent urinary metabolic phenotypes between major depressive disorder and bipolar disorder identified by a combined GC-MS and NMR spectroscopic metabonomic approach. J Proteome Res. 2015;14(8):3382–3389. | ||
Jung JY, Lee HS, Kang DG, et al. 1H-NMR-based metabolomics study of cerebral infarction. Stroke. 2011;42(5):1282–1288. | ||
Goldstein M, Barnett HJM, Orgogozo JM, Sartorius N, Symon L, Vereschchagin NV. Report of the WHO Task Force on stroke and other crebrovascular disorders. Stroke. 1989;20(10):1407–1431. | ||
Fang J, Yan W, Jiang GX, Li W, Cheng Q. Serotonin transporter gene polymorphism in Chinese patients with poststroke depression a case-control study. Stroke. 2011;42(5):1461–1463. | ||
Zheng P, Wang Y, Chen L, et al. Identification and validation of urinary metabolite biomarkers for major depressive disorder. Mol Cell Proteomics. 2013;12(1):207–214. | ||
Zhan Y, Yang YT, You HM, et al. Plasma-based proteomics reveals lipid metabolic and immunoregulatory dysregulation in post-stroke depression. Eur Psychiatry. 2014;29(5):307–315. | ||
Srivastava A, Taly AB, Gupta A, Murali T. Post-stroke depression: prevalence and relationship with disability in chronic stroke survivors. Ann Indian Acad Neurol. 2010;13(2):123–127. | ||
Wei Z, Xin-an Z. A novel urinary metabolite signature for non-invasive post-stroke depression diagnosis. Cell Biochem Biophys. 2015;72(3):661–667. | ||
MacIntyre DA, Jiménez B, Lewintre EJ, et al. Serum metabolome analysis by 1H-NMR reveals differences between chronic lymphocytic leukaemia molecular subgroups. Leukemia. 2010;24(4):788–797. | ||
Xia J, Mandal R, Sinelnikov IV, Broadhurst D, Wishart DS. MetaboAnalyst 2.0 – a comprehensive server for metabolomic data analysis. Nucleic Acids Res. 2012;40(Web Server issue):W127–W133. | ||
Williams R, Lenz EM, Wilson AJ, et al. A multi-analytical platform approach to the metabonomic analysis of plasma from normal and Zucker (fa/fa) obese rats. Mol Biosyst. 2006;2(3–4):174–183. |
 © 2016 The Author(s). This work is published and licensed by Dove Medical Press Limited. The
full terms of this license are available at https://www.dovepress.com/terms
and incorporate the Creative Commons Attribution
- Non Commercial (unported, 3.0) License.
By accessing the work you hereby accept the Terms. Non-commercial uses of the work are permitted
without any further permission from Dove Medical Press Limited, provided the work is properly
attributed. For permission for commercial use of this work, please see paragraphs 4.2 and 5 of our Terms.
© 2016 The Author(s). This work is published and licensed by Dove Medical Press Limited. The
full terms of this license are available at https://www.dovepress.com/terms
and incorporate the Creative Commons Attribution
- Non Commercial (unported, 3.0) License.
By accessing the work you hereby accept the Terms. Non-commercial uses of the work are permitted
without any further permission from Dove Medical Press Limited, provided the work is properly
attributed. For permission for commercial use of this work, please see paragraphs 4.2 and 5 of our Terms.