Back to Journals » International Journal of Nanomedicine » Volume 13
Direct modulation of myelin-autoreactive CD4+ and CD8+ T cells in EAE mice by a tolerogenic nanoparticle co-carrying myelin peptide-loaded major histocompatibility complexes, CD47 and multiple regulatory molecules
Authors Pei W, Wan X, Shahzad KA ![]() , Zhang L, Song S, Jin X, Wang L, Zhao C, Shen C
, Zhang L, Song S, Jin X, Wang L, Zhao C, Shen C ![]()
Received 3 February 2018
Accepted for publication 25 April 2018
Published 27 June 2018 Volume 2018:13 Pages 3731—3750
DOI https://doi.org/10.2147/IJN.S164500
Checked for plagiarism Yes
Review by Single anonymous peer review
Peer reviewer comments 2
Editor who approved publication: Professor Lei Yang
Weiya Pei, Xin Wan, Khawar Ali Shahzad, Lei Zhang, Shilong Song, Xiaoxiao Jin, Limin Wang, Chen Zhao, Chuanlai Shen
Department of Microbiology and Immunology, Medical School, Southeast University, Nanjing, Jiangsu 210009, China
Purpose: Numerous nanomaterials have been reported in the treatment of multiple sclerosis or experimental autoimmune encephalomyelitis (EAE). But most of these nanoscale therapeutics deliver myelin antigens together with toxins or cytokines and underlay the cellular uptake and induction of tolerogenic antigen-presenting cells by which they indirectly induce T cell tolerance. This study focuses on the on-target and direct modulation of myelin-autoreactive T cells and combined use of multiple regulatory molecules by generating a tolerogenic nanoparticle.
Materials and methods: Poly(lactic-co-glycolic acid) nanoparticles (PLGA-NPs) were fabricated by co-coupling MOG40–54/H-2Db-Ig dimer, MOG35–55/I-Ab multimer, anti-Fas, PD-L1-Fc and CD47-Fc and encapsulating transforming growth factor-β1. The resulting 217 nm tolerogenic nanoparticles (tNPs) were administered intravenously into MOG35–55 peptide-induced EAE mice, which was followed by the investigation of therapeutic outcomes and the in vivo mechanism.
Results: Four infusions of the tNPs durably ameliorated EAE with a marked reduction of clinical score, neuroinflammation and demyelination. They were distributed in secondary lymphoid tissues, various organs and brain after intravenous injection, with retention over 36 h, and made contacts with CD4+ and CD8+ T cells. Two injections of the tNPs markedly decreased the MOG35–55-reactive Th1 and Th17 cells and MOG40–55-reactive Tc1 and Tc17 cells, increased regulatory T cells, inhibited T cell proliferation and elevated T cell apoptosis in spleen. Transforming growth factor-β1 and interleukin-10 were upregulated in the homogenates of central nervous system and supernatant of spleen cells.
Conclusion: Our data suggest a novel therapeutic nanoparticle to directly modulate autoreactive T cells by surface presentation of multiple ligands and paracrine release of cytokine in the antigen-specific combination immunotherapy for T cell-mediated autoimmune diseases.
Keywords: multiple sclerosis, experimental autoimmune encephalomyelitis, autoreactive T cells, immunotherapy, myelin oligodendrocyte glycoprotein, biomimetic nanoparticle
Introduction
In multiple sclerosis (MS), myelin antigen-autoreactive CD4+ T cells and CD8+ T cells target and destroy myelin sheath on the nerve cells, thereby leading to substantial neuroinflammation, demyelination, axonal damage and progressive neurologic dysfunction,1 and slowly causing permanent physical disability.2,3 Experimental autoimmune encephalomyelitis (EAE) induced by central nervous system (CNS) homogenate or myelin proteins is quite similar to MS in clinical symptoms, histopathology, myelin antigens and the breakdown of blood–brain barrier; therefore, murine EAE usually serves as the ideal model to investigate the pathogenesis of MS and develop new therapies.4
Immunosuppressive agents are currently and commonly used to control autoimmune diseases, but the long-term administration often results in nonspecific suppression of overall immune function, which increases the risks of infections and cancers.5,6 Therefore, antigen-specific therapy is highly desirable from an efficacy and safety perspective. Tolerogenic dendritic cell (DC) is one of the fundamental strategies and has recently been applied in models of type 1 diabetes and graft survival.7,8 Similarly, DCs, spleen cells or peripheral blood cells carrying myelin protein or peptides along with other modulators have been reported to work as tolerogenic antigen-presenting cells (APCs) and induce immune tolerance in MS or EAE,9–13 but are limited by the high cost, inadequate cell numbers and safety issues due to their cell nature.14,15
Since the rapid development of nanocarriers and the surface modification techniques make drug-targeted treatment much easier,16 increasing nanoparticles (NPs) have been used to deliver drugs and/or inhibitory molecules for the treatment of autoimmune disorders, such as rheumatoid arthritis and autoimmune diabetes.17,18 For the antigen-specific immunotherapy of MS or EAE, numerous biomimetic NPs loading myelin peptides or proteins together with toxin or regulatory molecules have also been investigated as an alternative strategy of tolerogenic DCs.19–23 For example, the gold NPs carrying aryl hydrocarbon receptor ligand and myelin oligodendrocyte glycoprotein (MOG)35–55 peptide have been demonstrated to induce tolerogenic DCs that promote the differentiation of regulatory T cells (Tregs) in vitro and in mice EAE model and, thus, suppress the development of EAE.20 These therapeutic NPs are mostly internalized by phagocytes or DCs in vivo to induce tolerogenic APCs that polarize naïve T cells into Tregs rather than effector Th1 and Th17 cells by bias production of cytokines. Therefore, these NPs act as an indirect modulator of autoreactive T cells and often suffer from the uncertainty-inducing tolerogenic DCs in vivo due to the diverse types, tissue specificities and surface receptors of DCs. Inaccurate targeting can enhance the immune response and aggravate the disease. In future, direct and on-target depletion and modulation of autoreactive T cells are worthy to investigate.24
This study aims to develop a novel tolerogenic NP which functions as a direct modulator of T cells to directly and selectively deplete and/or modulate myelin-autoreactive T cells in the EAE murine model, without the requirement of inducing tolerogenic DCs. Poly(lactic-co-glycolic acid) (PLGA), a biocompatible and biodegradable polymer approved by the Food and Drug Administration and the European Medicines Agency, is widely used in human drug and vaccine delivery systems.25–27 Here, PLGA-NPs were fabricated to co-couple target antigens (MOG40–54/H-2Db-Ig dimer and MOG35–55/I-Ab multimer), regulatory molecules (anti-Fas and PD-L1-Fc) and “self-marker” CD47-Fc and encapsulated inhibitory cytokine transforming growth factor (TGF)-β1 inside. The resulting 217 nm tolerogenic NPs (tNPs) were administered intravenously (i.v.) into the MOG35–55 peptide-induced EAE mice, followed by the investigation of therapeutic outcomes and in vivo mechanism. Our data suggest a novel antigen-specific combination immunotherapy for the T cell-mediated autoimmune diseases.
Materials and methods
Mice and peptides
Eight to ten week old female C57BL/6J mice were purchased from the Comparative Medicine Center of Yangzhou University (Yangzhou, China) and maintained in the specific pathogen-free laboratory, Animal Center of Southeast University (Nanjing, Jiangsu, China). Animal welfare and experimental procedures were performed in accordance with the National Institutes of Health Guide for the Care and Use of Laboratory Animals (NIH publications no. 8023, revised 1978) and the Guide for the Care and Use of Laboratory Animals (Ministry of Science and Technology of China, 2006). The protocols were approved by the Animal Ethics Committee of Southeast University. MOG35–55 (MEVGWYRSPFSRVVHLYRNGK) and MOG40–54 (YRSPFSRVVHLYRNG) were synthesized by China Peptides (Suzhou, China) with a purity of >95%.
Generation and characterization of polyethyleneimine-coated and TGF-β1-encapsulated PLGA-NPs
Blank-NPs and TGF-β1-encapsulated NPs were prepared using the double-emulsion solvent evaporation method and coated with polyethyleneimine (PEI) as described.28 Briefly, 20 mg of PLGA (Daigang Company, Jinan, China) with or without 5.0 μg of TGF-β1 (PeproTech Inc., Rocky Hill, NJ, USA) was dissolved in 5 mL of dichloromethane (Sigma-Aldrich, St Louis, MO, USA) and emulsified with a microtip probe sonicator (Microson XL 2000; Misonix Inc., Farmingdale, NY, USA) for 30 s at 40% amplitude to create the primary emulsion. Then, 50 mL of 1% polyvinyl alcohol (PVA; Sigma-Aldrich) was added and sonicated again for 90 s to form the secondary emulsion. The resulting emulsification was mixed in 100 mL of 0.5% PVA solution. Dichloromethane was allowed to evaporate from the solution by magnetic stir bar agitation for 4 h at room temperature (RT). After that, the solution was centrifuged at 6,000 rpm for 5 min. The supernatant was harvested and ultracentrifuged twice at 12,000 rpm for 10 min per time to remove PVA. The resulting NPs in deionized water were further mixed with 1-ethyl-3-(3-dimethylaminopropyl) carbodiimide hydrochloride and N-hydroxysuccinimide soultion (Sigma-Aldrich) for 1 h of surface activation. Then the solution was added dropwise in PEI (Sigma-Aldrich) with a magnetic stirrer for 4 h at RT. Finally, after washing with deionized water, PEI-conjugated NPs were collected and stored at 4°C for further use.
The prepared TGF-β1-encapsulated NPs and blank-NPs were characterized after surface modification for each batch. The size distribution was measured using dynamic light scattering (BI-90 Particle Sizer; Brookhaven Instruments Corporation, Holtsville, NY, USA). Zeta potential was detected using a PALS Zeta instrument (Brookhaven Instruments Corporation). The shape and surface morphology was observed under scanning electron microscope (ZEISS EVO 18; Carl Zeiss Meditec AG, Oberkochen, Germany) and images were obtained at an acceleration voltage of 2 kV. To determine the amount of TGF-β1 encapsulated into NPs, 1 mg of NPs was resuspended in 1 mL of 0.1 M NaOH/0.5% sodium dodecyl sulfate solution and incubated for 24 h at 37°C on a shaker. After centrifugation for 5 min at 12,000 rpm, the supernatant was collected and subjected to quantitative detection of TGF-β1 with enzyme-linked immunosorbent assay (ELISA) kits (Dakewe Biotech, Shenzhen, China).
Generation and phenotypic analyses of multivalent tNPs
First, MOG40–54/H-2Db-Ig dimers were prepared by co-incubating H-2Db-Ig Dimer X (BD Biosciences, San Jose, CA, USA) with MOG40–54 peptide for 48 h at 4°C according to the manufacturer’s instructions. The PEI-conjugated and TGF-β1-encapsulated PLGA-NPs (5 mg) were co-incubated with MOG40–54/H-2Db-Ig dimer (5 μg), anti-Fas monoclonal antibody (mAb) at 2.5 μg (BD Biosciences), PD-L1-Fc (1.25 μg; Sino Biological Inc., Beijing, China), CD47-Fc (0.3 μg; R&D Systems, Minneapolis, MN, USA) and streptavidin (3.5 μg; ProZyme, Hayward, CA, USA) in sterile PBS overnight at 4°C on a rotator. Then, the NPs were blocked with 30% bovine serum albumin (BSA) for 24 h at 4°C on a rotator and further incubated with MOG35–55/I-Ab-biotin monomer (MBL, Nagoya, Japan) for another 4 h at 4°C. Finally, the resulting NPs, termed tNPs, were washed and resuspended in sterile PBS for further use. In parallel, the MOG peptide/major histocompatibility complex (MHC) multimers-absent tNPs (MOG− tNPs) were also prepared by co-coupling only anti-Fas, PD-L1-Fc and CD47-Fc and encapsulating TGF-β1. Blank-NPs were just blocked with 30% BSA.
In order to analyze the phenotypes, the tNPs were stained with phycoerythrin (PE)-anti-mouse I-Ab (eBiosciences, San Diego, CA, USA), fluorescein isothiocyanate (FITC)-anti-hamster IgG (eBiosciences) and allophycocyanin (APC)-anti-mouse IgG1 (BD Biosciences) or APC-anti-human IgG1 (Miltenyi Biotech, Bergisch Gladbach, Germany) for 30 min at 4°C. After washing, the tNPs were analyzed by confocal laser scanning microscopy (Olympus, Center Valley, PA, USA) and also acquired on a FACS Calibur flow cytometer (BD Biosciences). To determine the dynamic release of TGF-β1, 1 mg of tNPs was resuspended in sterile PBS and incubated on a rotator at 37°C. At several time points, the suspensions were centrifuged (12,000 rpm, 5 min) to collect the supernatants and equal volume of fresh PBS was supplemented. The collected supernatants were then detected by TGF-β1 ELISA kits (Dakewe Biotech) to quantify the TGF-β1 release from tNPs, followed by the calculation of release profile.
EAE induction and treatment with tNPs
On day 0, female C57BL/6 mice aged 8–10 weeks were subcutaneously injected at four sites on the flank of each mouse with MOG35–55 peptide emulsified in complete Freund’s adjuvant (Sigma-Aldrich) at a dosage of 300 μg per mouse. The complete Freund’s adjuvant was prepared by mixing heat-killed Bacillus Calmette-Guerin (Ruichun Biotech, Shanghai, China) into incomplete Freund’s adjuvant (Sigma-Aldrich) to achieve a concentration of 10 mg/mL of Bacillus Calmette-Guerin. Intraperitoneal injections of Pertussis Toxin (Sigma-Aldrich) were given on days 0 and 2 at a dosage of 250 ng/mouse/time point.
For treatment with tNPs, the EAE mice were randomized into four groups and administered via tail vein with PBS, blank-NPs, MOG− tNPs or tNPs on days 8, 18, 28 and 38 after MOG immunization (1 mg NPs/mouse/time point). All mice were monitored daily, and the severity of disease was scored by two investigators in a blind fashion according to the following criteria: Grade 0, normal; Grade 1, flaccid tail; Grade 2, mild hind limb weakness (quick righting reflex); Grade 3, severe hind limb weakness (slow righting reflex); Grade 4, hind limb paralysis; Grade 5, hind limb paralysis and partial forelimb weakness or death (0.5 gradations represent intermediate scores).29
Evaluation of inflammatory infiltration and demyelination in the CNS
On day 100 post-MOG immunization, EAE mice in each treatment group were perfused via heart with ice-cold PBS and paraformaldehyde under deep anesthesia. The brain and spinal cord tissues were then isolated and processed to paraffin-embedded sections with a thickness of 5–7 μm, following which routine H&E staining and Luxol Fast Blue (LFB; Boster Biotech, Wuhan, China) staining were performed, respectively. Inflammatory infiltration and demyelization in the tissues were evaluated under microscope (Eclipse 80i; Nikon, Tokyo, Japan) in a blind manner by two examiners. The level of inflammatory infiltration was determined in H&E staining as reported by Fissolo, according to the following criteria: 0, no lesion; 1, cellular infiltration only in the meninges; 2, very discrete and superficial infiltrates in the parenchyma; 3, moderate infiltrates (<25%) in the white matter; 4, severe infiltrates (<50%) in the white matter; 5, more severe infiltrates (>50%) in the white matter.30 Spinal cord demyelination was scored in LFB staining as described: score 0, no demyelination; score 1, mild demyelination; score 2, moderate demyelination and score 3, severe demyelination.31 The average score from five spinal cord sections of each animal was calculated.
In parallel, brain and spinal cord were isolated from the treated EAE mice on day 20 after MOG immunization. The mononuclear cells were further collected as described previously.32 Briefly, ice-cold PBS was used to perfuse CNS. Brain and spinal cord were ground using a glass homogenizer and suspended in 30% isotonic Percoll (Sigma-Aldrich). Then, the homogenate of CNS was layered on the top of 70% isotonic Percoll and centrifuged for 30 min at 1,500 rpm. Finally, the 70%/30% interphase containing CNS mononuclear cells was harvested, washed with PBS and stained with PE-anti-mouse CD3e (145-2C11), FITC-anti-mouse CD8a (53-6.7) and APC-anti-mouse CD4 (GK1.5) (eBiosciences) for 30 min at 4°C, following which flow cytometry was performed.
In vivo and ex vivo near-infrared imaging
Indocyanine green (ICG), a hydrophobic near-infrared dye, was used to generate the ICG-encapsulated tNPs in a similar way. Briefly, ICG (Sigma-Aldrich), TGF-β1 and PLGA polymer were dissolved in dichloromethane and the double-emulsion solvent evaporation method was followed to generate the ICG- and TGF-β1-encapsulated PLGA-NPs. After surface modification with PEI, these NPs were further co-coupled with surface ligands as described. Similarly, the ICG-encapsulated CD47− tNPs and blank-NPs were generated in parallel. On day 18 after MOG immunization, the EAE mice were randomized into three groups and injected with different ICG-NPs, respectively, via the tail vein (1 mg NPs/mouse). The mice were anesthetized by isoflurane inhalation and imaged using the Maestro in vivo imaging system (CRi, Woburn, MA, USA) at various time points. Near-infrared images were captured at an excitation wavelength of 710–745 nm and an emission wavelength of 780–840 nm. At 12 h after injection, the brain, heart, liver, spleen, lymph nodes, lungs and kidneys were surgically dissected from the EAE mice for ex vivo imaging.
CNS distribution of tNPs and co-localizations with immune cells in spleen
Blank-NPs, CD47− tNPs and tNPs labeled with PE were prepared by co-incubating the NPs with PE-streptavidin (BD Biosciences) in sterile PBS overnight. Then, these PE-labeled NPs were injected via tail vein into the EAE mice (1 mg NPs/mouse), respectively, on day 18 after MOG immunization. Spleen and brain were collected from each group at 4 h after injection, and frozen sections with a thickness of 9–10 μm were prepared. The spleen sections were fixed with acetone and isopropanol and blocked with 10% BSA for 2 h at RT, then stained by FITC-anti-mouse CD4 (GK1.5), FITC-anti-mouse CD8a (53-6.7), FITC-anti-mouse CD11c (N418) or FITC-anti-mouse F4/80 (BM8) (eBiosciences) overnight at 4°C. 4′,6-Diamidino-2-phenylindole (Sigma-Aldrich) staining was performed on the next day. In parallel, the frozen brain sections were stained by 4′,6-diamidino-2-phenylindole and FITC-anti-mouse CD3e (145-2C11; eBiosciences). Finally, the sections were visualized under confocal laser scanning microscopy (Olympus).
Detection of MOG peptide-reactive Th1, Th17, Tc1 and Tc17 cells by intracellular cytokine staining
EAE mice were sacrificed on day 20, and mononuclear cells from spleens were separated by using density gradient centrifugation. The cells were co-cultured in 24-well plate (1×10⁶ cells/well) with MOG35–55 or MOG40–54 peptides (25 μg/mL) for 16 h at 37°C under 5% CO2 and humidified conditions, followed by the addition of protein transport inhibitor Brefeldin A (Multi Sciences, Shanghai, China) for another 5 h. Cells were harvested and blocked with anti-mouse CD16/32 (2.4G2; eBiosciences) for 20 min and then stained with FITC-anti-mouse CD4 and APC-anti-mouse CD8a (eBiosciences) for 30 min at 4°C. After that, the cells were incubated with PE-anti-mouse interferon (IFN)-γ (XMG1.2) or PE-anti-mouse IL-17A (eBio17B7) (eBiosciences) for 30 min at 4°C after fixation/permeabilization and analyzed by flow cytometry. The gating strategy for each figure of flow cytometry was described in Supplementary materials.
Detection of T cell apoptosis and Tregs
Blood and spleens were collected from the treated EAE mice in each group and processed into single cell suspensions. The cells were stained by APC-anti-mouse CD4 (GK 1.5) or CD8a (53-6.7) (eBiosciences) for 30 min at 4°C and then stained with Annexin V and propidium iodide according to the manufacturer’s protocol (eBiosciences) and analyzed by flow cytometry. For the detection of Tregs, the mouse Treg staining kit (eBiosciences) was used according to the manufacturer’s protocol. The flesh spleen cells were blocked with anti-mouse CD16/CD32 and then stained with APC-anti-mouse CD25 (PC61.5) and FITC-anti-mouse CD4 (RM4-5). After fixation, intracellular staining with PE-anti-mouse Foxp3 (FJK-16s) was conducted and finally analyzed by flow cytometry.
T cell proliferation assay
To evaluate the proliferation of CD4+ and CD8+ T cells in response to MOG peptide, spleens were isolated from the EAE mice in each treatment group on day 20. Mononuclear cells were prepared and incubated with 5 μM carboxyfluorescein succinimidyl ester (CFSE; Sigma-Aldrich) for 10 min at 37°C, and immediately washed three times with ice-cold RPMI 1640 medium (Thermo Fisher Scientific, Waltham, MA, USA). Then, the CFSE-labeled splenocytes (SPCs) were seeded into round-bottom 96-well plates (1×10⁵ cells/well) and co-incubated with MOG35–55 or MOG40–54 peptides (20 μg/mL) for 7 days in complete RPMI 1640 medium at 37°C, 5% CO2 and humidified conditions. Cells were harvested, stained with PE-anti-mouse CD3e and APC-anti-mouse CD4 or CD8a (eBiosciences) for 30 min at 4°C and analyzed by flow cytometry. Cell divisions were demarcated according to CFSE staining brightness.
Quantification of cytokines by ELISA
Spleen, brain and spinal cord tissues were isolated from the treated EAE mice on day 20. SPCs were prepared and co-incubated in round-bottom 96-well plates (1×10⁶ cells/well) with MOG35–55 or MOG40–54 peptides (25 μg/mL) in complete Roswell Park Memorial Institute (RPMI) 1640 medium at 37°C, 5% CO2 and humidified conditions. After 2 days, the culture supernatants were harvested and stored at −80°C for use. The homogenate of CNS tissues (brain and spinal cords) was prepared. Then, the concentrations of interleukin (IL)-17A, IFN-γ, IL-10 and TGF-β1 in these samples were detected by using the mouse cytokine ELISA kit (Dakewe Biotech).
Statistical analyses
Statistical analyses were performed using GraphPad Prism 6.0 (GraphPad Software, Inc., La Jolla, CA, USA). Wilcoxon signed rank test was used to analyze the clinical score curves of EAE. For other experiments, a two-tailed unpaired Student’s t-test was used to determine differences across groups. All data were presented as the mean ± SD. p<0.05 was considered significant.
Results
Generation and characterization of PLGA-NPs
PEI-conjugated PLGA-NPs with or without TGF-β1 were successfully prepared in-house by double-emulsion solvent evaporation method. Both blank-NPs and TGF-β1-encapsulated NPs showed a spherical shape with a smooth surface as characterized by scanning electron microscopy (Figure 1A). Size analyses revealed that 83% of blank-NPs ranged from 180 to 240 nm, with a mean diameter of 205±3.2 nm. Meanwhile, 91% of TGF-β1-encapsulated NPs ranged from 180 to 260 nm and presented a mean size of 217±4.5 nm (Figure 1B). The mean ζ-potential was 25.6±3.6 mV for blank-NPs and 35.8±8.8 mV for TGF-β1-encapsulated NPs (Figure 1C), suggesting the abundant cationic NH2 groups on the surface of NPs and a high capacity to covalently couple proteins.
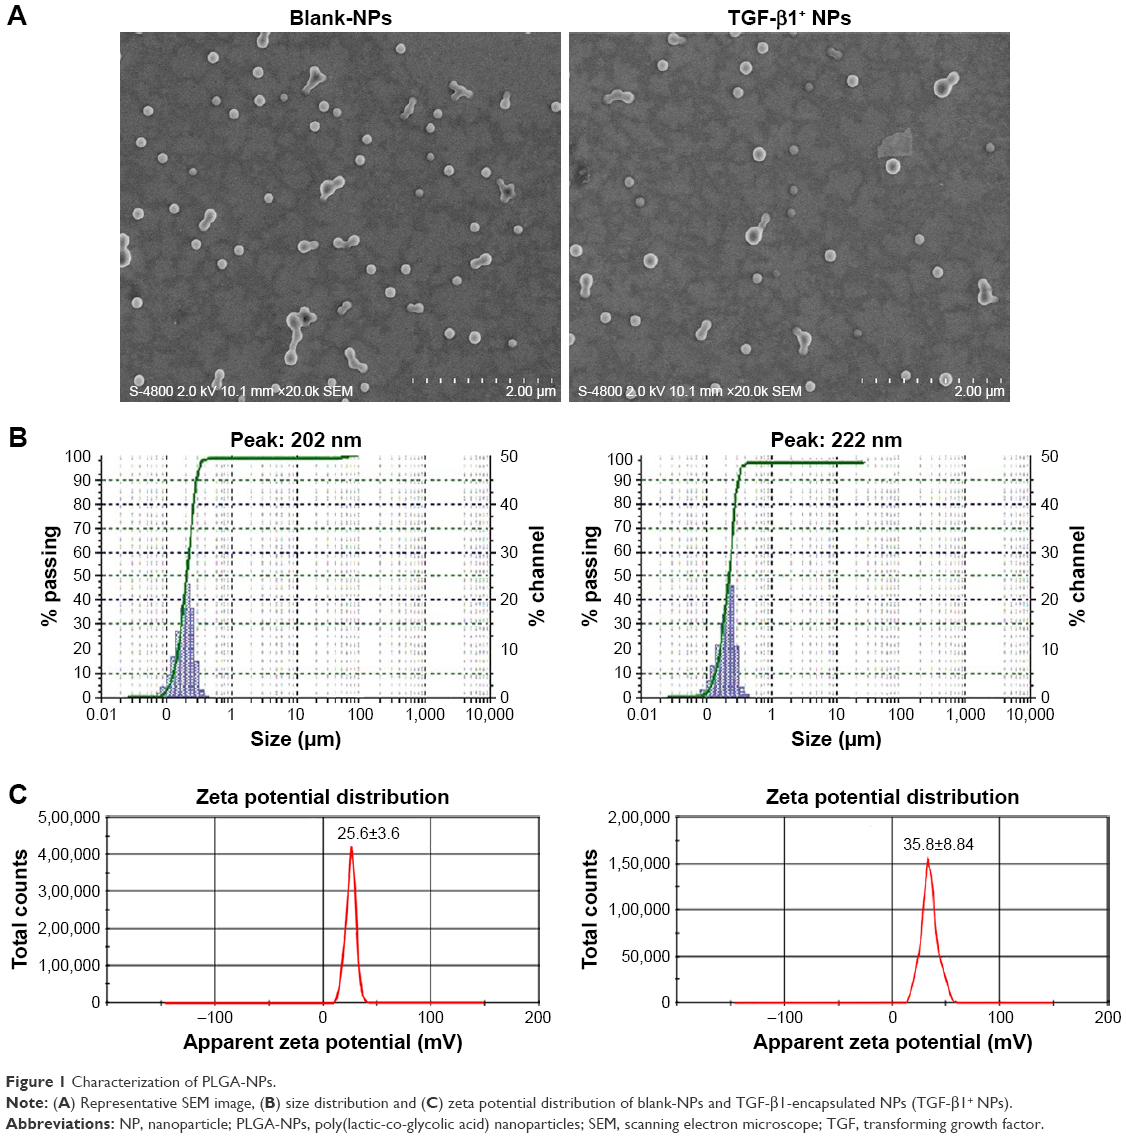 | Figure 1 Characterization of PLGA-NPs. |
Preparation and characterization of multivalent tNPs
The multivalent and tolerogenic PLGA-NPs were fabricated by co-coupling the target antigens (MOG40–54/H-2Db-Ig dimer, MOG35–55/I-Ab multimer), regulatory molecules (anti-Fas, PD-L1-Fc) and “self-marker” CD47-Fc onto the PEI-conjugated and TGF-β1-encapsulated PLGA-NPs. As determined by ELISA, ~180 ng of TGF-β1 was encapsulated into 1 mg of tNPs with an encapsulation efficiency of 72% and nearly 100.8 ng of TGF-β1 was released from tNPs over 30 days in a sustained manner with a cumulative release efficiency of 56%, but a burst in vitro release was found during the first 2 days (Figure 2A). To verify the immobilization of multiple molecules on the surface of tNPs, three control NPs (PD-L1− tNPs, CD47− tNPs and blank-NPs) were also generated in parallel, which was followed by three-color staining. The histograms (Figure 2B) showed that each kind of surface molecules was effectively coupled onto tNPs with an obvious shift of fluorescence signal. Confocal images also confirmed the co-presence of the five kinds of surface molecules onto tNPs (Figure 2C). The dot plots (Figure 2D) indicated that 62.8%–76.6% of tNPs co-displayed the five kinds of surface molecules, as determined by double-positive tNPs in each two-color dot plots. Each batch of tNPs was routinely evaluated in this manner prior to use.
 | Figure 2 Characterization of multivalent tNPs. |
Infusions of tNPs durably ameliorate EAE and reduce local autoimmune responses
EAE was actively induced in female C57BL/6 mice by MOG35–55 peptide immunization, with a “classic” clinical course containing acute onset (near day 10), peak stage (near day 18) and later on stable chronic remission. To investigate the therapeutic potential, the mice were randomized into four groups and administered i.v. with PBS, blank-NPs, MOG− tNPs (a non-target control) and tNPs, respectively, on days 8, 18, 28 and 38 after MOG immunization. The clinical manifestation was scored daily for 100 days. The results from three independent experiments showed that four infusions of tNPs obviously and durably attenuated the clinical severity and inhibited the progression of EAE, while the mice in PBS, blank-NPs and MOG− tNPs treatment groups developed severe paralytic EAE (Figure 3A). The peak disease scores from days 18 to 21 (Figure 3B) and the average cumulative disease scores (Figure 3C) also showed the much lower clinical scores of the EAE mice treated by tNPs than the control groups.
 | Figure 3 Infusions of tNPs durably ameliorated EAE and reduced local autoimmune responses. |
Furthermore, the local inflammations in brain and the myelin loss in spinal cord were investigated with H&E and LFB staining at a long time point (on day 100 after MOG immunization). Histologic analyses from five mice in each group showed that both the inflammatory infiltration cells (Figure 3D) and demyelination (Figure 3E) in CNS tissues were significantly reduced by the administration of tNPs relative to the control groups. Moreover, the local infiltration of T cells in CNS was measured. Brain and spinal cord tissues were collected at peak stage (day 20, 2 days after second treatment of tNPs) and processed to single cell suspensions, followed by fluorescence staining with anti-mouse CD3, anti-mouse CD4 and anti-mouse CD8a. As shown in the flow cytometric dot plots (Figure 3F), two infusions of tNPs diminished >60% of CD4+ T cells and 65% of CD8+ T cells in CNS, as compared with the blank-NPs group. Both therapeutic outcomes and pathologic analyses demonstrated the potential of tNPs to prevent the progress of EAE, with a sustained inhibitory effect over the clinical course of 100 days and reduced local autoimmune response in CNS. Of note is that the MOG− tNPs (non-target control tNPs) did not significantly attenuate the EAE severity and CNS inflammatory infiltration as compared with blank-NPs, suggesting the important antigen-targeting effects of MOG peptide-loaded MHC multimers onto the tNPs.
In vivo tracking and tissue distribution of tNPs in EAE mice
To define the distribution and systemic retention of tNPs in EAE mice and the effector function of “self-marker” CD47 molecules onto tNPs, ICG-encapsulated tNPs, CD47− tNPs and blank-NPs were prepared and injected via tail vein into the EAE mice at peak stage (day 18). The live and whole-body fluorescence imaging revealed that the ICG intensity in mice was the strongest from 2 to 24 h after ICG-tNPs injection, with a systemic persistence over 36 h. As controls, ICG-CD47− tNPs and ICG-blank-NPs showed the in vivo tracking similar to ICG-tNPs, but a much less accumulation from 6 to 24 h time points and a much shorter retention time (24 h), as shown in Figure 4A. The visible ICG signal was observed in the head of EAE mice from 2 to 24 h time points in each group, but was much stronger in tNPs group than blank-NPs and CD47− tNPs groups (Figure 4C and D). At 12 h after injection, the ex vivo imaging of dissected organs displayed the retention of tNPs or control NPs in the liver, kidney, spleen, lungs, heart and brain with visible fluorescence, but the accumulation of tNPs in brain, spleen, kidney and lymph nodes was much more than that of blank-NPs (Figure 4B). As compared with CD47− tNPs, the intensity of CD47+ tNPs retained in brain, spleen, kidney and lymph nodes increased by 175%, 22%, 19% and 400%, respectively, but decreased by 34% in heart and 28% in lung at this time point (Figure 4E). In order to further confirm the infiltration of tNPs in CNS, PE-labeled tNPs were prepared and injected i.v. into the EAE mice on day 18 after MOG immunization. The brain tissue was isolated after 4 h and frozen sections were prepared. As shown in Figure 4F, many PE-labeled tNPs were retained in the cerebral cortex and were co-localized with T cells. These data demonstrated that 217 nm tNPs could cross the blood–brain barrier into the CNS tissue and contact with T cells which infiltrated into the CNS.
 | Figure 4 In vivo tracking and tissue distribution of tNPs in EAE mice. |
Co-localizations of tNPs with CD4+ T cells and CD8+ T cells in EAE mice
Directly and selectively depleting or modulating autoreactive T cells depends on the contacts of tNPs with target T cells. Thus, whether the tNPs can co-localize with T cells in spleen sections was investigated. PE-labeled tNPs, CD47− tNPs and blank-NPs were prepared and injected i.v. into the EAE mice, respectively, on day 18 after MOG immunization. Four hours later, spleen was collected and frozen sections were prepared for immunofluorescence staining. As found in the confocal images (Figure 5), PE-labeled tNPs were mainly distributed in the marginal zone and red pulp, and presented lots of co-localizations with CD4+ T cells and CD8+ T cells and few co-localizations with macrophages and DCs. In the control groups, most of the blank-NPs did not contact with T cells, but displayed many contacts with macrophages and DCs. CD47− tNPs also displayed contacts with T cells, but were much fewer than CD47+ tNPs, and a visible portion of them co-localized with macrophages and DCs. These results indicate the direct contacts of tNPs with T cells in vivo and nanomolar CD47-Fc could greatly minimize the engulfment of tNPs by phagocytes.
 | Figure 5 Co-localizations of tNPs with CD4+ T cells and CD8+ T cells in the spleen of EAE mice. |
Infusions of tNPs reduce the MOG peptide-reactive Th1, Th17, Tc1 and Tc17 cells and induce Tregs in EAE mice
To evaluate whether tNPs skew the differentiation of T cells, SPCs were separated from the EAE mice in each treatment group on day 20 (2 days after the second injection of tNPs). The flesh SPCs were co-incubated with MOG35–55 or MOG40–54 peptides for 16 h, followed by the detection of IFN-γ- or IL-17A–producing CD4+ T cells and CD8+ T cells. After MOG35–55 peptide stimulation, the frequencies of IFN-γ+/CD4+ T cells and IL-17A+/CD4+ T cells (presumably MOG35–55-reactive Th1 and Th17 cells) in CD4+ T cell populations decreased by 82.6% and 74.2%, respectively, in tNPs-treated mice, when compared to the blank-NPs group. Meanwhile, MOG− tNPs also caused significant reduction of Th1 relative to blank-NPs group (Figure 6A). After MOG40–54 peptide stimulation, the percentages of IFN-γ+/CD8+ T cells and IL-17A+/CD8+ T cells (presumably MOG40–54-reactive Tc1 and Tc17 cells) in CD8+ T cell populations also decreased by 82.4% and 56.2%, respectively, in tNPs-treated mice as compared with the blank-NPs group (Figure 6B). Of note, the frequencies of Tc1 and Tc17 in the MOG− tNPs group were much lower than in blank-NPs group, but much higher than in tNPs group. Furthermore, the Tregs in the flesh SPCs were detected by intracellular staining. The frequencies of CD25+/Foxp3+ T cells in CD4+ T cell populations were increased by 77.4% and 38.2%, respectively, in the tNPs- and MOG− tNPs-treated mice as compared with the blank-NPs group (Figure 6C).
 | Figure 6 Infusions of tNPs reduce the MOG peptide-reactive Th1, Th17, Tc1 and Tc17 cells and induce Tregs in EAE mice. |
Moreover, proinflammatory cytokines (IFN-γ, IL-17A) and inhibitory cytokines (IL-10, TGF-β1) were quantified in the culture supernatants of SPCs after 7-day incubation with MOG35–55 peptide and in the CNS tissue homogenates collected on day 20. As shown in Figure 6D, the concentrations of IL-10 and TGF-β1 increased to 100.5% and 37.5%, respectively, in the culture supernatants of SPCs from tNPs-treated mice as compared with the blank-NPs group. In the CNS tissue homogenates, the levels of IL-10 and TGF-β1 in tNPs-treated mice were also significantly higher than those in Blank-NPs group (Figure 6E). Notably, MOG− tNPs treatment did not change these cytokine profiles in SPCs and CNS tissues. In addition, the inflammatory cytokines (IFN-γ and IL-17A) did not significantly decrease in the supernatant of SPCs and CNS tissue homogenates (data not shown). The gating strategy and isotype controls for IL-17A and IFN-γ staining in Figure 6A and 6B were presented in Figure S1.
Infusions of tNPs induce apoptosis of T cells and inhibit proliferation of MOG peptide-reactive T cells in EAE mice
To define the mechanisms by which tNPs reduce the MOG peptide-reactive T cells, the apoptosis of flesh CD4+ T cells and CD8+ T cells in peripheral blood and spleen was analyzed on day 20 firstly. Two injections of tNPs resulted in increase in the mean percentage of total apoptotic CD4+ T cells by 62.0% in peripheral blood mononuclear cells and 48.0% in SPCs as compared with the blank-NPs group (Figure 7A), while the mean percentage of total apoptotic CD8+ T cells increased by 63.9% in peripheral blood mononuclear cells and 100% in SPCs (Figure 7B). As a non-target control, the MOG− tNPs also caused significantly higher apoptosis level of CD4+ and CD8+ T cells than blank-NPs group, suggesting the nonspecific modulation of the MOG− tNPs which carry anti-Fas, PD-L1-Fc, TGF-β and CD47-Fc.
 | Figure 7 Infusions of tNPs induce apoptosis of T cells and inhibit the proliferation of MOG peptide-reactive T cells in EAE mice. |
Furthermore, the flesh SPCs were co-incubated with MOG35–55 or MOG40–54 peptide for 7 days. The proliferation of CD4+ and CD8+ T cells was determined by CFSE staining and flow cytometry analyses. After the MOG peptide stimulation, the proliferation of both CD4+ T cells and CD8+ T cells was reduced by 66.1% and 55.6%, respectively, in the tNPs group as compared with the blank-NPs group (Figure 7C). Meanwhile, MOG− tNPs also significantly inhibited the proliferation of T cells, with the levels being lower than that of blank-NPs group and much higher than that of tNPs group. These data suggested that the tNPs reduced MOG peptide-reactive T cells by inducing apoptosis and inhibiting proliferation, in an antigen-specific manner and regulatory molecule-dependent fashion.
Discussion
Numerous therapeutics have been developed for the treatment of MS or EAE by using biomimetic NPs. But most of these NPs aim to induce tolerogenic APCs by which they induce T cell tolerance.19–22 In this nanoscale platform, four points are different from the previous researches. First, the previous nanoparticles carry myelin proteins or peptides as target antigens instead of the myelin peptide-loaded MHCs (pMHCs) in the antigen-specific treatments of EAE or MS.19,21,33 Here, the myelin peptide-loaded pMHC multimers are co-coupled on the surface of tNPs and function as target antigens to directly bind to the T cell receptors (TCRs) onto myelin-autoreactive T cells, without the requirement of cellular uptake, processing and presentation by APCs, thus enacting the direct and on-target depletion and modulation of autoreactive T cells. Second, to minimize the intake of NPs by phagocytes and prolong their circulation time in vivo, “self-marker” CD47 molecules were co-displayed onto the tNPs to prevent phagocytosis or endocytosis since they can interact with SIRPα expressed on phagocytes. Recombinant CD47 protein has been used to construct the “stealth particles” in NP-mediated drug delivery systems in humans.34,35 Third, most of researches focus on CD4+ T cells modulation, since myelin-autoreactive CD4+ T cells, such as Th1, Th17 and Treg cells, act as crucial drivers or regulators in autoimmune demyelinating diseases.36–38 But increasing studies have also demonstrated the important contributions of myelin antigen-specific CD8+ T cells such as Tc1 and Tc17 cells in MS and EAE progression.39,40 Tc1 and Tc17 cells which newly defined as CD8+ T cells producing IFN-γ or IL-17 are thought to be primary proinflammatory cells and mediate many effects similar to Th1 and Th17 cells in several autoimmune diseases including MS and EAE.41 So, in this study, both pMHC class I and class II multimers were co-displayed onto the tNPs to tailor the combination therapy targeting pathogenic MOG35–55-specific CD4+ T cells and MOG40–54-specific CD8+ T cells. Actually, two infusions of the tNPs greatly decreased the frequencies of myelin peptide-reactive Th1, Th17, Tc1 and Tc17 in spleen. Finally, the tNPs can present multiple regulatory molecules (anti-Fas, PD-L1-Fc and TGF-β1) to the target T cells by surface ligand presentation and cytokine paracrine relsease, in the same spatial and temporal manner, and thus can directly modulate the T cells through several signal pathways. But most of NPs reported previously usually only carry one kind of toxin or regulatory molecule. Another advantage of the tNPs is that the 217 nm tNPs not only can circulate into secondary lymphoid tissues to modulate circulation myelin-reactive T cells, but also penetrate through the brain–blood barrier and modulate the pathogenic T cells that infiltrated into CNS, thus minimizing the local autoimmune responses. Taken together, these different works from previous researches suggest a novel combination immunotherapy which focuses on the on-target and direct modulation of myelin-autoreactive T cells and the combined use of multiple regulatory molecules by generating a tNP for the T cell-mediated autoimmune diseases.
The in vivo mechanisms by which the multipotent tNPs decreased 56.2%–82.6% of myelin-reactive CD4+ and CD8+ T cells were further defined. Here, the tNPs circulated throughout vasculature into various organs, secondary lymphoid tissues and CNS, and contacted with myelin-reactive CD4+ and CD8+ T cells to facilitate their vigorous apoptosis, inhibit their proliferation and the production of inflammatory cytokines (IFN-γ/IL-17A), and induce Tregs and the secretion of inhibitory cytokines (IL-10/TGF-β). These modulations on T cells should depend on the combined or synergistic effects of anti-Fas, PD-L1 and TGF-β presented or paracrined by the tNPs. Functional anti-Fas mAb is a traditional and powerful modulator that induces cell apoptosis. Binding of PD-L1 with PD-1 expressed on T cells leads to diminished proliferation process, cytokine secretion and survival of effector T cells, and mitigate the EAE severity.42–44 For TGF-β1, the signal was found to be required for the maintenance of peripheral CD4+ Tregs subset and to prevent sensitized T cells from infiltrating into the CNS tissue.45–47 Notably, the native Tregs display the CD4+/CD25+/FoxP3+ phenotype and contribute to the suppression of autoreactive T cells. The adaptive Tregs include IL-10–secreting type 1 Tregs (Tr1), TGF-β–secreting Th3-type Tregs and so on. The TGF-β and IL-10 play pivotal role in mediating the immunosuppressive effects and are considered to be typical markers of adaptive Tregs.48–50 In this study, two infusions of the tNPs increased Tregs (CD4+CD25+FoxP3+) by 77.4% and elevated the production of TGF-β1 and IL-10 by about 37.5% and 100.5% in SPCs, indicating the skewed differentiation of Th cells from inflammatory Th1 and Th17 phenotypes to the regulatory phenotypes.
Several technical notes are worthy of mentioning. EAE can be induced by immunization with different myelin proteins. MOG, a transmembrane protein expressed on the outermost layer of myelin membrane and oligodendrocytes, constitutes only 0.05%–0.1% of the total myelin protein in the body, but it was reported to induce more potent T cell responses than other myelin antigens in patients with MS. MOG35–55 peptide is the major immunodominant epitope of MOG and has been identified as an agonist of encephalitogenic T cells in the C57BL/6 mouse model.48,51 More than 98% of CD4+ T cells express a specific TCR of the I-Ab–restricted MOG35–55 epitope, and many CD8+ T cells express a specific TCR of the H-2Db–restricted MOG40–54 epitope in EAE model of C57BL/6 mice.36 Based on these findings, in this study, the tNPs targeting the MOG35–55-specific CD4+ T cells and MOG40–54-specific CD8+ T cells were generated for the treatment of MOG35–55 peptide-induced active EAE.
Since NPs with a diameter of <100 nm are much easier to be internalized by phagocytes and tissue cells than 200 nm NPs, even if they are fabricated with CD47 molecules, so in this study the tNPs were generated in a diameter range from 180 to 260 nm with a mean size of 217 nm. On the other hand, 200 nm NPs can penetrate through the mucus layer,52 while only the NPs of <100 nm can sneak through the endothelial lining to escape systemic circulation53 and the sub-100 nm and modified NPs can diffuse through the blood–brain barrier into the brain.54,55 But the ability of NPs to cross barriers can be enhanced by disease.56 Inflammation can increase vessel permeability at specific injury sites, thus affecting NPs distribution.57 The blood–brain barrier in EAE mice is damaged in the course of disease progression; thus, the 217 nm NPs can penetrate through the leaky vasculature and choroid plexus into the brain. Here, the tNPs were found in the brain tissue and co-localized with T cells. Consequently, the pathogenic CD4+ and CD8+ T cells were markedly reduced in the CNS tissue with the elevated production of TGF-β1 and IL-10. Our data suggest a 200 nm targeted delivery system for CNS inflammatory diseases. In addition, CD47+ tNPs retained in brain were much more than the CD47− tNPs from 2 to 24 h after injection and increased by 175% than CD47− tNPs at 12 h time point. The results are also in agreement with the finding from Bruns et al that CD47 increased the penetration and retention of PLGA-NPs in the damaged brain, thus enhancing the in vivo functionality of artificial APCs.58
Here, the 217 nm tNPs were decorated with CD47-Fc, which led to a longer retention time in vivo and much fewer co-localizations with macrophages and DCs than the CD47− tNPs, implying that CD47 molecules onto tNPs may minimize the engulfment of tNPs by phagocytes as expected. But we cannot eliminate the possibility of endocytosis and phagocytosis occurring in vivo. Therefore, it is reasonable to conclude that the tNPs modulate the autoreactive T cells in vivo mainly in a direct contact way, but an indirect pathway mediated by Tregs and tolerogenic APCs may also be involved in this treatment. Although our results showed intriguing prospects of the multipotent tNPs in immunotherapy, many aspects still need to be further investigated for the approaches from bench to bedside. More T cell epitopes derived from myelin antigens should be used to target more myelin-autoreactive T cell clones in translational studies; the density and ratio of target antigens (pMHC multimers) and multiple regulatory molecules loaded by tNPs should be further titrated to achieve maximal antigen-specific modulation on T cells with minimal bystander killing.
Conclusion
Our preclinical data demonstrate that the 217 nm PLGA-NPs carrying pMHC target antigens, multiple regulatory molecules and “self-marker” are capable of durably ameliorating EAE by directly and selectively modulating autoreactive T cells in a surface-presenting and paracrine-releasing manner. The in vivo mechanism of autoinhibition and the tissue distribution were also initially defined. This strategy may pave a new avenue for the treatment of T cell-mediated autoimmune disorders.
Acknowledgments
This work was supported by grants from the National Natural Science Foundation of China (81172823 and 81372448), Science and Technology Support Program of Jiangsu Province (BE2017714) and Postgraduate Research and Practice Innovation Program of Jiangsu Province (KYCX17_0164). The sponsors had no role in the study design, data collection and analyses, preparation of the manuscript or decision to submit the article for publication.
Disclosure
The authors report no conflicts of interest in this work.
References
Turjeman K, Bavli Y, Kizelsztein P, et al. Nano-drugs based on nano sterically stabilized liposomes for the treatment of inflammatory neurodegenerative diseases. PLoS One. 2015;10(7):e0130442. | ||
Reichardt HM, Gold R, Luhder F. Glucocorticoids in multiple sclerosis and experimental autoimmune encephalomyelitis. Expert Rev Neurother. 2006;6(11):1657–1670. | ||
Vosoughi R, Freedman MS. Therapy of MS. Clin Neurol Neurosurg. 2010;112(5):365–385. | ||
de Rosbo NK, Kaye JF, Eisenstein M, et al. The myelin-associated oligodendrocytic basic protein region MOBP15-36 encompasses the immunodominant major encephalitogenic epitope(s) for SJL/J mice and predicted epitope(s) for multiple sclerosis-associated HLA-DRB1*1501. J Immunol. 2004;173(2):1426–1435. | ||
Jadidi-Niaragh F, Mirshafiey A. The deviated balance between regulatory T cell and Th17 in autoimmunity. Immunopharmacol Immunotoxicol. 2012;34(5):727–739. | ||
Tam RY, Fuehrmann T, Mitrousis N, Shoichet MS. Regenerative therapies for central nervous system diseases: a biomaterials approach. Neuropsychopharmacology. 2014;39(1):169–188. | ||
Taner T, Hackstein H, Wang Z, Morelli AE, Thomson AW. Rapamycin-treated, alloantigen-pulsed host dendritic cells induce ag-specific T cell regulation and prolong graft survival. Am J Transplant. 2005;5(2):228–236. | ||
Harrison LC. Vaccination against self to prevent autoimmune disease: the type 1 diabetes model. Immunol Cell Biol. 2008;86(2):139–145. | ||
Lutterotti A, Yousef S, Sputtek A, et al. Antigen-specific tolerance by autologous myelin peptide-coupled cells: a phase 1 trial in multiple sclerosis. Sci Transl Med. 2013;5(188):188ra175. | ||
Van Brussel I, Lee WP, Rombouts M, et al. Tolerogenic dendritic cell vaccines to treat autoimmune diseases: can the unattainable dream turn into reality? Autoimmun Rev. 2014;13(2):138–150. | ||
Mansilla MJ, Selles-Moreno C, Fabregas-Puig S, et al. Beneficial effect of tolerogenic dendritic cells pulsed with MOG autoantigen in experimental autoimmune encephalomyelitis. CNS Neurosci Ther. 2015;21(3):222–230. | ||
Zhang L, Guo Y, Xia CQ. Infusion of Sulfosuccinimidyl-4-[N-maleimidomethyl]cyclohexane-1-carboxylate-conjugated MOG35-55-coupled spleen cells effectively prevents and reverses experimental autoimmune encephalomyelitis in mice. J Immunol Res. 2015;2015:129682. | ||
Kleist C, Mohr E, Gaikwad S, et al. Autoantigen-specific immunosuppression with tolerogenic peripheral blood cells prevents relapses in a mouse model of relapsing-remitting multiple sclerosis. J Transl Med. 2016;14(1):99. | ||
MartIn-Fontecha A, Sebastiani S, Hopken UE, et al. Regulation of dendritic cell migration to the draining lymph node: impact on T lymphocyte traffic and priming. J Exp Med. 2003;198(4):615–621. | ||
Tacken PJ, de Vries IJ, Torensma R, Figdor CG. Dendritic-cell immunotherapy: from ex vivo loading to in vivo targeting. Nat Rev Immunol. 2007;7(10):790–802. | ||
Zhou H, Fan Z, Deng J, et al. Hyaluronidase embedded in nanocarrier PEG shell for enhanced tumor penetration and highly efficient antitumor efficacy. Nano Lett. 2016;16(5):3268–3277. | ||
Thao le Q, Byeon HJ, Lee C, et al. Pharmaceutical potential of tacrolimus-loaded albumin nanoparticles having targetability to rheumatoid arthritis tissues. Int J Pharm. 2016;497(1–2):268–276. | ||
Thondawada M, Wadhwani AD. An effective treatment approach of DPP-IV inhibitor encapsulated polymeric nanoparticles conjugated with anti-CD-4 mAb for type 1 diabetes. Drug Dev Ind Pharm. 2018:1–10. | ||
Getts DR, Martin AJ, McCarthy DP, et al. Microparticles bearing encephalitogenic peptides induce T-cell tolerance and ameliorate experimental autoimmune encephalomyelitis. Nat Biotechnol. 2012;30(12):1217–1224. | ||
Yeste A, Nadeau M, Burns EJ, Weiner HL, Quintana FJ. Nanoparticle-mediated codelivery of myelin antigen and a tolerogenic small molecule suppresses experimental autoimmune encephalomyelitis. Proc Natl Acad Sci U S A. 2012;109(28):11270–11275. | ||
Hunter Z, McCarthy DP, Yap WT, et al. A biodegradable nanoparticle platform for the induction of antigen-specific immune tolerance for treatment of autoimmune disease. ACS Nano. 2014;8(3):2148–2160. | ||
Cappellano G, Woldetsadik AD, Orilieri E, et al. Subcutaneous inverse vaccination with PLGA particles loaded with a MOG peptide and IL-10 decreases the severity of experimental autoimmune encephalomyelitis. Vaccine. 2014;32(43):5681–5689. | ||
Maldonado RA, LaMothe RA, Ferrari JD, et al. Polymeric synthetic nanoparticles for the induction of antigen-specific immunological tolerance. Proc Natl Acad Sci U S A. 2015;112(2):E156–E165. | ||
Cho JJ, Stewart JM, Drashansky TT, et al. An antigen-specific semi-therapeutic treatment with local delivery of tolerogenic factors through a dual-sized microparticle system blocks experimental autoimmune encephalomyelitis. Biomaterials. 2017;143:79–92. | ||
Lu JM, Wang X, Marin-Muller C, et al. Current advances in research and clinical applications of PLGA-based nanotechnology. Expert Rev Mol Diagn. 2009;9(4):325–341. | ||
Danhier F, Ansorena E, Silva JM, Coco R, Le Breton A, Preat V. PLGA-based nanoparticles: an overview of biomedical applications. J Control Release. 2012;161(2):505–522. | ||
Kapoor DN, Bhatia A, Kaur R, Sharma R, Kaur G, Dhawan S. PLGA: a unique polymer for drug delivery. Ther Deliv. 2015;6(1):41–58. | ||
Iqbal M, Zafar N, Fessi H, Elaissari A. Double emulsion solvent evaporation techniques used for drug encapsulation. Int J Pharm. 2015;496(2):173–190. | ||
Hofstetter HH, Shive CL, Forsthuber TG. Pertussis toxin modulates the immune response to neuroantigens injected in incomplete Freund’s adjuvant: induction of Th1 cells and experimental autoimmune encephalomyelitis in the presence of high frequencies of Th2 cells. J Immunol. 2002;169(1):117–125. | ||
Fissolo N, Costa C, Nurtdinov RN, et al. Treatment with MOG-DNA vaccines induces CD4+CD25+FoxP3+ regulatory T cells and up-regulates genes with neuroprotective functions in experimental autoimmune encephalomyelitis. J Neuroinflammation. 2012;9:139. | ||
Wen J, Ribeiro R, Tanaka M, Zhang Y. Activation of CB2 receptor is required for the therapeutic effect of ABHD6 inhibition in experimental autoimmune encephalomyelitis. Neuropharmacology. 2015;99:196–209. | ||
Pino PA, Cardona AE. Isolation of brain and spinal cord mononuclear cells using percoll gradients. J Vis Exp. 2011(48):pii 2348. | ||
Getts DR, Shea LD, Miller SD, King NJC. Harnessing nanoparticles for immune modulation: (Trends in Immunology 36, 419–427; July 2016). Trends Immunol. 2016;37(10):715. | ||
Tsai RK, Rodriguez PL, Discher DE. Self inhibition of phagocytosis: the affinity of “marker of self” CD47 for SIRPalpha dictates potency of inhibition but only at low expression levels. Blood Cells Mol Dis. 2010;45(1):67–74. | ||
Massarelli E, Papadimitrakopoulou V, Welsh J, Tang C, Tsao AS. Immunotherapy in lung cancer. Transl Lung Cancer Res. 2014;3(1):53–63. | ||
Bettelli E, Pagany M, Weiner HL, Linington C, Sobel RA, Kuchroo VK. Myelin oligodendrocyte glycoprotein-specific T cell receptor transgenic mice develop spontaneous autoimmune optic neuritis. J Exp Med. 2003;197(9):1073–1081. | ||
Weiner HL. Multiple sclerosis is an inflammatory T-cell-mediated autoimmune disease. Arch Neurol. 2004;61(10):1613–1615. | ||
Bielekova B, Sung MH, Kadom N, Simon R, McFarland H, Martin R. Expansion and functional relevance of high-avidity myelin-specific CD4+ T cells in multiple sclerosis. J Immunol. 2004;172(6):3893–3904. | ||
Huseby ES, Liggitt D, Brabb T, Schnabel B, Ohlen C, Goverman J. A pathogenic role for myelin-specific CD8(+) T cells in a model for multiple sclerosis. J Exp Med. 2001;194(5):669–676. | ||
Fischer HJ, van den Brandt J, Lingner T, et al. Modulation of CNS autoimmune responses by CD8(+) T cells coincides with their oligoclonal expansion. J Neuroimmunol. 2016;290:26–32. | ||
Glenn JD, Smith MD, Calabresi PA, Whartenby KA. Mesenchymal stem cells differentially modulate effector CD8+ T cell subsets and exacerbate experimental autoimmune encephalomyelitis. Stem Cells. 2014;32(10):2744–2755. | ||
Salama AD, Chitnis T, Imitola J, et al. Critical role of the programmed death-1 (PD-1) pathway in regulation of experimental autoimmune encephalomyelitis. J Exp Med. 2003;198(1):71–78. | ||
Carter LL, Leach MW, Azoitei ML, et al. PD-1/PD-L1, but not PD-1/PD-L2, interactions regulate the severity of experimental autoimmune encephalomyelitis. J Neuroimmunol. 2007;182(1–2):124–134. | ||
Zamani MR, Aslani S, Salmaninejad A, Javan MR, Rezaei N. PD-1/PD-L and autoimmunity: a growing relationship. Cell Immunol. 2016;310:27–41. | ||
Fantini MC, Becker C, Monteleone G, Pallone F, Galle PR, Neurath MF. Cutting edge: TGF-beta induces a regulatory phenotype in CD4+CD25- T cells through Foxp3 induction and down-regulation of Smad7. J Immunol. 2004;172(9):5149–5153. | ||
Marie JC, Liggitt D, Rudensky AY. Cellular mechanisms of fatal early-onset autoimmunity in mice with the T cell-specific targeting of transforming growth factor-beta receptor. Immunity. 2006;25(3):441–454. | ||
Mirshafiey A, Mohsenzadegan M. TGF-beta as a promising option in the treatment of multiple sclerosis. Neuropharmacology. 2009;56(6–7):929–936. | ||
Howell MD, Winters ST, Olee T, Powell HC, Carlo DJ, Brostoff SW. Vaccination against experimental allergic encephalomyelitis with T cell receptor peptides. Science. 1989;246(4930):668–670. | ||
Chen Y, Kuchroo VK, Inobe J, Hafler DA, Weiner HL. Regulatory T cell clones induced by oral tolerance: suppression of autoimmune encephalomyelitis. Science. 1994;265(5176):1237–1240. | ||
Groux H, O’Garra A, Bigler M, et al. A CD4+ T-cell subset inhibits antigen-specific T-cell responses and prevents colitis. Nature. 1997;389(6652):737–742. | ||
Stromnes IM, Goverman JM. Active induction of experimental allergic encephalomyelitis. Nat Protoc. 2006;1(4):1810–1819. | ||
Cu Y, Saltzman WM. Drug delivery: stealth particles give mucus the slip. Nat Mater. 2009;8(1):11–13. | ||
Mitragotri S, Lahann J. Physical approaches to biomaterial design. Nat Mater. 2009;8(1):15–23. | ||
Bhaskar S, Tian F, Stoeger T, et al. Multifunctional nanocarriers for diagnostics, drug delivery and targeted treatment across blood-brain barrier: perspectives on tracking and neuroimaging. Part Fibre Toxicol. 2010;7:3. | ||
Hwang SR, Kim K. Nano-enabled delivery systems across the blood-brain barrier. Arch Pharm Res. 2014;37(1):24–30. | ||
Kohane DS. Microparticles and nanoparticles for drug delivery. Biotechnol Bioeng. 2007;96(2):203–209. | ||
Chen KH, Lundy DJ, Toh EK, et al. Nanoparticle distribution during systemic inflammation is size-dependent and organ-specific. Nanoscale. 2015;7(38):15863–15872. | ||
Bruns H, Bessell C, Varela JC, et al. CD47 Enhances in vivo functionality of artificial antigen-presenting cells. Clin Cancer Res. 2015;21(9):2075–2083. |
Supplementary materials
The gating strategy and isotype controls for interleukin (IL)-17A and interferon (IFN)-γ staining in Figure 6A and B have been provided in Figure S1. The gating strategy for each figure of flow cytometry has also been described below.
 | Figure S1 The flow cytometry gating strategy and isotype controls for IL-17A and IFN-γ staining in Figure 6A and B. |
Figure 2B and D: tNPs were stained with three-color fluorescence antibodies. There were no cells in the samples. Blank-NPs pre-blocked with bovine serum albumin were stained with these antibodies in parallel as the blank control. Figure 2B shows the single-positive histograms, and Figure 2D shows the double-positive dot plots.
Figure 3F: Central nervous system tissues were processed into single cell suspensions and then stained with allophycocyanin (APC)-anti-mouse CD4, fluorescein isothiocyanate (FITC)-anti-mouse CD8a and PE-anti-mouse CD3e. First, all cells in the suspensions were gated; then, the CD4+ or CD8+ T cells were shown, respectively, in dot plots and the frequencies of CD4+ or CD8+ T cells in the single cell populations of central nervous system tissue were calculated.
Figure 6A and B: After co-culturing with MOG35–55 or MOG40–54 peptides for 16 h, the spleen cells from each group were stained with FITC-anti-mouse CD4 and APC-anti-mouse CD8a for 30 min at 4°C. After that, intracellular staining with PE-anti-mouse IFN-γ or PE-anti-mouse IL-17A was conducted. As shown in Figure S1, the lymphocytes in the spleen cells were firstly gated according to their position in the side scatter/forward scatter (SSC/FSC) dot plots, then FITC-CD4 T cells or APC-CD8 T cells were secondly gated, and finally, the percentages of PE-IL-17+/FITC-CD4+ T cells and PE-IFN-γ+/FITC-CD4+ T cells in CD4+ T cell populations, or the percentages of PE-IL-17+/APC-CD8+ T cells and PE-IFN-γ+/APC-CD8+ T cells in the CD8+ T cells populations were displayed in dot plots. The isotype controls (PE-rat IgG2a and PE-rat IgG1) of PE-anti-mouse IL-17A and PE-anti-mouse IFN-γ were also stained with the cell samples in parallel, and are displayed in Figure S1. The isotype controls for CD3, CD4 and CD8 staining were also carried out routinely, but data are not shown here.
Figure 6C: Regulatory T cell detection. Flesh spleen cells were stained with APC-anti-mouse CD25 and FITC-anti-mouse CD4, followed by intracellular staining of PE-anti-mouse Foxp3. First, lymphocytes in the spleen cells were gated according to their position in the SSC/FSC dot plots, then FITC-CD4+ T cells were secondly gated, and finally, the percentages of PE-Foxp3+/APC-CD25+ T cells in the CD4+ T cell populations were displayed in dot plots. Isotype controls from the mouse Treg Detection Kit were run in parallel.
Figure 7A and B: The frequencies of apoptotic cells in the CD4+ T cell populations or CD8+ T cell populations. Peripheral blood mononuclear cells or spleen cells were stained by APC-anti-mouse CD4 or APC-anti-mouse CD8a for 30 min at 4°C and then stained with Annexin V and propidium iodide. As described, the lymphocytes in the cell suspensions were gated according to their position in the SSC/FSC dot plots, then APC-CD4+ T cells or APC-CD8+ T cells were secondly gated, and finally, the frequencies of Annexin V+/PI+ T cells in the CD4+ T cell populations or CD8+ T cell populations were displayed in dot plots.
Figure 7C: T cell proliferation assay. Spleen cells prelabeled with carboxyfluorescein succinimidyl ester were co-cultured with MOG peptides for 7 days. Then, the cells were further stained with PE-anti-mouse CD3e and APC-anti-mouse CD4 or CD8a. First, the PE-CD3+ T cells were gated from the cell suspensions, then the APC-CD4+ T cells or APC-CD8+ T cells were secondly gated, and finally, the CFSE signals in the CD3+/CD4+ T cell populations or CD3+/CD8+ T cell populations were displayed in histograms. Cell divisions were demarcated according to CFSE staining brightness.
 © 2018 The Author(s). This work is published and licensed by Dove Medical Press Limited. The
full terms of this license are available at https://www.dovepress.com/terms
and incorporate the Creative Commons Attribution
- Non Commercial (unported, 3.0) License.
By accessing the work you hereby accept the Terms. Non-commercial uses of the work are permitted
without any further permission from Dove Medical Press Limited, provided the work is properly
attributed. For permission for commercial use of this work, please see paragraphs 4.2 and 5 of our Terms.
© 2018 The Author(s). This work is published and licensed by Dove Medical Press Limited. The
full terms of this license are available at https://www.dovepress.com/terms
and incorporate the Creative Commons Attribution
- Non Commercial (unported, 3.0) License.
By accessing the work you hereby accept the Terms. Non-commercial uses of the work are permitted
without any further permission from Dove Medical Press Limited, provided the work is properly
attributed. For permission for commercial use of this work, please see paragraphs 4.2 and 5 of our Terms.