Back to Journals » Drug Design, Development and Therapy » Volume 16
Dioscin Regulating Bone Marrow Apoptosis in Aplastic Anemia
Authors Zhang L, Ni R, Li J ![]() , Fan L, Song Y, Wang H, Wang A, Liu B
, Fan L, Song Y, Wang H, Wang A, Liu B
Received 14 April 2022
Accepted for publication 1 September 2022
Published 8 September 2022 Volume 2022:16 Pages 3041—3053
DOI https://doi.org/10.2147/DDDT.S370506
Checked for plagiarism Yes
Review by Single anonymous peer review
Peer reviewer comments 4
Editor who approved publication: Prof. Dr. Tin Wui Wong
Le Zhang,1,* Runfeng Ni,1,* Jiani Li,2,* Liwei Fan,1 Yanqi Song,1 Haijin Wang,1 Aidi Wang,1 Baoshan Liu1
1Department of Traditional Chinese Medicine, General Hospital of Tianjin Medical University, Tianjin, 300052, People’s Republic of China; 2Department of Gynecology, Xiyuan Hospital of China Academy of Chinese Medical Sciences, Beijing, 100091, People’s Republic of China
*These authors contributed equally to this work
Correspondence: Baoshan Liu; Aidi Wang, Department of traditional Chinese medicine, General Hospital of Tianjin Medical University, Tianjin, 300052, People’s Republic of China, Email [email protected]; [email protected]
Background: Aplastic anemia (AA), a disease of bone marrow failure, is caused by CD8+T mediated apoptosis of hematopoietic cells. However, traditional immunosuppressive therapy (IST) has severe liver and kidney toxicity and even cannot achieve the expected therapeutic effect in some patients.
Purpose: Our study is aimed to investigate the effect and mechanism of dioscin (DNS) for treating AA.
Methods: Briefly, we established and evaluated the AA mouse model, DNS and positive control drugs were used for intervention treatment. After 14 days of intervention, femoral bone marrow pathology, bone marrow mononuclear cells (BMMCs) apoptosis rate, bone marrow CD34+ cell surface Fas (CD95) expression and Fas signaling pathway key proteins were detected.
Results: After the establishment of the AA mouse model, the number of peripheral blood cells including granulocytes, erythrocytes, hemoglobin, platelets and reticulocytes in the AA group model was significantly decreased compared with the group control (P < 0.01). The degree of bone marrow hyperplasia in the sternum and femur is extremely low. After different drug interventions, compared with the group model, the number of peripheral blood cells in the AA mice rebounded significantly in group DNS (P < 0.01). Not only that the apoptosis rate of BM-MCs decreased (P < 0.01), meanwhile, the CD95 molecule expressed on the CD34+ bone marrow cells had a significant decline (P < 0.01), and the expression level of the key proteins of Fas signaling pathway was also significantly decreased (P < 0.01).
Conclusion: DNS recovered the peripheral pancytopenia and bone marrow failure in AA mice. DNS reduced the key protein of Fas signaling pathway level to inhibit apoptosis of bone marrow cells to treat AA.
Keywords: dioscin, aplastic anemia, apoptosis, mice, Fas/FasL
Introduction
Aplastic anemia (AA) is a bone marrow failure syndrome characterized by destruction of hematopoietic cells and peripheral blood pancytopenia. AA patients has a bone marrow failure that can lead to anemia, purpura, haemorrhage and infrequent infection.1,2 Epidemiological investigations showed that the annual incidence of aplastic anemia is 0.74/100,000 in China, which is significantly higher than that in European and American countries.3 Furthermore, the incidence of AA is markedly increasing in Asia.4,5
Currently, AA is mainly treated with hematopoietic stem cell transplantation (HSCT) and immunosuppressive therapy (IST).6,7 HSCT is widely considered as the only curative method for AA; however, due to the age of patients, available donors for transplantation, the risk of graft versus host disease (GVHD) and concurrent severe infections after transplantation, the choice and application of HSCT for AA patients are restricted. Therefore, the IST, antihuman thymocyte globulin (ATG) combined with cyclosporin A (CsA), is regarded as the first-line treatment for non-transplanted AA patients,8 but there were also some patients who are ineffective or unresponsive to IST treatment had to attempt other substitutive therapy and maintenance treatment. The long-term use of immunosuppressants (such as CsA) with the accompanying nephrotoxic and neurotoxic side effects brought more pain to patients and was a life-threatening for severe cases.9,10 In addition, patients had to receive the intermittent blood transfusion during immunosuppressive therapy. As a result, the long-term blood transfusion causes iron overload and affects the treatment of the disease.8 Therefore, inventing new drugs is crucial to treatment of AA.
Dioscin, an aglycone of steroidal saponins, exists in the rhizomes of Dioscorea nipponica Makino, the rhizomes of D. zingiberensis C. H. Wright, the rhizomes of D. futschauensis Uline and other plants. Dioscin derived from Dioscorea nipponica Makino is also called Dioscorea nipponica saponins (DNS). Extracts from these plants have been traditionally used to treat diabetes, hypercholesterolemia and gastrointestinal diseases.12–14 DNS obtained from hydrolysis of steroidal saponins was a main raw material for producing the synthesis of hormonal drugs, such as dehydroepiandrosterone.15 DNS showed an anti-proliferative and pro-apoptotic activities for cancer cells in vitro,16,17 including breast cancer, colorectal cancer, osteosarcoma and leukemia.13,18,19 Nevertheless, it was also one of the famously adjuvant and alternative medicines to treat coronary disease and angina pectoris in China.20 Results from cytobiological studies suggested that DNS possesses anti-inflammatory, hypolipidemic and anticancer effect.11,21 Our research group did some previous studies on the effect and mechanism of DNS for treating AA. We found that DNS improved the peripheral hemogram in AA mice, regulated immunity and had an important potential in promoting the proliferation of bone marrow cells and hematopoietic cells.22–24 In addition, DNS could restore Th17/Treg balance in AA mice to maintain immune homeostasis through Notch/RBPJκ/FOXP3/RORγt signaling, which plays a positive therapeutic role.25 Furthermore, the mechanism of DNS may be related to cell apoptosis, but the specific targets and mechanisms need to be studied further. Hence, this study was aimed at providing an experimental basis to confirm whether DNS improves the hematopoietic function of bone marrow by regulating the apoptosis of bone marrow cells for its clinical application to treat AA.
Materials and Methods
Animals
Sixty SPF grade Balb/c male mice (age: 6–8 weeks; weight: 20g ± 2g) and 6 DBA/2 male mice (age: 6 weeks; weight: 20g ± 2g) were purchased from BEIJING HFK BIOSCIENCE CO. and fed in the Experimental Animal Center of Tianjin Medical University. The experiment was carried out after adaptive feeding for 7 days and conducted in accordance with the Guide for the Care and Use of Laboratory Animals (revised in 1996) of the National Institutes of Health of China and approved by the Animal Management and Ethics Committee of Tianjin Medical University.
Animal Grouping
After establishing the AA model, the Balb/c mice with AA (n = 40) were randomly divided into 4 groups: group DNS treatment (DNS, n = 10), group CsA treatment (CsA, n = 10), group TG treatment (TG, n = 10) and group AA model (model, n = 10). In addition, 10 healthy Balb/c mice that did not replicate the model were regarded as the group control (CON, n = 10).
Duplication of Aplastic Anemia Mouse Model
DBA/2 mice were killed via cervical dislocation, soaked in 75% ethanol for 3 minutes. The thymus and lymph nodes from the neck and axilla were removed aseptically, homogenized in phosphate-buffered saline (PBS), filtered through 70 μm cell mesh, washed in PBS, and counted. Then, thymus and lymph node cells were mixed at a ratio of 1:2, and cell activity was identified by Taipan blue staining to guarantee the counts of active cells reach 95% or more. Adjusting the concentration of mixture cell to 5×10⁶/mL. Each Balb/c mouse received 5 Gy TBI from 137Cs γ-rays (Institute of Radiation Medicine of Chinese Academy of Medical Sciences) and was injected with the thymus-lymph node cells (1×10⁶/0.2 mL/mouse) through the sterile tail vein within 4 hours after irradiation.
Treatments
According to the method of equivalence calculation between human and animal body surface area conversion in the “Methodology of Pharmacological Research on Chinese Medicine”, the following is the dosage of drugs: 74.88 mg/kg/d (equivalent to 9.60 mg/kg/d for adults) for the group DNS (Shaanxi Hengcheng Pharmaceutical Co., Ltd.), 23.5 mg/kg/d (equivalent to 3.00 mg/kg/d for adults) for the group CsA (Hangzhou Zhongmei Huadong Pharmaceutical Co., Ltd.), 9.36 mg/kg/d (equivalent to 1.20 mg/kg/d for adults) for the group TG (Shanghai Fudan Fuhua Pharmaceutical Co., Ltd.). Drugs were given to each intervention group (once a day for 14 days) by intragastric administration, while the group control and group AA model were given an equal volume of distilled water.
Model Assessment
Peripheral Blood Cell Counts
At 2 days of the experiment, blood (20 μL) was collected from the orbital vein of mice. White blood cells (WBC), red blood cells (RBC), hemoglobin (HGB) and platelets (PLT) were detected by complete blood cell differential counter. The reticulocytes (Ret) were enumerated after staining with Brilliant Cresyl Blue solution (Solarbio). Process: mix the brilliant tar blue staining solution with the complete blood cells in a ratio of 1:1 at room temperature for 15 minutes, make a blood smear as usual. Then, count the number of reticulocytes containing light blue network structure in at least 1000 red blood cells using a microscope at a magnification of 1000X.
Percent reticulocytes = number of reticulocytes in 1000 red blood cells counted/1000.
Sternum Bone Marrow Smear
Mice were killed by cervical dislocation and conducted the following processes: taking out the sternum promptly, holding the sternum with hemostatic forceps, squeezing out the moderate bone marrow, adding to the slide covered with 0.05 mL fetal bovine serum (FBS, Hyclone) beforehand, pushing the bone marrow smear. After drying at room temperature, putting the slides on the staining rack, fixing the cells with a drop of methanol for 3 minutes, adding the Wright Giemsa (Solarbio) working solution (stock solution: buffer =1:9) to slides to cover the surface completely for 20 minutes at room temperature, washing the slides with distilled water from one end to the other end, examining and observing under the microscope.
Femoral Bone Marrow Pathological Section
The mouse femurs were isolated from the muscles, fixed with 4% paraformaldehyde at room temperature for 48 hours, washed 3 times (20 min/times) with PBS and distilled water, respectively, decalcified with EDTA solution (Solarbio) replaced every 7 days (total 28 days). After decalcification, the mouse femurs were washed with running water for 20 minutes in the embedding box and dehydrated with ethanol. Waiting for the dehydration completely, xylene was used for cleaning. The transparent mouse femurs were embedded in paraffin. The paraffin block embedded the mouse femur was cut into 4 μm sections by using a paraffin microtome. Tissue sections were unfolded in a 45°C distilled water tank, picked up with a clean slide, drained and dried on 65°C slide warmers for 1 hour. Dewaxing and staining were conducted by using an automatic staining machine, and the staining time was based on the HE staining kit (Solarbio). Finally, the sections were sealed with neutral gum. HE stained bone marrow sections were observed under an inverted microscope and taking photographs at 200× magnification. Karyocytes were stained blue with hematoxylin, while erythrocyte and bone trabecula were stained red with eosin. The system including granulocytes, erythrocytes, megakaryocytes and lymphocytes was regarded as hematopoietic tissue; meanwhile, bone trabecula, bone and adipose tissue belonged to the non-hematopoietic tissue.
Sample Collection and Analysis
Peripheral Blood Cell Counts
After intragastric administration, peripheral blood cell counts were performed in each mouse of treatment group at 15 days, and the method was the same as the section of model evaluation above.
Femoral Bone Marrow Pathological Section
After intragastric administration, mouse was killed by cervical dislocation, and the femur of mouse in each group was observed for pathological morphology; moreover, the method was the same as the section of model evaluation above.
Flow Cytometry
Mice were sacrificed by cervical dislocation, and BM was flushed out from tibia and femur. The mouse BM-MCs were isolated using the mouse bone marrow mononuclear cell extraction kit and made single cell suspensions with PBS.
Evaluation of cell apoptosis: The single cell suspensions were stained with Annexin V-PE Apoptosis Detection Kit with 7-AAD (Solarbio) according to the manufacturer’s instruction. Cells were collected and examined by flow cytometer, while the data of cell ratio of each group was analyzed with Cell Quest software.
Cell surface antigen test: The single cell suspensions were stained with PE Anti-Mouse CD34 antibody (BD) and APC Anti-Mouse CD95 antibody (BD), based on the manufacturer’s instruction. Cells were collected and examined by flow cytometer, while the data of cell ratio of each group was analyzed with Cell Quest software.
Western Blot Analysis
The BMMCs from the femur and tibia of mouse in each treatment group were collected and lysed with RIPA Lysis Buffer (Beyotime) and Phenylmethylsulfonyl fluoride (Sigma), according to the above method. Western blot analysis was performed with standard procedures: the protein concentrations of the total cell lysates were measured with Pierce BCA protein kit (Biosharp), according to the manufacturer’s instructions. The 20 μg total protein solution was mixed with SDS-PAGE loading buffer and denatured at 95 °C water for 10 min. SDS-PAGE analyses were conducted with 12% polyacrylamide gels. The proteins were transferred to Invitrogen PVDF membranes. The membranes were blocked with 5% non-fat skim milk dissolved in Tris-buffered saline (TBS) buffer added 0.1% Tween (TBS-T) for 1 hour. And then, the membranes were incubated with anti-Fas antibody (Abcam), anti-FasL antibody (Bioss), anti-Caspase 3 antibody (Abmart) and anti-Caspase 8 antibody (Abmart) dissolved in BSA/TBS-T (1:5000) at 4°C environment for 18 h, respectively. Then, the membranes were subsequently washed 3 times (10 min/times) in TBS-T and incubated with horseradish peroxidase (HRP)-coupled anti-rabbit antibody (1:10,000 in BSA/TBS-T) for 1 h. Finally, the membranes were washed 3 times (10 min/times) in TBS- T and rinsed once with TBS, then, the antibody-labeled proteins were tested with ECL reagent. Image analysis was analyzed with Image J.
ELISA Analysis
After the intervention, the mice were sacrificed on D15, the mouse femurs were rapidly separated, the bone marrow cavity was washed with an appropriate amount of sterile PBS, and the cell suspension was collected and centrifuged at 200 g for 5 minutes, and the supernatant was collected. It is used for ELISA detection in 96 well plates. The specific detection method was strictly conducted according to the instructions of TNF-α (KEXING), IFN-γ (KEXING) and IL-4 (KEXING).
Statistical Analysis
Statistical analysis was processed by t-tests and ANOVA. P-value of 0.05 or less was regarded as statistical significance.
Results
Evaluate the Model
Assess the Model by Peripheral Hemograms
The thymus-lymph node cell suspensions from DBA/2 mice were infused into Balb/c mice, whose time was defined as day 1. To identify the successful duplication of AA mouse model, peripheral hemograms were detected on day +2. At day +2, white blood cells (WBC), red blood cells (RBC), hemoglobin (HGB), and platelets (PLT) were significantly lower in the group model compared to the group control (P < 0.05) (Figure 1, Table 1). The results of peripheral blood smear showed that the percentage of reticulocytes in the group model significantly decreased compared to the group control (P < 0.01; Figure 1). In addition, arrows indicated reticulocytes (Figure 1B).
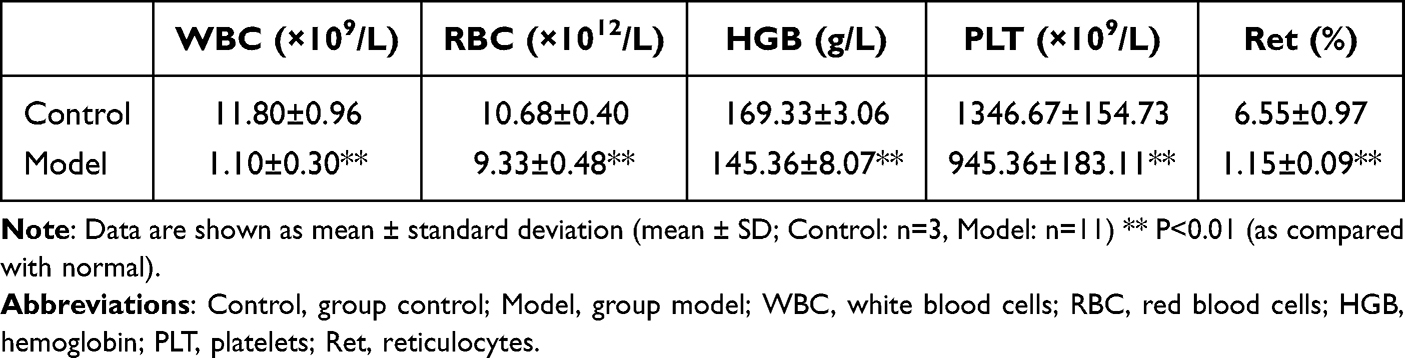 |
Table 1 Peripheral Blood Cell Counts in Control and Model Groups on Day +1 |
 |
Figure 1 Comparison of peripheral hemograms among group Control and Model on day +1. Abbreviations: Control, group control; Model, group model; WBC, white blood cells; RBC, red blood cells; HGB, hemoglobin; PLT, platelets; Ret, reticulocytes. Notes: (A) Routine blood tests were performed with automatic blood cell differential counter at 1 day after the establishment of model. (B) After brilliant tar blue staining, slides were observed under a light microscope and photographed under 10 × 100 resolution. Counting 1000 cells continuously and recording the number of reticulocytes. Data are shown as mean ± standard deviation (mean ± SD; Control: n = 3, Model: n = 11).** P < 0.01 (as compared to normal). |
Assess the Model by Proliferation of Bone Marrow
The results of sternum bone marrow smear showed that the number of sternum bone marrow karyocytes in the group model was significantly decreased compared with the group control (Figure 2A). The result of pathology demonstrated that group model had different degree of hypoplasia than group control. Group control had the hyperplasia of bone marrow with clearly visible megakaryocytes. In the contrary, the bone marrow of group model showed hypoplasia with decreased karyocytes and agenesis megakaryocytes and increased fat granules (Figure 2B).
 |
Figure 2 Bone marrow proliferation among group Control and Model on day +1. Abbreviations: Control, group control; Model, group model. Notes: (A) The sternum bone marrow cells were extracted from randomly chosen mice in group Control and Model at day +1 after overnight fasting. After Wright Giemsa staining, slides were observed under a light microscope and photographed under 10 × 4 resolution. (B) Slides were stained with hematoxylin-eosin staining, observed under a light microscope and captured images at 40× and 100× magnification. |
Peripheral Hemograms
After different drug interventions for 14 days, the peripheral blood cell counts of mice in each group were detected to evaluate the curative effect of DNS. The experimental results showed that the peripheral blood WBC, RBC, HGB and PLT counts of mice in the group model were significantly lower than those in the group control (P < 0.01). Compared with the group model, WBC, RBC, HGB, and PLT counts of the group DNS had varying degrees of rise and statistically significant differences (P < 0.01, P < 0.05). The CsA had the same effect as the DNS in enhancing RBC and PLT counts of peripheral blood, while DNS and TG had better effect than CsA in improving WBC and HGB (Figure 3, Table 2).
 |
Table 2 Peripheral Blood Cell Counts in Different Groups on Day +15 |
 |
Figure 3 Comparison of peripheral hemograms among groups on day +15. Abbreviations: Control, group control; Model, group model; DNS, Dioscorea nipponica saponins-treated group; CsA, cyclosporin A-treated group; TG, ripterygium glycosides-treated group; WBC, white blood cells; RBC, red blood cells; HGB, hemoglobin; PLT, platelets. Notes: Routine blood tests were examined by automatic blood cell differential counter at 15 days after the establishment of model. Data are shown as mean ± SD (n = 4), **P < 0.01 (as compared with Control); #P < 0.05, ##P < 0.01 (as compared with Model). |
Pathology of Bone Marrow
In group model, pathology of bone marrow demonstrated that the area of hematopoietic tissues reduced obviously, more specific, with hypoplasia, decreased karyocytes and agenesis megakaryocytes and increased fat granules. After different drug interventions for 14 days, the hematopoietic area of the bone marrow in each treatment group had different degrees of increase. Furthermore, the group DNS was the most significant, and the group TG had the same effect as the group CsA, which all had less effect than group DNS. Compared with the group model, non-hematopoietic cells including adipocytes were significantly declined in the group DNS; however, a large number of adipocytes were still observed in the group CsA and the group TG (Figure 4).
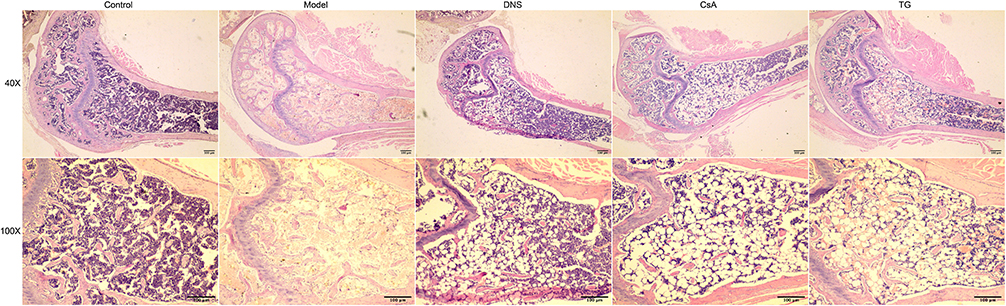 |
Figure 4 Bone marrow proliferation among different groups. Slides were stained with hematoxylin-eosin staining, observed under a light microscope and captured images at 40×, 100× magnification. Abbreviations: Control, group control; Model, group model; DNS, Dioscorea nipponica saponins-treated group; CsA, cyclosporin A-treated group; TG, tripterygium glycosides-treated group. |
Annexin V Based Apoptosis Detection
In this study, annexin V/7ADD binding was used to evaluate the apoptosis of the BMMCs in different groups. The experimental results showed that the apoptosis rate of BMMCs in the group model was significantly higher than that in the group control (P < 0.01). Compared with the group model, the apoptosis rate of BMMCs in the group DNS and group CsA was significantly decreased (P < 0.01). The apoptosis rate of BMMCs in the group TG was decreased and had statistically significant difference compared with the group model (P < 0.05). The effect of CsA and DNS was similar and did not have a statistically significant difference (Figure 5).
 |
Figure 5 Comparison the apoptosis level of bone marrow cells among different groups. Abbreviations: Control, group control; Model, group model; DNS, Dioscorea nipponica saponins-treated group; CsA, cyclosporin A-treated group; TG, tripterygium glycosides-treated group. Notes: Apoptosis of bone marrow cells by flow cytometry. Data are shown as mean ± SD (n = 4), **P<0.01 (as compared with Control); #P<0.05, ##P<0.01 (as compared with Model). |
Fas Expression of CD34+ Bone Marrow Cells
The results of flow cytometry showed that compared with the group control, the Fas expression levels of CD34+ bone marrow cells in the group model were significantly increased (P < 0.01). Compared with the group model, the Fas expression levels of CD34+ bone marrow cells in the Group DNS and Group CsA were significantly decreased (P < 0.01). In addition, the Fas expression levels in group TG decreased indistinctively (P < 0.05). The effect of the CsA and the DNS was equivalent, and the difference was not statistically significant (Figure 6).
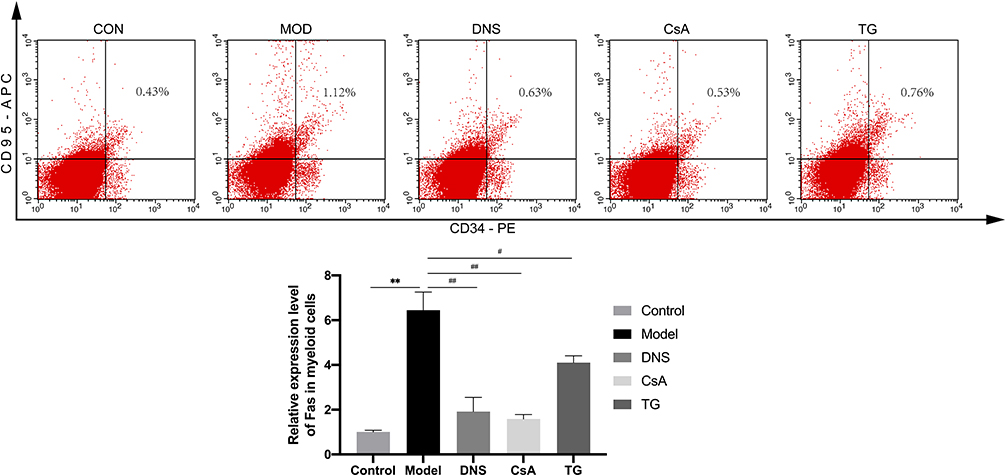 |
Figure 6 Comparison the CD34, CD95 expression level of bone marrow cells among different groups. Abbreviations: Control, group control; Model, group model; DNS, Dioscorea nipponica saponins-treated group; CsA, cyclosporin A-treated group; TG, tripterygium glycosides-treated group. Notes: The CD34, CD95 expression level of bone marrow cells by flow cytometry. Data are shown as mean ± SD (n = 4),**P<0.01 (as compared with Control); #P<0.05, ##P<0.01 (as compared with Model). |
Expression of Fas Signaling Pathway Key Proteins
The Western Blot results showed that the Fas, FasL, Caspase 3 and Caspase 8 protein expression of the bone marrow cells was significantly upregulated in the group model compared with the group control (P < 0.01). After intervening with different drugs for 14 days, compared with the group model, the Fas, Caspase 3 and Caspase 8 protein expression level was downregulated significantly in the group DNS and group CsA (P < 0.01, P < 0.05), but there was no significant difference between the group TG and the group model. Meanwhile, compared with the group control, DNS decreased the expression of FasL significantly (P < 0.01), but there was no significant difference between the group CsA and the group TG compared with the group model (Figure 7).
 |
Figure 7 Expression of key proteins of Fas signaling pathway in bone marrow cells in different groups. Notes: The Fas, FasL, Caspase 3 and Caspase 8 protein expression of bone marrow cells was detected by Western blot, and the results were analyzed using Image J software. Relative abundance of the proteins was expressed compared with β-actin. Data are shown as mean ± SD (n=3), *P<0.05,**P<0.01 (as compared with Control); #P<0.05, ##P<0.01,(as compared with Model). Abbreviations: Control, group control; Model, group model; DNS, Dioscorea nipponica saponins-treated group; CsA, cyclosporin A-treated group; TG, tripterygium glycosides-treated group. |
Expression of Cytokines in the Bone Marrow Cavity
We studied the cytokines in the bone marrow cavity by ELISA. The ELISA results showed that compared with the group control, the expression levels of TNF-α and IFN-γ were significantly upregulated in the group model with the downregulated expression levels of IL-4 (P < 0.01). After intervening with different drugs for 14 days, compared with the group model, DNS and CsA inhibited the secretion of IFN-γ (P < 0.01) and TNF-α (P < 0.05) significantly, while TG only downregulated the expression of IFN-γ (P < 0.01). Moreover, compared with the group model, the expression of IL-4 was upregulated with DNS (P < 0.05) and CsA (P < 0.01), while the group TG showed no significance (Figure 8).
 |
Figure 8 The expression levels of cytokines in the bone marrow cavity of different groups. Abbreviations: Control, group control; Model, group model; DNS, Dioscorea nipponica saponins-treated group; CsA, cyclosporin A-treated group; TG, tripterygium glycosides-treated group. Notes: Expression levels of cytokines TNF-α, IFN-γ and IL-4 in bone marrow cavity were detected by ELISA. Data are shown as mean ± SD (n = 4),**P<0.01 (as compared with Control); #P<0.05, ##P<0.01 (as compared with Model). |
Discussion
Currently, one broad area of agreement is that aplastic anemia is caused by self-deficiency of hematopoietic stem and progenitor cells, immune activation abnormally after viral infection and the change of hematopoietic microenvironment in the bone marrow. More and more researchers recognized that excessive apoptosis of CD34+ bone marrow cells in AA patients is the primary pathogenesis of bone marrow failure, which has been confirmed in both clinical observations and animal experiments. Briefly, there is an imbalance between differentiation and apoptosis of hematopoietic cells in AA. As early as 1995, some studies demonstrated that the apoptosis and cell death-associated gene proportion of CD34+ bone marrow cells in AA patients are significantly higher compared with healthy people, which indicated that the accelerated apoptosis of CD34+ bone marrow cells in AA patients causes deficiency of hematopoietic function.25 Some scholars conducted TUNEL examination on bone marrow mononuclear cells (BMMNCs) in AA patients who did not receive IST and found that the apoptosis index of BMMNCs in very severe AA and severe AA patients was significantly higher than that in non-severe AA patients, which suggested the severity of the disease is closely related to the degree of apoptosis.26 Other researchers analyzed the transcriptome of hematopoietic cells in AA patients and found that a large number of apoptosis and cell death-related genes are expressed in CD34+ cells, and the activity of negative proliferation control gene increased significantly by using oligonucleotide microarray analysis.27 Apoptosis is closely related to the disease progression of AA. Based on the pathogenesis of excessive apoptosis, inhibition of apoptosis may be beneficial to treat AA.
Apoptosis of bone marrow cells is an important pathological basis of AA. In our study, we found that the apoptosis rate of BM-MCs in AA mice was significantly higher than the group control (P < 0.01). After drug intervention for 14 days, compared with the group model, DNS significantly inhibited the apoptosis of BM-MCs, which indicated the anti-apoptotic effect of DNS on BM-MCs in AA mice.
The Fas receptor, also known as CD95 and APO-1, is a kind of death receptor.28 Fas ligand (FasL/CD95L) is its corresponding ligand and attaches to the Fas receptor to promoting apoptosis of the target cells.29 The Fas receptor is expressed in a variety of cells30 and specifically binds to FasL to transduce apoptotic signals, which constitutes the Fas/FasL signal pathway, plays a critical role in apoptosis and integrates with downstream molecular signals to determine the fate of cells.31 The interaction between Fas and its ligand FasL regulates many apoptosis mediated physiological and pathological processes. For example, Fas and FasL regulate T cell selection in the thymus and inhibit the immune responses28 and are related with the occurrence and development of autoimmune diseases.32,33 The Fas/FasL system is connected with the maintenance of hematopoietic homeostasis.34
Cysteine proteases (Caspases) mediate apoptosis through cascade reactions. Caspase 3, a key protein in apoptosis compared with other caspase family members, is at the end of the caspase cascade and activated by upstream signals. Activated Caspase 3 degrades intracellular structural and functional proteins to cause cell death.35 On the other hand, Caspase 8 is at the upstream position of the Caspase cascade and related to Fas (CD95) closely.
The study found that in early AA, the proportion of CD34+ bone marrow cells expressing Fas receptors increased significantly; moreover, with the disease recovering, the proportion of cells decreased again. Furthermore, the high-level expression of Fas receptors is a target of T cell-mediated destructing to CD34+ cells. The results indicated that Fas/FasL system participated in the pathophysiological process of bone marrow failure.36 Likewise, we found that the Fas expression of CD34+ bone marrow cells increased significantly in AA mice, after drug intervention for 14 days, DNS declined the Fas expression level of CD34+ bone marrow cells compared with the group model. As for the protein level, the expression levels of the key proteins of Fas signaling pathway in the group model were higher than those in the group control; however, after drug intervention for 14 days, compared with the group model, the DNS downregulated the expression levels of Fas, FasL, Caspase 3 and Caspase 8 proteins, which had the same trend to the result of flow cytometry. Therefore, our study confirmed that DNS has reversible effect on excessive apoptosis of hematopoietic cells in AA mice at molecular and protein level for treating AA.
Interferon gamma (IFN-γ) is a soluble dimeric cytokine and the only member of type II interferons. It is mainly secreted by natural killer (NK) and natural killer T cell (NKT) cells and plays a role in innate immunity; during antigen-specific immunity, it is secreted by CD4 Th1 and CD8 cytotoxic T cells. Alpha tumor necrosis factor (TNF-α) is a pro-inflammatory cytokine mainly produced by macrophages and monocytes and involved in normal inflammatory and immune responses. Interleukin 4 (IL-4) is produced by CD4+ T cells stimulated by antigens or mitogens, and in mice by Th2 subsets, and has an important immunoregulatory effect on hematopoietic cells.
The imbalance of Th1/Th2 ratio in T lymphocyte subsets in AA patients has become indisputable, and T lymphocytes produce excessive amounts of hematopoietic negative regulators, including IFN-γ and TNF-α, which not only prevent the cell cycle but also cause apoptosis of CD34+ cells through the Fas signaling pathway, exhibiting significant hematopoietic inhibitory activity.37 It was found that IL-4 is the most critical for Th2 cell differentiation, mainly in initiating Th2 differentiation, and the higher the concentration of IL-4, the stronger the inhibitory effect on IFN-γ production in Th1 cells inhibition.38 In the present study, we found that the expression levels of cytokines IFN-γ and TNF-α in the bone marrow cavity of AA mice were significantly higher than those of normal controls by establishing an AA mouse model. The expression level of IL-4 in the bone marrow cavity of AA mice was significantly lower compared with the normal control group and showed an increasing trend after the administration of DNS gavage.
Our study explored the potential mechanism of DNS for the treatment of AA and revealed that DNS exerts its mechanism to promote the restoration of bone marrow hematopoietic function by regulating the expression of key proteins of the Fas signaling pathway in the bone marrow lumen. However, the specific mechanism of how DNS regulates the differentiation of CD34+ cells to various lineages of blood cells in the bone marrow remains unclear and deserves further and more in-depth exploration.
Conclusion
DNS increases the number of peripheral blood cells in AA mice and promotes cell proliferation in the bone marrow cavity. This mechanism may be achieved by regulating the Fas signaling pathway key protein, more specifically, by reducing the Fas expression of the CD34+ bone marrow cells in AA mice and down-regulating the expression levels of pro-apoptotic Fas, FasL, Caspase3, Caspasse8 proteins to reduce bone marrow cell apoptosis and maintain bone marrow cell homeostasis.
Acknowledgments
The present study was supported by the National Natural Science Foundation of China (grant no 81973636 and 8177140375).
Disclosure
The authors report no conflicts of interest in this work.
References
1. Scheinberg P, Young NS. How I treat acquired aplastic anemia. Blood. 2012;120(6):1185–1196. doi:10.1182/blood-2011-12-274019
2. Young NS, Calado RT, Scheinberg P. Current concepts in the pathophysiology and treatment of aplastic anemia. Blood. 2006:108(8):2509.
3. Chen G. Current status of epidemiological research on aplastic anemia [J]. Chine J Hematol. 1999;107(4):52–53.
4. Kojima S. Why is the incidence of aplastic anemia higher in Asia? Expert Rev Hematol. 2017;10(4):277–279. doi:10.1080/17474086.2017.1302797
5. Young NS, Kaufman DW. The epidemiology of acquired aplastic anemia. Haematologica. 2008;93;498.
6. Bacigalupo A. Alternative donor transplants for severe aplastic anemia. Hematology Am Soc Hematol Educ Program. 2018;2018(1):467–473. doi:10.1182/asheducation-2018.1.467
7. Fu R, Liu C. Interpretation of “Expert consensus on the diagnosis and management of aplastic anemia in China (2017)”. J Clin Hematol. 2017;30(6):5.
8. Killick SB, Bown N, Cavenagh J. Guidelines for the diagnosis and management of adult aplastic anaemia. Br J Haematol. 2016;172(2):187. doi:10.1111/bjh.13853
9. Scheinberg P, Nunez O, Weinstein B, et al. Horse versus rabbit antithymocyte globulin in acquired aplastic anemia. N Eng J Med. 2011;365(19):1843–1844. doi:10.1056/NEJMoa1103975
10. Rogers ZR, Nakano TA, Olson TS, et al. Immunosuppressive therapy for pediatric aplastic anemia: a north American pediatric aplastic anemia consortium study. Haematologica. 2019;104(10):1974–1983. doi:10.3324/haematol.2018.206540
11. Sautour M, Mitaine-Offer A-C, Miyamoto T, et al. A new steroidal saponin from Dioscorea cayenensis. Chem Pharm Bull (Tokyo). 2004;52(11):1353. doi:10.1248/cpb.52.1353
12. Daisy P, Eliza J, Ignacimuthu S. Influence of Costus speciosus (Koen.) Sm. Rhizome Extracts on Biochemical Parameters in Streptozotocin Induced Diabetic Rats. J Health Sci. 2008;54(6):675–681. doi:10.1248/jhs.54.675
13. Raju J, Bird RP. Diosgenin, a naturally occurring furostanol saponin suppresses 3-hydroxy-3-methylglutaryl CoA reductase expression and induces apoptosis in HCT-116 human colon carcinoma cells. Cancer Lett. 2007;255(2):194–204. doi:10.1016/j.canlet.2007.04.011
14. Jeon JR, Lee JS, Lee CH, et al. Effect of ethanol extract of dried Chinese yam (Dioscorea batatas) flour containing Dioscorea nipponica saponins on gastrointestinal function in rat model. Arch Pharm Res. 2006;29(5):348–353. doi:10.1007/BF02968583
15. Son IS, Kim JH, Sohn HY, et al. Antioxidative and Hypolipidemic Effects of Diosgenin, a Steroidal Saponin of Yam (Dioscorea spp), on High-Cholesterol Fed Rats. Biosci Biotechnol Biochem. 2007;71(12):3063–3071. doi:10.1271/bbb.70472
16. Lee J, Jung K, Kim YS, et al. Diosgenin inhibits melanogenesis through the activation of phosphatidylinositol-3-kinase pathway (PI3K) signaling. Life Sci. 2007;81(3):249–254. doi:10.1016/j.lfs.2007.05.009
17. Kang W, Metelitsa AI, Dover DC, Salopek TG. Melasma: histopathological characteristics in 56 Korean patients. Br J Dermatol. 2010;163(1):146. doi:10.1111/j.1365-2133.2010.09809.x
18. Li J, Liu X, Guo M, Liu Y, Liu S, Yao S. Electrochemical Study of Breast Cancer Cells MCF-7 and Its Application in Evaluating the Effect of Diosgenin. Analytical Sci. 2005;21(5):561–564. doi:10.2116/analsci.21.561
19. Moalic S, Liagre B, Corbière C, et al. A plant steroid, diosgenin, induces apoptosis, cell cycle arrest and COX activity in osteosarcoma cells. FEBS Letters. 2001;506(3):225–230. doi:10.1016/S0014-5793(01)02924-6
20. Zhu H, Xu J-D, Mao Q, et al. Metabolic profiles of Dioscorea nipponica saponins in rats revealed by ultra‐performance liquid chromatography quadrupole time‐of‐flight mass spectrometry. Biomed Chromatography. 2015;29(9):1415–1421. doi:10.1002/bmc.3439
21. Kaskiw MJ, Tassotto ML, Mok M, et al. Structural analogues of diosgenyl saponins: synthesis and anticancer activity. Bioorg Med Chem. 2009;17(22):7670–7679. doi:10.1016/j.bmc.2009.09.046
22. Zhang S, Yin LX, Wang AD, et al. Effect of Diosgenin on Expressions of PPARγ, C/EBPα and Adipokine Secretion in Aplastic Anemia Mice. Chine J Exp Traditional Med Formulae. 2019;2(5):9.
23. Liu B, Zhang L, Zhang S, et al. Study on Dioscorea saponin regulating immune co-stimulatory molecule in aplastic anemia. China J Trad Chine Med Pharmacy. 2015;30(12):3.
24. Wang Y, Yan T, Ma L, et al. Effects of the Total Saponins from Dioscorea nipponica on Immunoregulation in Aplastic Anemia Mice. Am J Chine Med. 2015;43(2):289–303. doi:10.1142/S0192415X15500196
25. Song X, Zhang L, Zhang S, et al. Discorea nipponica saponins restore the Th17/Treg balance in aplastic anemia through the Notch/RBP-J/FOXP3/RORγt axis. J King Saud Univ Sci. 2020;32(2):1664–1672. doi:10.1016/j.jksus.2019.12.026
26. Philpott N, Scopes J, Marsh JC. Increased apoptosis in aplastic anemia bone marrow progenitor cells: possible pathophysiologic significance. Exp Hematol. 1995;23:1642.
27. Vibhuti NK, Nityanand S. Massive apoptosis of bone marrow cells in aplastic anaemia. Br J Haematol. 2015;117(4):993. doi:10.1046/j.1365-2141.2002.03537_1.x
28. Zeng W, Chen G, Kajigaya S. Gene expression profiling in CD34 cells to identify differences between aplastic anemia patients and healthy volunteers. Blood. 2004:103(1):325.
29. Nagata S, Golstein P. The fas death factor. Science. 1995;267(5203):1449–1456. doi:10.1126/science.7533326
30. Griffith TS, Brunner T, Fletcher SM, et al. Fas ligand-induced apoptosis as a mechanism of immune privilege. Science. 1995;270(5239):1189–1192. doi:10.1126/science.270.5239.1189
31. Qian W, Chen Y, Wang Q, et al. Mechanism of nuclear factor of activated T-cells mediated FasL expression in corticosterone -treated mouse Leydig tumor cells. BMC Cell Biol. 2008;9:1.
32. Athari SS, Zhang H, Su X. Targeting cell signaling in allergic asthma. Signal Transduct Target Ther. 2019;4(1):19. doi:10.1038/s41392-019-0051-z
33. Pearl-Yafe M, Stein J, Yolcu ES, et al. Fas transduces dual apoptotic and trophic signals in hematopoietic progenitors. Stem Cells. 2007;25(12):3194–3203. doi:10.1634/stemcells.2007-0402
34. Liu CY, Fu R, Wang HQ, et al. Fas/FasL in the immune pathogenesis of severe aplastic anemia. Genetics Mol Res. 2014;13(2):4083–4088. doi:10.4238/2014.May.30.3
35. Chang NC. Autophagy and stem cells: self-eating for self-renewal. Front Cell Dev Biol. 2020;8:138. doi:10.3389/fcell.2020.00138
36. Kroemer G. Erratum: the proto-oncogene Bcl-2 and its role in regulating apoptosis. Nat Med. 1997;3(6):614–620. doi:10.1038/nm0697-614
37. Chen CW, Lee J, Yoon SR, et al. Introduction to hematopoiesis and regulation [M]. People’s Health Press. 2008:21(13):4780.
38. Rizza P, Capone I, Urbani F, et al. Evaluation of the effects of human leukocyte IFN-alpha on the immune response to the HBV vaccine in healthy unvaccinated individuals. Vaccine. 2008;26(8):1038–1049. doi:10.1016/j.vaccine.2007.12.044
 © 2022 The Author(s). This work is published and licensed by Dove Medical Press Limited. The
full terms of this license are available at https://www.dovepress.com/terms
and incorporate the Creative Commons Attribution
- Non Commercial (unported, 3.0) License.
By accessing the work you hereby accept the Terms. Non-commercial uses of the work are permitted
without any further permission from Dove Medical Press Limited, provided the work is properly
attributed. For permission for commercial use of this work, please see paragraphs 4.2 and 5 of our Terms.
© 2022 The Author(s). This work is published and licensed by Dove Medical Press Limited. The
full terms of this license are available at https://www.dovepress.com/terms
and incorporate the Creative Commons Attribution
- Non Commercial (unported, 3.0) License.
By accessing the work you hereby accept the Terms. Non-commercial uses of the work are permitted
without any further permission from Dove Medical Press Limited, provided the work is properly
attributed. For permission for commercial use of this work, please see paragraphs 4.2 and 5 of our Terms.