Back to Journals » ImmunoTargets and Therapy » Volume 13
Diminished Diversities and Clonally Expanded Sequences of T-Cell Receptors in Patients with Chronic Spontaneous Urticaria
Authors He X, Wen X ![]() , He PM, Liang D, Yang L, Ran Y
, He PM, Liang D, Yang L, Ran Y ![]() , Zhang Z
, Zhang Z
Received 18 July 2024
Accepted for publication 15 November 2024
Published 5 December 2024 Volume 2024:13 Pages 661—671
DOI https://doi.org/10.2147/ITT.S481361
Checked for plagiarism Yes
Review by Single anonymous peer review
Peer reviewer comments 2
Editor who approved publication: Dr Flavio Salazar-Onfray
Xian He,1,2 Xueping Wen,3 Peng Ming He,3 Dan Liang,2 Lihong Yang,2 Yuping Ran,1 Zhixin Zhang3
1Department of Dermatovenereology, West China Hospital, Sichuan University, Chengdu, People’s Republic of China; 2Department of Allergy, Chengdu First People’s Hospital, Chengdu, People’s Republic of China; 3Chengdu ExAb Biotechnology, LTD, Chengdu, People’s Republic of China
Correspondence: Yuping Ran; Zhixin Zhang, Email [email protected]; [email protected]
Objective: Studies establish a link between autoimmune factors and chronic spontaneous urticaria (CSU). T cells are crucial in immune-mediated diseases like CSU, and T-cell receptor (TCR) diversity could be pivotal in autoimmune responses. The clinical relevance of TCR variations in CSU is unknown, but understanding them may offer insights into CSU’s pathogenesis and treatment.
Methods: This cross-sectional study included 132 chronic urticaria (CU) patients versus 100 age-matched healthy donors (HD), with subgroup analyses on CU type, angioedema, allergic comorbidities, and anti-IgE therapy efficacy. Peripheral TCRβ repertoires were analyzed by high-throughput sequencing.
Results: CSU patients showed reduced TCR diversity (lower D50) and increased large clone proportions than HD. Moreover, TCR diversity in CSU patients was significantly lower than in those with Chronic Inducible Urticaria (ClndU). There were also differences in variable (V) and joining (J) gene usage between CU and HD groups as well as CSU and ClndU groups. However, in subgroup analyses regarding angioedema, allergic comorbidities, and the efficacy of anti-IgE treatment, no significant differences were found in TCR diversity or large TCRβ clones. Notably, patients with treatment relapse or poor response to anti-IgE therapy had a higher proportion of positively charged CDR3. Additionally, age affected TCR diversity, but TIgE value, EOS counts, CU duration, and UAS7 score did not associate significantly with D50.
Conclusion: CSU patients exhibit reduced TCR diversity and increased large clone proportions, indicating abnormal T cell activation. The TCR diversity differences and distinct V and J gene usage between CSU and ClndU may indicate different mechanisms in T lymphocyte-associated immune responses for these two subtypes of CU. The higher positive charge in CDR3 of relapsed or poorly responsive patients to anti-IGE treatment may indicate more antigen charge involvement. These findings provide new insights into the pathogenesis of CSU and potential future treatments.
Keywords: T-cell receptor, T-cell receptor repertoire, T-cell receptor diversity, chronic spontaneous urticaria, high-throughput sequencing
Introduction
Urticaria, a prevalent dermatological condition, has exhibited a steady rise in incidence globally. The worldwide count of urticaria cases surged to 86 million in 2017, with chronic urticaria (CU) manifesting a lifetime prevalence of 4.4%.1 Chronic spontaneous urticaria (CSU) was ~60–90% across all cases of CU.1 Despite this prevalence, the underlying pathophysiology of CSU remains inadequately understood. It has been postulated that various hypersensitivity mechanisms could be involved in its pathogenesis, encompassing type I (IgE-mediated, causing CU symptoms), type II (IgG involvement, leading to chronic autoimmune urticaria), and type IV (T lymphocyte-mediated).2 The most recognized mechanisms involved in this pathology are those mediated by IgE and IgG.2 Notably, T lymphocytes, pivotal in the pathogenesis of immune-mediated disorders, have been implicated in CSU development.3–5 The pivotal link in CSU pathogenesis involves the activation of mast cells, T cells, eosinophils, and other immune cells congregating around affected venules.3 The intricate interplay between innate and adaptive immunity, encompassing various T-cell subsets and immune elements, orchestrates a complex network of interactions in CSU, mediated through soluble inflammatory factors, microvesicles, and cell-to-cell contacts.3 T lymphocytes, integral to the adaptive immune system, contribute significantly to this critical link in CSU pathogenesis.
Under normal circumstances, individual T lymphocytes express a multitude of a single species of receptors on their cell surfaces, yielding a uniform Gaussian distribution in the body’s immune group library.6 However, an aberrant immune response can incite certain T lymphocytes to undergo clonal expansion, leading to a skewed distribution in the immune group library and a subsequent reduction in diversity. This deviation in the T-cell receptor (TCR) repertoire prompts amplification at both the gene and amino acid levels.7 Consequently, through immune repertoire sequencing, comprehensive diversity information regarding the TCR repertoire during a specific period can be garnered. When combined with advanced machine algorithms, this approach holds promise for the specific identification of antigenic disease characteristics in CSU.
While immune repertoire sequencing is prominently active in oncology and has garnered attention in infectious and autoimmune diseases,8–16 the characteristics and clinical significance of TCR variations in CSU remain unclear. In this study, peripheral blood samples from 132 CU patients and 100 healthy donors (HD) underwent TCR repertoire amplification, followed by high-throughput sequencing. This endeavor aimed to preliminarily analyze distinct TCR clones associated with CSU, thus laying the groundwork for future immune-related investigations.
Materials and Methods
Participants and Sample Collection
This study obtained approval from the Biomedical Ethics Review Committee of West China Hospital, Sichuan University (Ethics Approval for Research: 2021 #1491), with all participants providing written informed consent. This study complies with the Declaration of Helsinki. Patients diagnosed with CU were recruited from the Department of Allergy at Chengdu First People’s Hospital. Healthy individuals were sourced from the Sichuan Provincial People’s Hospital. All the participants without a history of cancer, autoimmune diseases, cardiovascular diseases, or known infectious diseases, and no glucocorticoid or immunosuppressive therapy was taken within 3 months. None of the participants experienced triggers such as infections or recent immunizations. Comprehensive clinical data were meticulously collected for all CU patients, encompassing demographics like gender and age, course of disease, CU classification, the presence of angioedema, allergic comorbidities, responses to anti-IgE therapy, peripheral blood total IgE (TIgE) levels, peripheral blood eosinophil (EOS) counts, and the 7-day urticaria activity score (UAS7) for patients with CSU. In addition to comparing the 132 CU patients with the 100 healthy donors, we conducted analyses on four subgroups: the CSU group versus the chronic inducible urticaria (ClndU) group (40 individuals in each group); CSU patients with and without associated angioedema (18 individuals in each group); CSU patients with and without allergic comorbidities (21 individuals in each group); and CSU patients who experienced no relapse after anti-IgE treatment (no recurrence for over a year after treatment cessation) versus those who had relapses or poor treatment outcomes (19 individuals in each group). To avoid the influence of age differences, age-matched populations were selected for comparison in each group. The diagnostic criteria for various urticaria types adhere to the 2021 EAACI Guidelines. The procedures adhered strictly to pertinent guidelines and regulations. Each participant contributed approximately 2 mL of peripheral blood, collected via venipuncture using lavender top tubes containing ethylene diamine tetra acetic acid (EDTA) as an anticoagulant.
Lymphocyte Isolation and RNA Purification
Peripheral blood mononuclear cells (PBMCs) underwent lymphocyte isolation utilizing density gradient centrifugation technology, following the manufacturer’s guidelines for Human Lymphocyte Separation Medium (Tian Jin Hao Yang Biological Manufacture Co., Ltd, CAT# LTS1077). RNA extraction from PBMCs was executed using TRIzol (Ambion, CAT# 15596026) and subsequently preserved at −80°C until further processing.
Reverse Transcription-Polymerase Chain Reaction Amplification of TCRβ Gene
The first round of PCR amplification of the TCRβ gene utilized the QIAGEN one-step RT-PCR kit (QIAGEN, CAT# 210212), employing RNA from PBMCs as the template. RT-PCR conditions involved reverse transcription at 50°C for 30 minutes, followed by a 15-minute pre-incubation at 95°C, succeeded by 20 cycles of 30-second intervals at 95°C, 58°C, and 72°C, respectively.
PCR Amplification of TCRβ Gene
Subsequent to the first round of RT-PCR, the TCRβ gene underwent amplification in a second PCR round. This process included the addition of hTCRCbBCX primer and Vbmix primers at specific concentrations, along with necessary reagents, in a defined volume. The PCR activation involved a 10-minute incubation at 95°C followed by 20 cycles of 30-second intervals at 95°C, 58°C, and 72°C. Subsequently, PCR products underwent purification using a DNA fragment purification kit (BioMagbeads, Wuxi, China, CAT# BMSX).
Sequencing of the TCRβ Gene
Library preparation for sequencing was carried out using the Thermal-Fisher Ion Plus Fragment Library Kit (CAT# 4471252), Ion Xpress Barcode Adaptors 1–16Kit (CAT# 4471250), and Agencourt AMPure XP (CAT# A63881), following the manufacturer’s protocol. Automated template preparation and chip loading were executed on a Thermal-Fisher Ion Chef system employing Ion 520/530 ExT-Chef-4rxns and 4 Init NEW-For 600bp (CAT# A30670). TCRβ variable region sequencing was conducted on a Thermal-Fisher Ion S5 system using Ion 530 Chip Kit (CAT# A27764).
Data Analysis
Sequencing results were imported into FASTA files and subjected to analysis using a local IgBLAST program. This analysis assigned germline Vβ, Jβgenes, complementary determination region 3 (CDR3), and CDR3 amino acid sequences for each TCRβ sequence. Comparative analysis involved the random selection of 30,000 functional TCRβ sequences from each sample.
TCRβ Diversity Index
The Diversity 50 (D50) value, representing the dominant TCRβ CDR3 clone type accounting for 50% of the total TCRβ sequence accumulation, served as a measure of TCRβ diversity.
Statistical Analysis
All statistical analyses utilized ORIGIN Prov2021 software (OriginLab Corporation). Independent variables were compared for statistical significance using a Non-parametric Mann–Whitney U-test, while dependent variables underwent comparison using a paired sample Wilcoxon signed rank test.
Results
Variations in the Use of Variable Genes (V) and Connecting Genes (J)
Among the 132 CU patients, compared to the control group of 100 age-matched healthy individuals, analysis of the expressed TCRβ repertoires revealed notable differences. The usage of TRBV5-1, TRBV6-6, TRBV7-2, TRBV11-2, TRBV12-4, TRBV13, TRBV18, TRBV29-1, and TRBV30 in CU patients was significantly higher than in the HD group (Figure 1A, p<0.05, Mann–Whitney U-test) for functional Vβ genes. Similarly, for functional Jβ genes, the use of TRBJ2-5 was significantly higher in CU patients compared to HD (Figure 1B, p<0.05, Mann–Whitney U-test). The result suggests that individuals with CU exhibit distinct patterns of V and J gene usage compared to the general population. The differences in V and J gene usage may reflect alterations in the immunological environment associated with certain T lymphocytes in patients with CU.
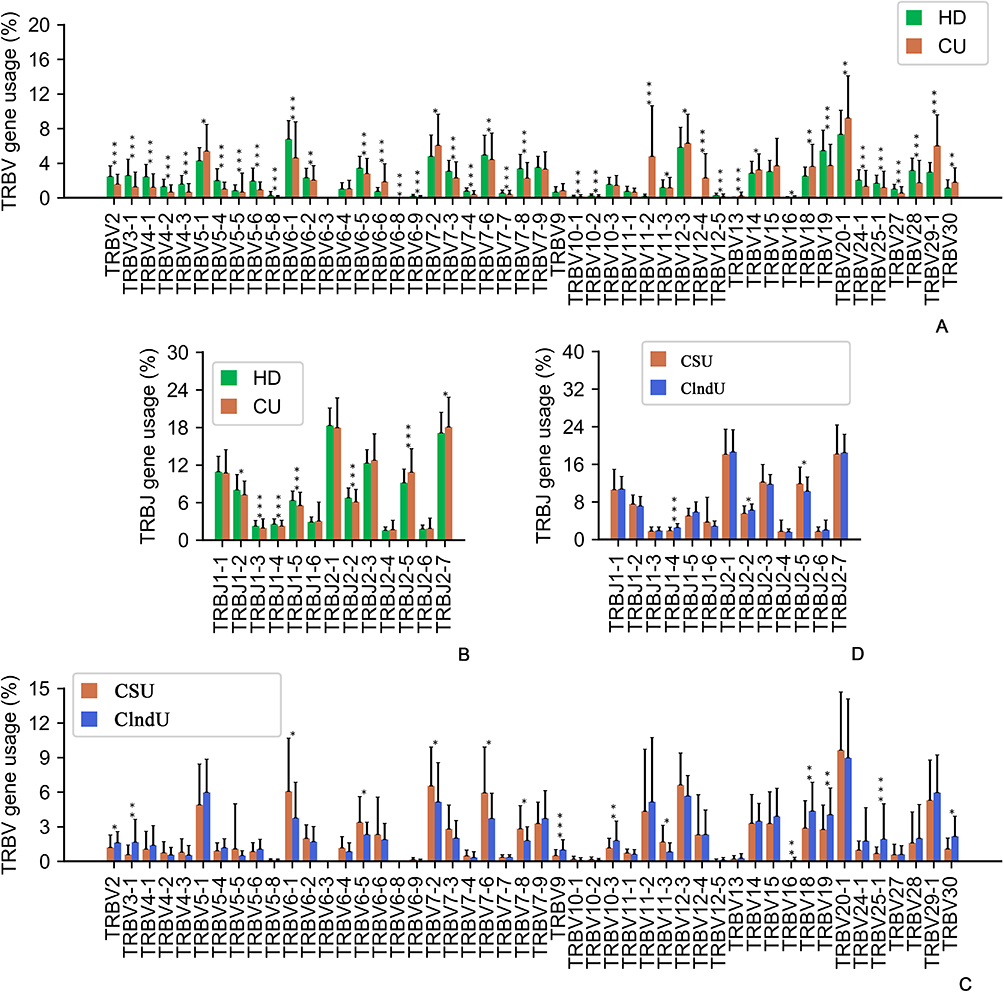 |
Figure 1 Variations in the use of variable genes (V) and connecting genes (J). (A) Comparison of all functional human TRBV gene usage frequencies in the healthy donors (HD) and the patients with chronic urticaria (CU). (B) Comparison of all functional human TRBJ gene usage frequencies in the HD and the patients with CU. (C) Comparison of all functional human TRBV gene usage frequencies in the patients with CSU and the patients with Chronic induced urticaria (ClndU). (D) Comparison of all functional human TRBJ gene usage frequencies in the patients with CSU and the patients with ClndU. The error bars indicate standard deviations while the asterisks indicate p-values of the Mann–Whitney U-test (* p<0.05; ** p<0.01; *** p<0.001). |
Additionally, we compared 40 patients with CSU to 40 age-matched patients with ClndU and discovered significant differences in the expression profiles of TCRβ repertoires. The usage of TRBV6-1, TRBV6-5, TRBV7-2, TRBV7-6, TRBV7-8, and TRBV11-3 in CSU patients was significantly higher than in the ClndU patients (Figure 1C, p<0.05, Mann–Whitney U-test) for functional Vβ genes. In parallel, for functional Jβ genes, the prevalence of TRBJ2-5 was notably elevated in CSU patients when compared to ClndU patients (Figure 1D, p<0.05, Mann–Whitney U-test). Conversely, the usage of TRBV2, TRBV3-1, TRBV9, TRBV10-3, TRBV16, TRBV18, TRBV19, TRBV25-1, and TRBV30 was significantly more pronounced in ClndU patients than in CSU patients (Figure 1C, p<0.05, Mann–Whitney U-test) for functional Vβ genes. Similarly, for functional Jβ genes, the utilization of TRBJ1-4 and TRBJ2-2 was significantly greater in ClndU patients compared to their CSU counterparts (Figure 1D, p<0.05, Mann–Whitney U-test). The comparison between CSU and ClndU patients revealed distinct patterns of TCRβ repertoire expression, which could reflect the distinct mechanisms in T lymphocyte-associated immune responses between these two CU subtypes.
Distinct Length Distributions of CDR3
CDR3 length distributions were notably different between CU and HD groups (Figure 2A, p<0.001, Mann–Whitney U-test). Patients with CU exhibited a higher presence of TCRβs with CDR3 lengths of 9 to 11 amino acid residues (Figure 2A), while the HD group showed a higher prevalence of TCRβs with CDR3 lengths of 13 to 16 (Figure 2A). However, both groups displayed a similar pattern with a primary peak at CDR3 length of 12 to 13 amino acid residues (Figure 2A). The variation in CDR3 length distribution may be correlated with the immune response of certain T lymphocytes in CU.
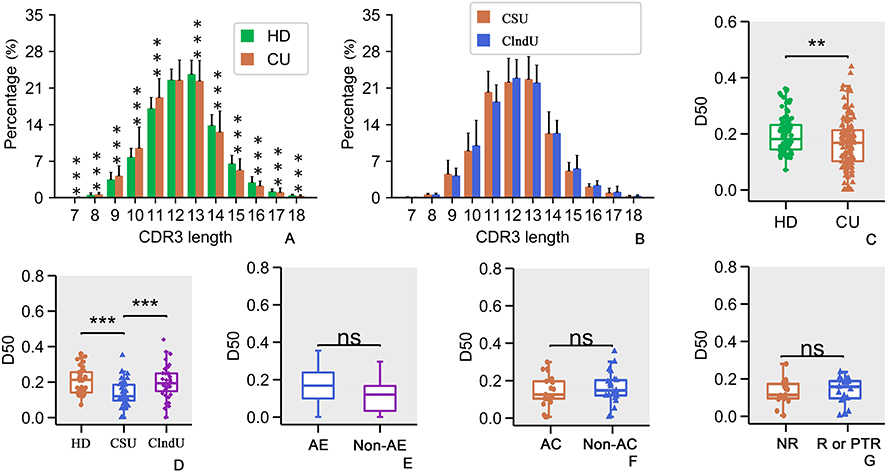 |
Figure 2 Analysis of CDR3 length distribution and diversity. (A) CDR3 length distributions were notably different between CU and HD groups. (B) The difference in CDR3 length distribution between CSU and ClndU is not statistically significant. (C) Comparison of diversity 50 (D50) values in the HD and CU patients. (D) Comparison of D50 values among the HD group, CSU group, and ClndU group. (E) Comparison of D50 values in CSU patients with and without angioedema (referred to as AE and Non-AE). (F) Comparison of D50 values in CSU patients with and without allergic comorbidities (referred to as AC). (G) Comparison of D50 values in CSU patients who do not relapse (referred to as NR) following anti-IgE treatment versus those who either relapse (referred to as R) or have a poor response to the treatment (referred to as PTR). The same abbreviations apply to the following figures. The error bars indicate standard deviations while the asterisks indicate p-values of the Mann–Whitney U-test (** p<0.01; *** p<0.001). |
In comparing CSU and ClndU, no significant statistical differences were observed in the CDR3 length distributions (Figure 2B, p > 0.05, Mann–Whitney U-test). This suggests that the distribution of CDR3 lengths is relatively stable between these two subtypes of CU.
Diversity Distributions of CDR3
Analysis using the Diversity Index (D50) as a measure of TCR diversity and clonability highlighted significantly higher D50 values in the TCRβ repertoires of 100 HD compared to 132 CU patients (Figure 2C, p<0.005, Mann–Whitney U-test). The findings suggest that in patients with CU, the clonal expansion of certain T lymphocytes contributes to a reduced diversity of TCR repertoires.
To more effectively observe the variation in TCR diversity among different types of CU, we compared the D50 values of patients with CSU (40 individuals) and ClndU (40 individuals) to those of HD (40 individuals). The age of all three groups is well-matched. The results reveal that the D50 values of patients with CSU are significantly lower compared to the HD group (Figure 2D, p<0.001, Mann–Whitney U-test), with a more pronounced difference than observed between the CU group and the HD group (Figure 2C, p<0.005, Mann–Whitney U-test). However, when comparing the D50 values between the ClndU group and the HD group, no significant differences were observed (Figure 2D, p>0.05, Mann–Whitney U-test). It is noteworthy that the D50 values in the CSU group were significantly lower than those in the ClndU group (Figure 2D, p<0.001, Mann–Whitney U-test). The findings above may suggest that patients with CSU exhibit a more pronounced clonal expansion of specific T lymphocytes compared to those with ClndU.
However, when comparing the three groups in terms of the presence of angioedema, allergic comorbidities, and the efficacy of anti-IgE therapy, no significant differences were observed in the D50 values (Figure 2E–G, p>0.05, Mann–Whitney U-test). This may suggests that the differences in the aforementioned specific conditions are not associated with a large-scale clonal expansion of T lymphocytes.
Correlations Between TCRβ Characteristics and Clinical Variables
A negative correlation between D50 and age was evident in CU patients (132 individuals) (Figure 3A, r=−0.34, p<0.0001). There was no significant correlation between D50 and CU duration (125 individuals), UAS7 score (64 individuals), peripheral blood TIgE value (122 individuals) and peripheral blood EOS counts (40 individuals) (Figure 3B–E, r=0.11, p>0.05, r=0.00, p>0.05, r=0.19, p<0.05, and r=0.07, p>0.05 respectively). The findings suggest that the duration of CU, disease activity, peripheral blood TIgE levels, and eosinophil counts in CU appear to have a minimal impact on D50 values.
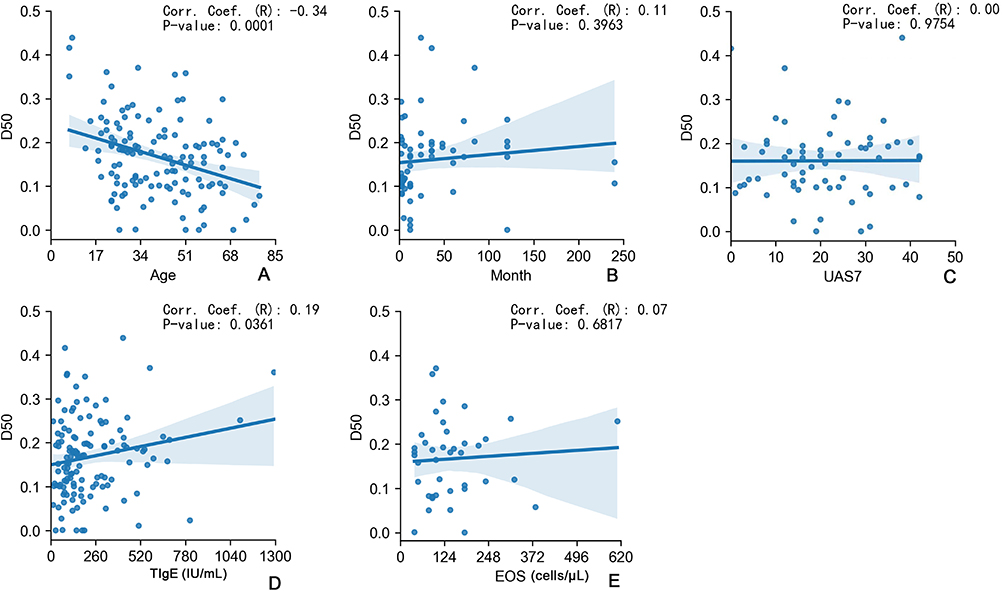 |
Figure 3 Correlations between TCRβ characteristics and clinical variables. (A) Correlation analysis between age and D50 value of CU patients. (B) Correlation analysis between D50 value and the course of chronic urticaria in CU patients. (C) Correlation analysis between USA7 score and D50 value in CSU patients. (D) Correlation analysis of D50 value and TIgE value in CU patients. (E) Correlation analysis of D50 value and EOS counts in CU patients. The R value stands for correlation coefficient. |
The Largest TCRβ Clone Percentages
We analyzed TCRβ clones in each individual and considered unique TCRβ CDR3 clone types account for >10% of total sequences in an individual repertoire as largest TCRβ clones. The analysis of TCRβ clones revealed a higher number of largest TCRβ clones in the CU group compared to the HD group (Figure 4A, p<0.05, Mann–Whitney U-test), Consistent with the findings depicted in Figure 2C. The types of >1% TCRβ clones in these 2 groups were similar (Figure 4B, p>0.05, Mann–Whitney U-test). This observation once again suggests the presence of clonal expansion among certain T-lymphocytes within the CU patient population.
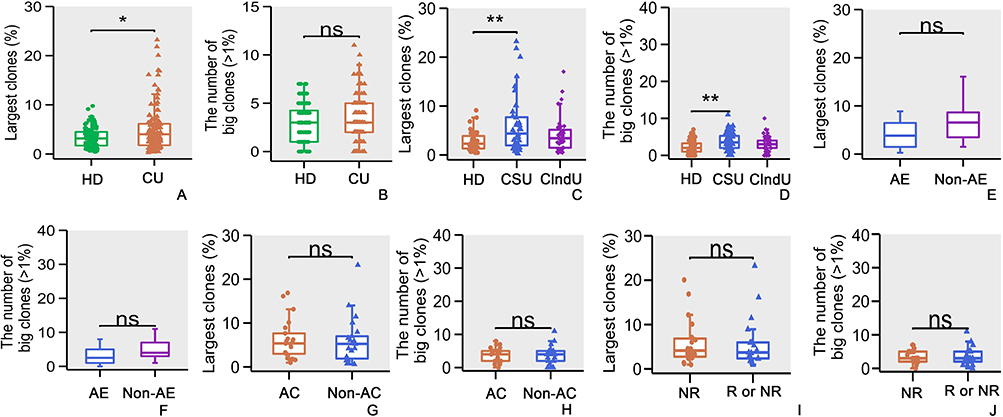 |
Figure 4 The largest TCRβ clone percentages. (A) Comparison of the large clones of TCRβ CDR3 clone in HD and CU patients. (B) Comparison of the types of >1% TCRβ clones in HD and CU patients. (C) Comparison of large clones of TCRβ CDR3 clone among the HD group, CSU group, and ClndU group. (D) Comparison of the types of >1% TCRβ clones among the HD group, CSU group, and ClndU group. (E) Comparison of the large clones of TCRβ CDR3 clone in CSU patients with angioedema and the patients without angioedema. (F) Comparison of the types of >1% TCRβ clones in CSU patients with angioedema and the patients without angioedema. (G) Comparison of the large clones of TCRβ CDR3 clone in CSU patients with allergic comorbidities and the patients without allergic comorbidities. (H) Comparison of the types of >1% TCRβ clones in CSU patients with allergic comorbidities and the patients without allergic comorbidities. (I) Comparison of the large clones of TCRβ CDR3 clone in CSU patients who did not relapse following anti-IgE treatment versus those who either relapsed or had a PTR. (J) Comparison of the types of >1% TCRβ clones in CSU patients who did not relapse following anti-IgE treatment versus those who either relapsed or had a PTR. The error bars indicate standard deviations while the asterisks indicate p-values of the Mann–Whitney U-test (* p<0.05; ** p<0.01). |
In the categorical analysis, it was observed that the largest TCRβ clones in the CSU group was significantly higher than that in the HD group (Figure 4C, p<0.005, Mann–Whitney U-test), with a more pronounced difference than observed between the CU group and the HD group (Figure 4A, p<0.05, Mann–Whitney U-test). However, the differences between the ClndU group and the HD group, as well as between the CSU and ClndU groups, were not statistically significant (Figure 4C, p>0.05, Mann–Whitney U-test). In the comparison of the types of >1% TCRβ clones, the CSU group exhibited a significantly higher rate compared to the HD group (Figure 4D, p<0.005, Mann–Whitney U-test). However, no significant differences were observed between the ClndU group and the HD group, nor between the CSU group and the ClndU group (Figure 4D, p>0.05, Mann–Whitney U-test). This outcome aligns with the data presented in Figure 2D, reinforcing the observation that CSU patients demonstrate a more pronounced clonal expansion of certain T-lymphocyte subsets in comparison to ClndU patients.
In the analysis related to large TCRβ clones and the types of >1% TCRβ clones, no significant differences were found in the presence of angioedema, the occurrence of allergic comorbidities, or the efficacy of anti-IgE treatment (Figure 4E–J, p>0.05, Mann–Whitney U-test).
Amino Acid Charge Analysis
Upon comparative analysis of the charge properties of CDR3 regions, it was observed that in CSU patients who relapsed or had a poor response to anti-IgE therapy, a significantly higher proportion of CDR3 regions carried a positive charge compared to those without relapse (Figure 5A, p<0.005, Mann–Whitney U-test). However, no significant differences were observed in the negatively charged CDR3 regions between the two groups (Figure 5B, p>0.05, Mann–Whitney U-test). This suggests that a more complex immune response involving a greater number of negatively charged antigens may be at play in this subgroup.
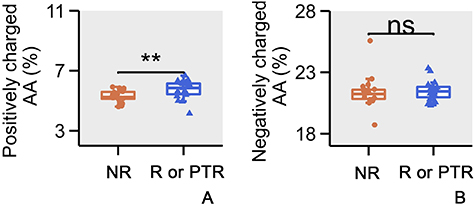 |
Figure 5 Amino acid charge analysis. (A) Comparison of the positively charged Amino Acids (AA) of CDR3 in CSU patients who did not relapse following anti-IgE treatment versus those who relapsed or had a PTR. (B) Comparison of the negatively charged AA of CDR3 in CSU patients who did not relapse following anti-IgE treatment versus those who relapsed or had a PTR. The error bars indicate standard deviations while the asterisks indicate p-values of the Mann–Whitney U-test (** p<0.01). |
Discussion
Studies on immune repertoires offer crucial insights into immune system development and functionality,17,18 with TCR library diversity being associated with the pathogenesis and prognosis of diverse diseases.19,20 Previous reports have demonstrated the application of immune repertoire sequencing in autoimmune diseases. For instance, Liu et al identified down-regulation of CDR3 diversity in peripheral blood of systemic lupus erythematosus and rheumatoid arthritis patients, showcasing significant differences in V-J pairing analysis for disease classification.15 The intricate pathogenesis of CSU, largely attributed to autoimmune factors, involves mast cell degranulation and inflammatory mediator release as central elements.21–23 However, T lymphocytes, vital in immune-mediated disease pathogenesis, have also demonstrated involvement in CSU.3–5,24 Reports have documented that microvesicles derived from T cells can activate mast cells.25,26 Beyond physical contact and microvesicles from T cells, mast cells and T cells may also interact with each other through inflammatory mediators and related receptors,27–32 implying activated T cells’ role in mast cell pathogenic activation.
Immune repertoire sequencing, divergent from traditional low-throughput tools, captures a comprehensive snapshot of the immune lineage.33 In this study, we compared the TCRβ repertoires of 132 patients diagnosed with CU and 100 healthy donors (HD). Our comprehensive analysis involved a total of 3,521,942 functional TCRβ gene sequences and 787,584 unique TCRβ CDR3 sequences. The sequencing of peripheral blood samples from CU patients and HD revealed that the CU group exhibited a significantly reduced diversity and a higher prevalence of large CDR3 clones compared to the HD group. In subgroup analysis, the TCR diversity in the CSU group was markedly lower than that in both the HD and ClndU groups. However, there was no significant difference in diversity between the ClndU and HD groups. In the analysis of large clones, the differences between the CSU and HD groups also exhibit a more pronounced disparity compared to the differences between the CU and HD groups. These findings suggest a significant activation and proliferation of T lymphocytes among CSU patients. Furthermore, this underscores a more pronounced clonal expansion of T lymphocytes in CSU patients relative to ClndU patients. Additionally, notable variations in V and J gene usage were observed between healthy individuals and CU patients, particularly increased frequency of certain Vβ genes (eg, TRBV11-2, TRBV12-4, TRBV29-1) in CU patients. V and J genes, which are part of the T-cell receptor (TCR) genes, play a crucial role in the immune system’s response to various antigens. In chronic urticaria, an exaggerated immune response can lead to persistent hives and itching. The differences in V and J gene usage may reflect an altered immune landscape in these patients, potentially contributing to the disease’s chronicity and severity. Furthermore, our analysis of V and J gene usage differences between CSU patients and ClndU patients revealed significant disparities. This suggests that CSU and ClndU may involve distinct mechanisms in T lymphocyte-associated immune responses.
In the subgroup analysis concerning angioedema, allergic comorbidities, and the therapeutic effects of anti-IgE treatment, no significant differences were found in TCR diversity or large TCRβ clones. This suggests that the aforementioned conditions may not greatly affect TCR diversity and are unlikely to cause massive clonal proliferation of T lymphocytes. Notably, in the analysis of treatment outcomes related to anti-IgE therapy, we observed that CSU patients who experienced relapse or suboptimal responses within one year post-treatment had a significantly higher proportion of positively charged CDR3 regions compared to those with no relapse. This suggests that CSU patients with poor responses to anti-IgE therapy may involve a greater participation of negatively charged antigens. This finding indicating that in CSU patients with suboptimal responses to anti-IgE therapy, there may be more complex T lymphocyte-associated immune responses, influenced by higher antigenic loads.
Increasing studies have found that the diversity of TCR repertoire generally declines with increasing age.34–36 Similarly, our study detected a downward trend in CDR3 diversity with increasing age in CU patients. To mitigate any potential impact of age distribution variance on the data, we have well-matched the sample ages across various groups. This helps in excluding the confounding effect of age disparity on the results. It is worth noting that we found TIgE value, EOS counts, CU duration, and UAS7 score were not significantly associated with D50 value. The findings suggest that the duration of CU, disease activity, peripheral blood TIgE levels, and eosinophil counts in CU appear to have a minimal impact on D50 values.
In our preliminary analysis of autoimmune-related factors in patients with CSU, we compared the differences in D50, the percentage of the largest TCRβ clones between TPOAb-positive (7 cases) and TPOAb-negative (7 cases) patients, as well as between TGAb-positive (6 cases) and TGAb-negative (6 cases) patients. However, no significant differences were observed (p>0.05, Mann–Whitney U-test). Due to the limited sample size in the above comparisons, the stability of the results may be insufficient, and further analysis with a larger sample size is still required.
Despite these insights, limitations exist. As a cross-sectional study, this study cannot confirm causation and the hypothesized antigens are unknown, nor could changes in specific T lymphocyte cell subsets be determined. Therefore, comprehensive, prospective studies are imperative for more definitive outcomes.
In summary, we found patients with CSU demonstrate a reduction in TCR diversity alongside an increase in the proportion of large clones, which suggests abnormal T cell activation. The TCR diversity differences and distinct V and J gene usage between CSU and ClndU may indicate different mechanisms in T lymphocyte-associated immune responses for these two subtypes of CU. In patients who relapse or show poor responsiveness to anti-IgE therapy, a higher positive charge in the CDR3 may indicate a more significant involvement of antigen charge. Subgroup analyses on angioedema, allergic comorbidities, and anti-IgE treatment effects showed no significant differences in TCR diversity or large TCRβ clones. Additionally, TIgE value, EOS counts, CU duration, and UAS7 score were not significantly associated with D50 value, indicating that the impact of these factors on TCR diversity is minimal. Collectively, these findings offer novel perspectives on the pathogenesis of CSU and may pave the way for the development of future therapeutic strategies.
Data Sharing Statement
All data generated or analysed during this study are included in this article. Further enquiries can be directed to the corresponding author.
Author Contributions
All authors made a significant contribution to the work reported, whether that is in the conception, study design, execution, acquisition of data, analysis and interpretation, or in all these areas; took part in drafting, revising or critically reviewing the article; gave final approval of the version to be published; have agreed on the journal to which the article has been submitted; and agree to be accountable for all aspects of the work.
Funding
This work was supported in part by the Sichuan Science and Technology Program (Grant 2020YFS0194), the National Natural Science Foundation of China (Grant 81472539), 1.3.5 project for disciplines of excellence, West China Hospital, Sichuan University, and HX-Academician project (HXYS19003), West China Hospital, Sichuan University.
Disclosure
Dr. Zhixin Zhang is the founder of ExAb Biotechnology, Inc. There are no financial or other contractual agreements that might cause conflicts of interest.
References
1. Kolkhir P, Giménez-Arnau AM, Kulthanan K, et al. Urticaria. Nat Rev Dis Primers. 2022;8(1):61. doi:10.1038/s41572-022-00389-z
2. Hennino A, Bérard F, Guillot I, Saad N, Rozières A, Nicolas JF. Pathophysiology of urticaria. Clin Rev Allergy Immunol. 2006;30(1):3–11. doi:10.1385/CRIAI:30:1:003
3. Zhou B, Li J, Liu R, et al. The role of crosstalk of immune cells in pathogenesis of chronic spontaneous urticaria. Front Immunol. 2022;13:879754. doi:10.3389/fimmu.2022.879754
4. Ying S, Kikuchi Y, Meng Q, et al. TH1/TH2 cytokines and inflammatory cells in skin biopsy specimens from patients with chronic idiopathic urticaria: comparison with the allergen-induced late-phase cutaneous reaction. J Allergy Clin Immunol. 2002;109(4):694–700. doi:10.1067/mai.2002.123236
5. Zweiman B, Haralabatos IC, Pham NC, et al. Sequential patterns of inflammatory events during developing and expressed skin late-phase reactions. J Allergy Clin Immunol. 2000;105(4):776–781. doi:10.1067/mai.2000.105223
6. Hou X, Wang M, Lu C, et al. Analysis of the repertoire features of TCR beta chain CDR3 in human by high-throughput sequencing. Cell Physiol Biochem. 2016;39(2):651–667. doi:10.1159/000445656
7. Ma J, Sun G, Zhu P, et al. Determination of the complexity and diversity of the TCR β-chain CDR3 repertoire in bladder cancer using high-throughput sequencing. Oncol Lett. 2019;17(4):3808–3816. doi:10.3892/ol.2019.10015
8. Robert L, Tsoi J, Wang X, et al. CTLA4 blockade broadens the peripheral T-cell receptor repertoire. Clin Cancer Res. 2014;20(9):2424–2432. doi:10.1158/1078-0432.CCR-13-2648
9. Luo W, Liao WJ, Huang YT, et al. Normalization of T cell receptor repertoire diversity in patients with advanced colorectal cancer who responded to chemotherapy. Cancer Sci. 2011;102(4):706–712. doi:10.1111/j.1349-7006.2011.01868.x
10. Wang Y, Liu Y, Chen L, et al. T cell receptor Beta-chain profiling of tumor tissue, peripheral blood and regional lymph nodes from patients with papillary thyroid carcinoma. Front Immunol. 2021;12:595355. doi:10.3389/fimmu.2021.595355
11. Cui JH, Lin KR, Yuan SH, et al. TCR repertoire as a novel indicator for immune monitoring and prognosis assessment of patients with cervical cancer. Front Immunol. 2018;9:2729. doi:10.3389/fimmu.2018.02729
12. Reuben A, Zhang J, Chiou SH, et al. Comprehensive T cell repertoire characterization of non-small cell lung cancer. Nat Commun. 2020;11(1):603. doi:10.1038/s41467-019-14273-0
13. Hu Z, Anandappa AJ, Sun J, et al. A cloning and expression system to probe T-cell receptor specificity and assess functional avidity to neoantigens. Blood. 2018;132(18):1911–1921.
14. Hou X, Wang G, Fan W, et al. T-cell receptor repertoires as potential diagnostic markers for patients with COVID-19. Int J Infect Dis. 2021;113:308–317. doi:10.1016/j.ijid.2021.10.033
15. Liu X, Zhang W, Zhao M, et al. T cell receptor β repertoires as novel diagnostic markers for systemic lupus erythematosus and rheumatoid arthritis. Ann Rheum Dis. 2019;78(8):1070–1078. doi:10.1136/annrheumdis-2019-215442
16. Bashford-Rogers RJM, Bergamaschi L, McKinney EF, et al. Analysis of the B cell receptor repertoire in six immune-mediated diseases. Nature. 2019;574(7776):122–126. doi:10.1038/s41586-019-1595-3
17. Boyd SD, Crowe JJE. Deep sequencing and human antibody repertoire analysis. Curr Opin Immunol. 2016;40:103–109. doi:10.1016/j.coi.2016.03.008
18. Bradley P, Thomas PG. Using T cell receptor repertoires to understand the principles of adaptive immune recognition. Annu Rev Immunol. 2019;37(1):547–570. doi:10.1146/annurev-immunol-042718-041757
19. Jia Q, Zhou J, Chen G, et al. Diversity index of mucosal resident T lymphocyte repertoire predicts clinical prognosis in gastric cancer. Oncoimmunology. 2015;4(4):e1001230. doi:10.1080/2162402X.2014.1001230
20. Speranza E, Ruibal P, Port JR, et al. T-cell receptor diversity and the control of T-cell homeostasis mark Ebola virus disease survival in humans. J Infect Dis. 2018;218(suppl_5):S508–S518. doi:10.1093/infdis/jiy352
21. Biju S, Talegaonkar S, Mishra P, et al. Vesicular systems: an overview. Indian J Pharm Sci. 2006;68(2):1.
22. Kaplan AP. Chronic urticaria and angioedema. N Engl J Med. 2002;346(3):175–179. doi:10.1056/NEJMcp011186
23. Saini SS. Basophil responsiveness in chronic urticaria. Curr Allergy Asthma Rep. 2009;9(4):286–290. doi:10.1007/s11882-009-0040-3
24. Auyeung P, Mittag D, Hodgkin PD, et al. Autoreactive T cells in chronic spontaneous urticaria target the IgE Fc receptor Iα subunit. Journal of Allergy and Clinical Immunology. 2016;138(3):761–768.e4. doi:10.1016/j.jaci.2016.04.036
25. Shefler I, Salamon P, Levi-Schaffer F, et al. MicroRNA-4443 regulates mast cell activation by T cell–derived microvesicles. J Allergy Clin Immunol. 2018;141(6):2132–2141.e4. doi:10.1016/j.jaci.2017.06.045
26. Shefler I, Salamon P, Mekori YA. Extracellular vesicles as emerging players in intercellular communication: relevance in mast cell-mediated pathophysiology. Int J Mol Sci. 2021;22(17):9176. doi:10.3390/ijms22179176
27. Dunford PJ, O’Donnell N, Riley JP, et al. The histamine H4 receptor mediates allergic airway inflammation by regulating the activation of CD4+ T cells. J Immunol. 2006;176(11):7062–7070. doi:10.4049/jimmunol.176.11.7062
28. Mommert S, Gschwandtner M, Koether B, et al. Human memory Th17 cells express a functional histamine H4 receptor. Am J Pathol. 2012;180(1):177–185. doi:10.1016/j.ajpath.2011.09.028
29. Jutel M, Akdis CA. Histamine as an immune modulator in chronic inflammatory responses. Clin Exp Allergy. 2007;37(3):308–310. doi:10.1111/j.1365-2222.2007.02666.x
30. Xue L, Fergusson J, Salimi M, et al. Prostaglandin D2 and leukotriene E4 synergize to stimulate diverse TH2 functions and TH2 cell/neutrophil crosstalk. J Allergy Clin Immunol. 2015;135(5):1358–1366.e11. doi:10.1016/j.jaci.2014.09.006
31. de Montjoye L, Choteau M, Herman A, et al. IL-6 and IL-1β expression is increased in autologous serum skin test of patients with chronic spontaneous urticaria. Allergy. 2019;74(12):2522. doi:10.1111/all.13928
32. Olsson N, Taub DD, Nilsson G. Regulation of mast cell migration by TH1 and TH2 cytokines: identification of Tumour Necrosis Factor‐α and Interleukin‐4 as mast cell chemotaxins. Scand J Immunol. 2004;59(3):267–272. doi:10.1111/j.0300-9475.2004.01397.x
33. Robins H. Immunosequencing: applications of immune repertoire deep sequencing. Curr Opin Immunol. 2013;25(5):646–652. doi:10.1016/j.coi.2013.09.017
34. Zhuo Y, Yang X, Shuai P, et al. Evaluation and comparison of adaptive immunity through analyzing the diversities and clonalities of T-cell receptor repertoires in the peripheral blood. Front Immunol. 2022;13:916430. doi:10.3389/fimmu.2022.916430
35. Britanova OV, Putintseva EV, Shugay M, et al. Age-related decrease in TCR repertoire diversity measured with deep and normalized sequence profiling. J Immunol. 2014;192(6):2689–2698. doi:10.4049/jimmunol.1302064
36. Goronzy JJ, Weyand CM. Successful and maladaptive T cell aging. Immunity. 2017;46(3):364–378. doi:10.1016/j.immuni.2017.03.010
 © 2024 The Author(s). This work is published and licensed by Dove Medical Press Limited. The
full terms of this license are available at https://www.dovepress.com/terms
and incorporate the Creative Commons Attribution
- Non Commercial (unported, 3.0) License.
By accessing the work you hereby accept the Terms. Non-commercial uses of the work are permitted
without any further permission from Dove Medical Press Limited, provided the work is properly
attributed. For permission for commercial use of this work, please see paragraphs 4.2 and 5 of our Terms.
© 2024 The Author(s). This work is published and licensed by Dove Medical Press Limited. The
full terms of this license are available at https://www.dovepress.com/terms
and incorporate the Creative Commons Attribution
- Non Commercial (unported, 3.0) License.
By accessing the work you hereby accept the Terms. Non-commercial uses of the work are permitted
without any further permission from Dove Medical Press Limited, provided the work is properly
attributed. For permission for commercial use of this work, please see paragraphs 4.2 and 5 of our Terms.