Back to Journals » OncoTargets and Therapy » Volume 13
Dihydrotestosterone Induces Proliferation, Migration, and Invasion of Human Glioblastoma Cell Lines
Authors Rodríguez-Lozano DC, Velázquez-Vázquez DE ![]() , Del Moral-Morales A
, Del Moral-Morales A ![]() , Camacho-Arroyo I
, Camacho-Arroyo I
Received 12 May 2020
Accepted for publication 1 August 2020
Published 3 September 2020 Volume 2020:13 Pages 8813—8823
DOI https://doi.org/10.2147/OTT.S262359
Checked for plagiarism Yes
Review by Single anonymous peer review
Peer reviewer comments 2
Editor who approved publication: Dr XuYu Yang
Dulce Carolina Rodríguez-Lozano, Diana Elisa Velázquez-Vázquez, Aylin Del Moral-Morales, Ignacio Camacho-Arroyo
Unidad de Investigación en Reproducción Humana, Instituto Nacional de Perinatología-Facultad de Química, Universidad Nacional Autónoma de México (UNAM), Mexico City 04510, Mexico
Correspondence: Ignacio Camacho-Arroyo
Unidad de Investigación en Reproducción Humana, Instituto Nacional de Perinatología-Facultad de Química, Universidad Nacional Autónoma de México, Mexico City 04510, Mexico
Tel +52-55-5622-3732
Email [email protected]
Introduction: Glioblastomas (GBM) are the most frequent and aggressive human brain tumors due to their high capacity to migrate, invade healthy brain tissue, and resist anticancer therapies. It has been reported that testosterone (T) levels are higher in patients with GBM than in healthy controls. It has also been dem{}onstrated that T induces proliferation, migration, and invasion of human GBM cell lines. T is mainly metabolized to 5α-dihydrotestosterone (DHT) by the enzyme 5α-reductase (5αR), but the role of this metabolite in GBM cells is unknown.
Methods: The expression of 5αR isoenzymes and AR in biopsies of GBMs was determined by the analysis of TCGA. U87 and U251 GBM cell lines were grown in supplemented DMEM. For evaluating the expression of AR in U251 and U87 cells, a RT-qPCR was performed. The cells were treated with T, DHT, finasteride (FIN), dutasteride (D), and the combined treatments, FIN+T and D+T or vehicle. After treatments, the viability was quantified by the trypan blue exclusion assay, the proliferation was evaluated by BrdU incorporation, and migration and invasion were analyzed by the scratch-wound and the transwell assays, respectively.
Results: In a set of glioma biopsies from TCGA, we observed that SRD5A2 (5αR2) expression was higher in GBM and in low-grade gliomas than in normal brain tissue. We observed that DHT and T increased proliferation, migration, and invasion of human GBM cell lines: U87 and U251. F and D, drugs that inhibit 5αR activity, blocked the effects of T on GBM cells.
Discussion: These data suggest that T induces human GBM progression through its conversion into DHT. These results can be related to the chemical structure of DHT, which increases its affinity for AR and decreases five times the rate of dissociation compared to T. Also, it is possible that DHT mediates the effects of T on cell human GBM cells motility by changing the expression of genes involved in tumor infiltration.
Keywords: glioblastoma, 5α-reductase, dihydrotestosterone, finasteride, dutasteride
Introduction
Astrocytomas are the most frequent and aggressive tumors of the central nervous system (CNS); their origin is not clear, but it has been proposed that they arise from the malignization of glial cells or cancer stem cells.1–3 The WHO classifies astrocytomas in four grades according to their histopathological characteristics; grade IV or Glioblastoma (GBM) is the most aggressive and frequent astrocytoma.1 GBMs are highly proliferative and invasive tumors with patients average survival time of 14 months after diagnosis.1–5 These tumors are more frequent in men than in women, in a proportion of 3:2, and men have a shorter survival time after diagnosis as compared to women.6,7 Sex hormones such as progesterone and testosterone, have been proposed as responsible for this gender bias. There are several studies regarding the role of progesterone and its metabolites in proliferation, migration, and invasion of human GBM derived cell lines,8–11 but only a few works have investigated the role of testosterone in GBM progression (T).
T is an androgen involved in several processes such as spermatogenesis, behavior, cognition, and neuron differentiation.12,13 It is mainly synthesized in testes by Leydig cells in adult males, and it is distributed through blood circulation to its target tissues.12 T diffuses into the cells through the plasmatic membrane, and binds to the intracellular androgen receptor (AR), which in the nucleus binds to androgen response elements (AREs) in the promoter region of target genes. The binding of this receptor recruits co-regulators that activate or repress transcription.13 In target tissues, T is mainly metabolized to 5α-dihydrotestosterone (DHT) by the enzyme 5α-reductase (5αR). This conversion amplifies T effects since DHT has a higher affinity for AR than the rest of androgens.14 It has been demonstrated that T is metabolized to DHT by 5αR action.15–17
It has been reported that GBM biopsies overexpress AR, and that its levels are directly correlated to the astrocytomas grade.13,14,16 Activation of AR by T induces migration, proliferation, and invasion of human GBM derived cell lines,18 and in line with this, low levels of androgens are associated with a lower risk of glioma;13–19 Finasteride (FIN) and dutasteride (D), both inhibitors of 5αR, have been proposed for GBM treatment.20,21 Since T promotes GBM progression and it is converted into DHT (a more potent androgen), in this work we evaluated the effects of DHT, FIN, and D on proliferation, migration, and invasion of human GBM derived cell lines.
Materials and Methods
TCGA Data Analysis
RNA-Seq counts from 196 grade II, 223 grade III, and 139 grade IV gliomas were obtained from Glioblastoma and Low-Grade Glioma projects of The Cancer Genome Atlas (TCGA) repository (https://portal.gdc.cancer.gov/). The data were downloaded and processed using TCGAbiolinks package version 2.12.6 for R.17 Additionally, expression profiles of 249 healthy brain cortex samples were obtained from GTEx database (https://gtexportal.org/home/). Data were normalized by DESeq2 version 1.22.2 and plotted.
Cell Culture and Treatments
U87 and U251 cell lines (ATCC, VA, USA) were grown in Dulbecco’s Modified Eagle’s medium DMEM (DMEM, Biowest, FRA), supplemented with 10% fetal bovine serum (FBS, Biowest, FRA), pyruvate (1 mM; InVitro SA, MEX), non-essential amino acids (0.1 mM; InVitro SA, MEX), and a mix of antibiotics (1 mM; InVitro SA, MEX) in a humidified atmosphere with 5% CO2 at 37°C. Twenty-four hours before treatments, cells were seeded in phenol red-free DMEM medium (In Vitro S.A., MEX) supplemented with hormone-free FBS (10%) (charcoal-stripped, GeneTex, USA). In order to determine the DHT concentration that significantly modifies the number of GBM cells, they were treated with DHT (0.1, 1, 10 nM). To evaluate proliferation, migration and invasion cells were treated with T (100 nM),18 DHT (10 nM), (FIN (5 µM), D (2.5 µM), the combined treatments, FIN+T and D+T or vehicle (V; 0.01% ethanol). FIN selectively inhibits 5αR2, while D inhibits both 5αR1 and 5αR2 isoenzymes.22,23
RNA Isolation and RT-qPCR
Total RNA from U87 and U251 cells cultured under basal conditions was extracted using TRIzol LS Reagent (Thermo Fisher Scientific, MA, USA) according to the manufacturer’s protocol. RNA concentration and purity were measured with the NanoDrop 2000 Spectrophotometer (Thermo Fisher Scientific, MA, USA). The integrity of the samples was determined with a 1.5% agarose gel electrophoresis. Healthy Human Astrocyte (HA) total RNA was obtained from ScienCell (cat: 1805, ScienCell, CA, USA). One microgram of total RNA was reverse transcribed to cDNA using M-MLV reverse transcriptase (Invitrogen, Carlsbad, CA, USA) and oligo-dT12-18 as primers. Two microliters from the previous reaction were subjected to qPCR using the FastStart DNA Master SYBR Green I reagent kit for LightCycler 1.5 (Roche Diagnostics, Mannheim, Germany) according to the manufacturer’s protocol. The primers sequences used were the following:
AR
FW5ʹ-GACATGCGTTTGGAGACTGC-3ʹ
RV5ʹ-TTTCCCTTCAGCGGCTCTTT-3ʹ
18S
FW5ʹ-AGTGAAACTGCAATGGCTC-3ʹ
RV5ʹ-CTGACCGGGTTGGTTTTGAT-3ʹ
The relative abundance of AR mRNA was calculated by using 18S mRNA as an endogenous reference. Relative expression levels were calculated by the ∆Ct method.
Viability Assay
5 × 10³ U87 and U251 cells were seeded in 24-well plates and grown for 24 h. Cells were treated as previously described, harvested with 1mL PBS-EDTA (1mM) and stained with trypan blue (0.4%) every 24 h during 120 h. Viable cells were quantified with Countess II cell counter (Thermo Fisher Scientific, MA, USA).
Cell Proliferation Assay
5-Bromo-20-deoxyuridine (BrdU) incorporation kit (cat #11,296,736,001 Roche, IN, USA) was used according to the manufacturer’s recommendations to evaluate the proliferative capacity of the cell lines under the effect of the different treatments. 5 × 10³ U87 cells and 4 × 10³ U251 cells were grown in 24-well glass slides and maintained as previously described. After 72 hours of treatment, cells were incubated with BrdU labeling medium for 50 min. After cell fixation, the incorporation of BrdU was detected by immunofluorescence using a fluorescence-labeled secondary antibody. Cell nuclei were stained with Hoechst 33,342 fluorescent dye (1 mg/mL) (Thermo Scientific, USA). Positive BrdU cells were visualized in an Olympus Bx43F microscope (Olympus, PA, USA). Cell counting was done with the ImageJ software 1.45S (National Institutes of Health, USA), and the percentage of BrdU-positive cells was calculated considering the nuclei stained with Hoechst as the total number of cells.
Migration Assay
Scratch-wound assays were performed to determine the effect of the treatments on GBM cell migration. 4 × 10⁵ U251 cells and 5 × 10⁵ U87 cells were seeded per well of a 6-well plate in DMEM medium until reached 60–70% of confluence; then the medium was changed for phenol red-free DMEM, supplemented with FBS (10%) without hormones (charcoal stripped). After cells formed a monolayer (90% confluence), 500 µL of PBS-EDTA (1 mM) were added to each well, and two parallel scratches by well were made with a 200 mL pipet tip. Detached cells were removed by aspiration. Fresh hormone-free DMEM with the cell proliferation inhibitor Cytosine β-D-arabinofuranoside (Ara-C, 10 μM) (Sigma-Aldrich, USA) was added 1 h before treatments. Without removing the medium, the hormonal treatments were added. Photographs of the scratch area per well were taken 0 and 24 h after treatment with an Infinity12C camera coupled to an inverted Olympus CKX41 microscope at 100X magnification. The number of migrating cells into the scratch-wound area were counted using ImageJ (National Institute of Health, WA, USA).
Invasion Assay
To evaluate the effects of the treatments on U87 and U251 cellular invasion, a transwell invasion assay was used. Briefly, transwell chambers (8.0 µm pore membrane insert, Corning, USA) were placed in 24-well plate and covered with 2 mg/mL of matrigel (extracellular matrix gel from Engelbreth-Holm-Swarm; Sigma-Aldrich, USA) in FBS and phenol red-free DMEM. The inserts were incubated at 37 °C and 5% CO2 for 2 h to allow solidification. Eighty-thousand cells were suspended in 150 µL serum-free medium with the treatments and Ara-C (10 µM). The bottom of the wells was filled with 600 µL phenol red-free DMEM with FBS (10%) as a chemoattractant.24 Cells were incubated at 37 °C and 5% CO2 for 24 h. After incubation, the matrigel with the non-invading cells was removed from the upper surface of the transwell membrane, and cells trapped in the porous membrane were fixed with paraformaldehyde (4%) for 20 min, and stained with crystal violet (1%) for 20 min. Finally, the inserts were observed under an inverted microscope (Olympus CKX41), and images were captured with an Infinity1-2C camera at 20X magnification. The number of invading cells was quantified using the ImageJ software 2.6. (National Institute of Health, WA, USA).
Statistical Analysis
TCGA data statistical analysis was performed with R 5.3.2. A one-way ANOVA followed by a Tukey post hoc test was used, and a p<0.05 was considered significant. Rest of the data were analyzed and plotted with GraphPad Prism 5.0 software (GraphPad, USA). Plotted data are representative of three independent experiments. A one-way ANOVA was used to analyze proliferation, migration and invasion data. A two-way ANOVA was used to analyze cell viability. Tukey post hoc test was applied in one-way ANOVA, and Bonferroni test in two-way ANOVA. Values of p<0.05 were considered statistically significant.
Results
AR Expression in Astrocytomas is Dependent on Tumor Grade
AR, SRD5A1 (5αR1) and SRD5A2 (5αR2) expression data from 196 grade II, 223 grade III, and 139 grade IV (GBM) gliomas were obtained from TCGA and compared against 249 healthy brain cortex samples from GTEx database. It was observed that SRD5A2 expression was higher in GBM and in low-grade gliomas than in normal brain tissue. Besides, AR expression directly depended on the astrocytoma grade. No significant differences were observed in the expression of SRD5A1 (Figure 1A). No statistically significant differences were observed between genders in the expression of AR, SRD5A1 and SRD5A2 (Supplementary Figure 1). Interestingly, it was observed that if we normalized the expression of each of these genes by their Z score and cluster the samples, those with higher expression of SRD5A1 belong to a subset (or cluster) of GBMs which also exhibits high expression of AR and SRD5A2 (Figure 1B). Patients gender presented an even distribution in the four generated clusters, indicating that gender is not a critical factor for samples stratification. GBMs were divided into two groups according to their SRD5A1 levels (clusters 3 and 4 in Figure 1B), and differences in survival between cluster 3 and 4 were evaluated, however, no significant differences were observed (Supplementary Figure 2).
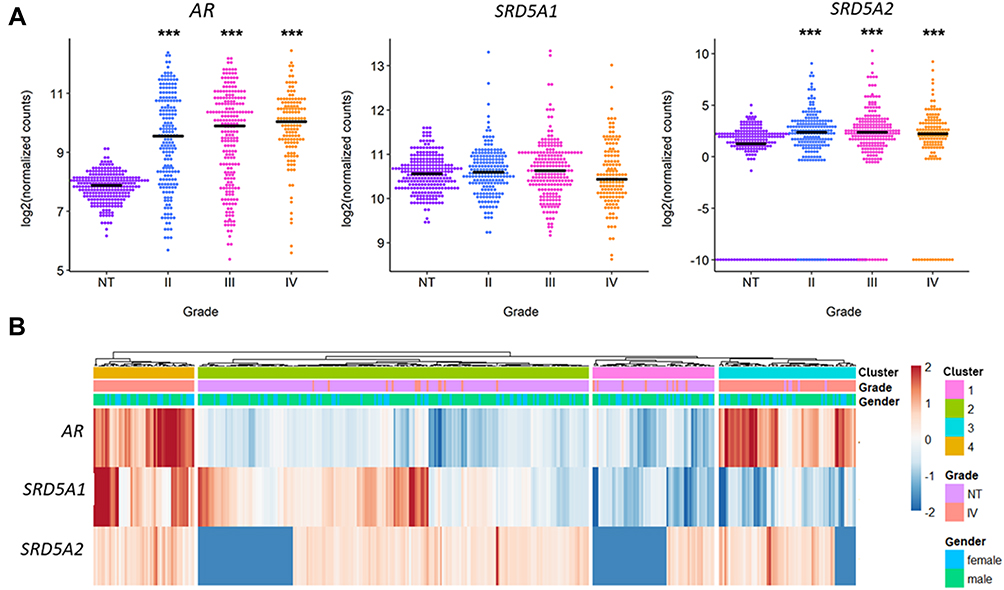 |
Figure 1 AR, SRD5A1 and SRD5A2 expression in human astrocytoma primary tumor biopsies. RNA-Seq data from 322 astrocytoma primary tumors (196 grade II, 223 grade III, 139 grade IV or GBM) were obtained from TCGA repository and compared against 249 samples of normal brain cortex obtained from GTEx database. (A) Log2 of normalized counts in GBM or grade IV gliomas, grade III and II gliomas and Normal Tissue (NT). ***p<0.001 vs NT. (B) Heat map of the expression of AR, SRD5A1 and SRD5A2 in the GBM and NT samples. Zscore was used in order to scale the expression of each gene. |
DHT Increases Cell Growth
U87 and U251 cells, both derived from human GBM, were used to assess the effects of DHT on the growth of GBMs. Initially, the expression of AR in these cell lines was determined by RT-qPCR, as well as the concentration of DHT that increased the number of cells (Supplementary Figures 3 and 4). Then a cell count was performed for five consecutive days by using the blue dye exclusion technique. U87 and U251 cells were treated with DHT (10 nM), T (100 nM), and two 5αR inhibitors: finasteride (FIN, 5 μM) and dutasteride (D 2.5 μM) to determine if the effect of T could be inhibited by blocking the formation of DHT from T. Androgens increased cell growth from days 3 and 4 of treatment in U251 and U87 cells, respectively (Figure 2A and C). In U251 cells, the effect of DHT was significantly higher than that of T on day 3. FIN alone had no effects on cell growth. In contrast, D decreased the number of cells with respect to vehicle (day 3) (Figure 2A and C). Both 5αR inhibitors blocked the effect of T in U87 and U251 cell lines. Cell viability was not significantly modified with any treatment (Figure 2B and D).
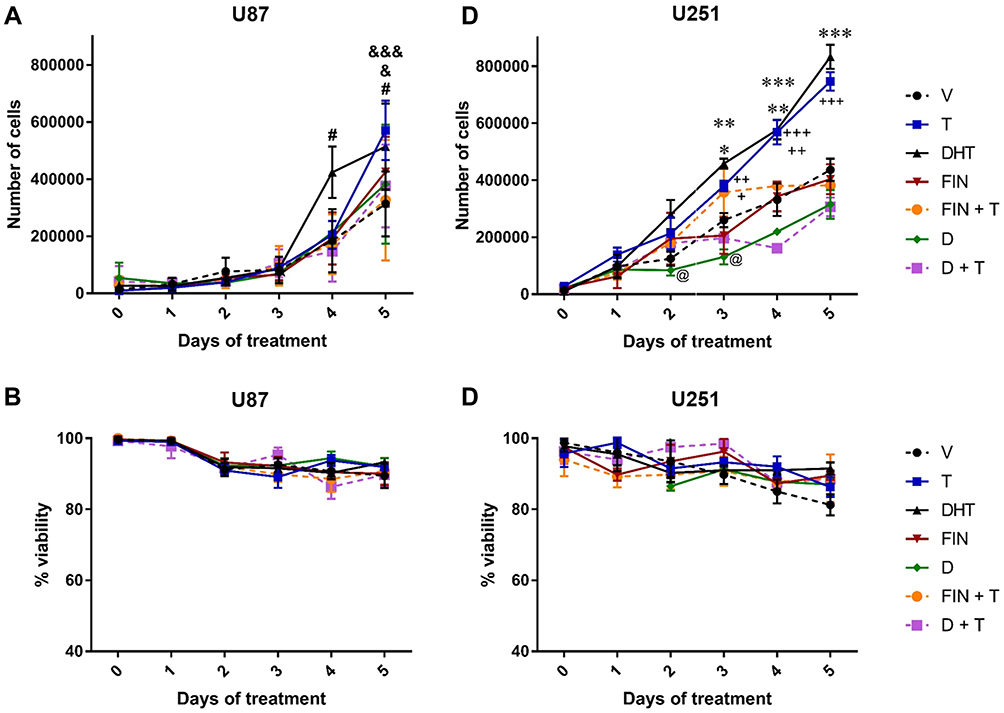 |
Figure 2 Effect of DHT on the growth and viability of human GBM cells. The number of U87 and U251 human GBM cells were counted for 5 days. (A) Effect of DHT on the number of U87 and (C) U251 cells. (B) and (D) Show the effect of DHT on cell viability. Testosterone (T, 100 nM), dihydrotestosterone (DHT, 10 nM), finasteride (FIN, 5 µM), dutasteride (D, 2.5 µM), vehicle (V; 0.01% ethanol). Each point represents the mean ± SD, n = 4. #p<0.05 DHT vs V; &p<0.05 T vs. D; &&&p<0.001 T vs. V; *p<0.05 D vs. V; **p<0.01 DHT vs FIN and FIN+T; ***p<0.001 DHT vs V, D and D+T;+ p<0.05 T vs D and DHT; ++p<0.01 T vs V, FIN and FIN+T; +++p<0.001 T vs D and D+T; @ p<0.05 D vs V. |
DHT Induces the Proliferation of GBM Derived Cells
To determine if the effect of DHT on cell growth is due to an increase in proliferation of GBM derived cells, the BrdU incorporation technique was performed on day 3 of treatment. Results showed that T and its metabolite DHT, increased proliferation of U87 and U251 cells; in the latter, the effect of DHT was higher than that of T. In both cell lines, FIN and D inhibited the effect of T. Individual treatment with FIN had no significant effect on proliferation. In contrast, D decreased cell proliferation with respect to the vehicle in U251 cells (Figure 3).
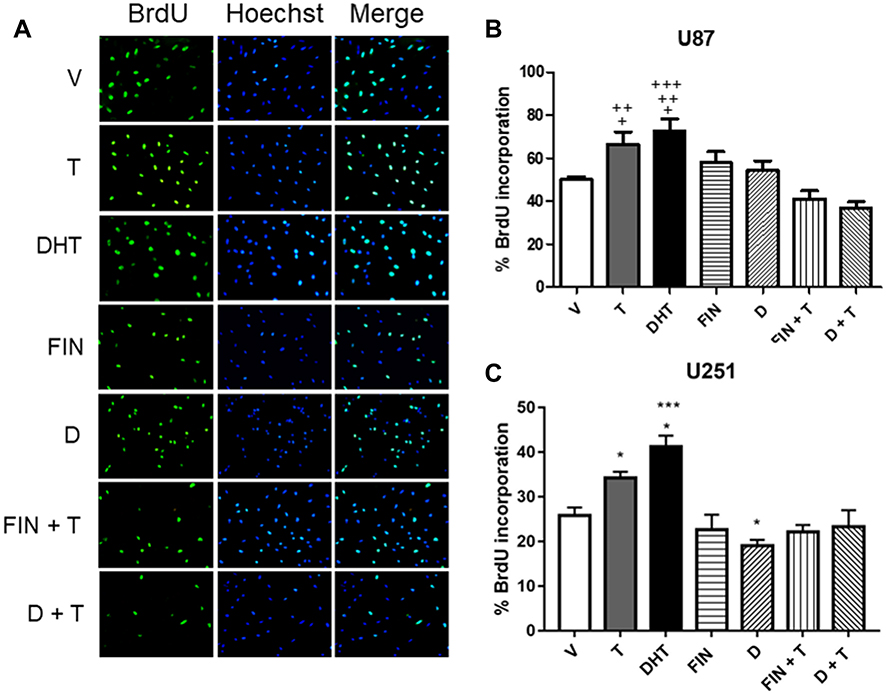 |
Figure 3 Effect of DHT on the proliferation of human GBM cells. Three days after treatments, cell proliferation was measured by the BrdU incorporation assay. (A) Representative immunofluorescence images of BrdU positive cells (left panel), cell nuclei (Hoechst stain, middle panel), and merge (right panel) are shown. Percentage of BrdU incorporation in (B) U87 and (C) U251 cells derived from a GBM treated with vehicle (V), T (100 nM), DHT (10 nM), FIN (5 μM), FIN+T, D (2.5 μM) and D+T. Each bar indicates the mean ± SD, n = 3. +p<0.05 DHT vs. V, T vs FIN+T; ++p<0.05 T vs. D+T, DHT vs FIN+T; +++p<0.01 DHT vs D+T; *p<0.05 D vs. V and DHT vs. T, ***p<0.001 DHT vs V, Fin, D, FIN+T and D+T. |
DHT Induces the Migration of Cells Derived from Human GBM
In order to evaluate the effect of DHT on the migration of human GBM cells, the “Scratch test” was performed. Androgens increased the number of migrating cells at 24 hours in both cell lines. FIN and D blocked the effect of T, and treatments with 5αR inhibitors alone had no effect on cell migration (Figure 4).
 |
Figure 4 Effect of DHT on human GBM cell migration. (A) In the left panel, representative photographs of U87 cell migration assay are observed at 0 and 24 hours. (B) U87, and (C) U251 show number of migrating cells at 24 hours treated with V, T, DHT, FIN, D, FIN+T, and D+T, each point represents the mean ± SD, n = 3. +p<0.05 T vs V, and D; ++p<0.01 T vs FIN, DHT vs D, FIN+T and D+T; +++p<0.001 DHT vs V, FIN; **p<0.01 T vs V, FIN, D+ T, and DHT vs D; ***p<0.001 DHT vs V, FIN, and D+T. |
DHT Induces the Invasion of GBM Cells
The effect of DHT on cell invasion was evaluated by a transwell chamber assay. Results show that T and DHT promoted invasion of U87 and U251 cells at 24 hours as compared to the vehicle. The effect of T was blocked by 5αR inhibitors (Figure 5).
 |
Figure 5 Effect of DHT on GBM cell invasion. (A) Representative photographs are observed in an invasion assay at 24 hours with different treatments in U87 cells. (B) Graphs of U87, and (C) U251 cells represent number of invading cells t at 24 hours with vehicle, testosterone (T, 100 nM), DHT (10 nM), Finasteride (FIN, 5 μM), FIN+ T, Dutasteride (D, 2.5 μM) and D + T, each point represents the mean ± SD, n = 3. +p<0.05 T vs V, and D; ++p<0.01 T vs FIN, DHT vs D, FIN+T and D+T; +++p<0.001 DHT vs V, FIN; * p<0.05 DHT vs FIN+ T; **p<0.01 T vs V, FIN, D+ T, and DHT vs D; ***p<0.001 DHT vs V, FIN, and D+T. |
Discussion
GBM incidence is higher in men than in women in a 3:2 ratio.4,5 Previous investigations have demonstrated that the activation of AR by T induces migration, proliferation, and invasion of human GBM derived cell lines,18 and that high serum levels of this androgen are associated with the presence of gliomas.13 For that reason, the aim of this work was to evaluate the role of DHT, the main and most potent T reduced metabolite, in proliferation, migration, and invasion of human GBM cell lines.
It is well known that androgens are involved in the progression of cancers such as prostate, colon, and lung,25,26 Androgens can exert their multiple effects through the interaction with AR, a ligand dependent transcription factor that once activated, binds to AREs located in gene promoter regions, thus regulating their expression.11 It has been reported that GBM biopsies overexpress AR, and that its expression is directly correlated to the astrocytomas grade.13,14,20 In the present study, we corroborated by a bioinformatic analysis of these data: a higher expression of AR was found in astrocytomas compared to healthy brain cortex samples from GTEx database.
We evaluated the role of DHT in the growth and proliferation of U87 and U251 cells derived from human GBM. Results indicated that androgens induced both processes, and that DHT was more potent than T from the third and fourth days in U251 and U87 cells, respectively. These results can be due to the chemical structure of androgens, since DHT differs from T because of the absence of a double bond in ring A, which increases its affinity for AR and decreases five times the rate of dissociation compared to.12,27 In a healthy human body, this effect is compensated by a higher concentration of T,28 and approximately only 10% is converted to DHT in tissues that express 5αR.29
DHT is the main metabolite of T, which is catalyzed by 5αR in different regions of the body, including CNS. 5αR has been located in the hippocampus, cerebellum, and cerebral cortex in humans,30 and in cerebrospinal fluid, plasma, hippocampus, cerebral cortex, cerebellum, spinal cord, and sciatic nerve in mice.28 5αR1 and 5αR2 isoenzymes are differentially expressed in the brain adult, 5αR1 expression is higher than that of 5αR2,28,31,32 while the subtype 5αR2 is only expressed in the fetal period, indicating that this subtype has a vital role during development.33 In pathological conditions, the expression of this isoenzymes is altered; In prostate cancer, the expression of 5αR1 increased while that of 5αR2 decreased, but in cases of recurrence and metastatic cancers, both 5αR isozymes present an increased expression, suggesting that both isoenzymes participate in the development and progression of cancer.34,35 In cell lines derived from human GBM, the expression of these isoenzymes was evaluated, and it was found that at mRNA level, 5αR1 (SRD5A1) expression was higher than that of 5αR2 (SRD5A2).36 In this work, we observed that 5αR1 expression in GBM is similar to that in normal tissue, whereas 5αR2 is over expressed in GBM compared to normal tissue.
To evaluate if DHT mediates T effects on growth and proliferation of human GBM cells, two 5αR inhibitors were used: finasteride (FIN) and dutasteride (D). FIN can selectively inhibit 5αR2, while D inhibits both 5αR1 and 5αR2.23 Although the expression of 5αR1 is higher than that of 5αR2, data show that both inhibitors blocked the inducing effect of T. Besides, D decreased the growth and proliferation of U251 cells. Comparing the effect of FIN and D on cell proliferation in prostate cancer, it was observed that the inhibition of both isoenzymes with D was more effective than inhibition of 5αR2 alone with FIN.37
Another main characteristics of GBM is its infiltration capacity; therefore, the role of DHT in migration and invasion of U87 and U251 cells was evaluated. To ensure that the increase in the number of cells that migrated or invaded was only due to a greater motility and not to an increase in cell proliferation, experiments were performed in the presence of AraC, a potent inhibitor of cell replication.38,39 Results demonstrated that T and DHT promote migration and invasion of both cell lines at 24 hours. Individual treatments with FIN or D had no effects on the number of cells that migrated or invaded. Importantly, the inductor effect of T was blocked with FIN and D. Unlike migration, cell invasion involves cell adhesion and extracellular matrix degradation, allowing cells to penetrate through tissue barriers such as the basement membrane and stroma. Previous studies corroborated that FIN can inhibit cell invasion by downregulating two matrix metalloproteinases, MMP2 and MMP9,40 and that 5αR2 exogenous over expression in a prostate cancer cell line, can decrease cell migration and invasion, indirectly controlling ERK/MAPK pathways.41 In cell lines derived from human GBM, we have demonstrated that FIN can regulate the expression of cellular components of movement.9 Therefore, it is possible that DHT mediates the effects of T on cell human GBM cells motility by changing the expression of genes involved in tumor infiltration.
Our results showed that both 5αR1 and 5αR2 mediate T effects on GBM. These data are consistent with a recently published study by Pinacho-Gacía (2019), who described that FIN or D reduced androgen synthesis in U87 cells.21 In addition, clinical studies mentioned that the treatment with antiandrogens and 5αR inhibitors might be more effective in blocking androgen effects.37–42 In this regard, we have demonstrated that flutamide, an AR antagonist can block the effects of T on proliferation, migration, and invasion of cells derived from human GBM.18 Although effectiveness of 5αR inhibitors in modulating androgenic alopecia has been demonstrated in both men and women,43 and prostate cancer;37 the consequences of its use are under study,44 for example, in sexual function, men libido, and T levels.45,46 Therefore, additional experiments are required to determine the effects of T metabolism inhibitors in the treatment of GBM.
Conclusion
Results show that DHT and T promote proliferation, migration, and invasion of human GBM cell lines, and that these effects are blocked by FIN and D, suggesting that the metabolism of T into DHT mediated by the two isoenzymes of 5αR is critical for GBM progression.
Acknowledgments
This work was supported by Grant Project 2020 PAPIIT IN217120.
Author Contributions
All authors made substantial contributions to conception and design, acquisition of data, or analysis and interpretation of data; took part in drafting the article or revising it critically for important intellectual content; agreed to submit to the current journal; gave final approval of the version to be published; and agree to be accountable for all aspects of the work.
Disclosure
The authors declare that they have no conflict of interest.
References
1. Louis DN, Perry A, Reifenberger G, et al. The 2016 world Health organization classification of tumors of the central nervous system: a summary. Acta Neuropathol. 2016;131(6):803–820. doi:10.1007/s00401-016-1545-1
2. Furnari FB, Fenton T, Bachoo RM, et al. Malignant astrocytic glioma: genetics, biology, and paths to treatment. Genes Dev. 2007;21(21):2683–2710. doi:10.1101/gad.1596707
3. Nachbichler SB, Schupp G, Ballhausen H, Niyazi M, Belka C. Temozolomide during radiotherapy of glioblastoma multiforme: daily administration improves survival. Strahlenther Onkol. 2017;193(11):890–896. doi:10.1007/s00066-017-1110-4
4. Ostrom QT, Cioffi G, Gittleman H, et al. CBTRUS statistical report: primary brain and other central nervous system tumors diagnosed in the United States in 2012–2016. Neuro-Oncology. 2019;21(Supplement_5):v1–v100. doi:10.1093/neuonc/noz150
5. Tian M, Ma W, Chen Y, et al. Impact of gender on the survival of patients with glioblastoma. Biosci Rep. 2018;38(6). doi:10.1042/BSR20180752
6. González-Arenas A, Cabrera-Wrooman A, Díaz N, et al. Progesterone receptor subcellular localization and gene expression profile in human astrocytoma cells are modified by progesterone. Nucl Recept Res. 2014;1:1–10. doi:10.11131/2014/101098
7. González-Agüero G, Gutiérrez AA, González-Espinosa D, et al. Progesterone effects on cell growth of U373 and D54 human astrocytoma cell lines. Endocrine. 2007;32(2):129–135. doi:10.1007/s12020-007-9023-0
8. Germán-Castelán L, Manjarrez-Marmolejo J, González-Arenas A, González-Morán MG, Camacho-Arroyo I. Progesterone induces the growth and infiltration of human astrocytoma cells implanted in the cerebral cortex of the rat. Biomed Res. 2014;1–8.
9. Zamora-Sánchez CJ, Del Moral-Morales A, Hernández-Vega A, et al. Allopregnanolone alters the gene expression profile of human glioblastoma cells. Int J Mol Sci. 2018;19(3):864. doi:10.3390/ijms19030864
10. Zirkin BR, Papadopoulos V. Leydig cells: formation, function, and regulation. Biol Reprod. 2018;99(1):101–111. doi:10.1093/biolre/ioy059
11. Smith LB, Walker WH. The regulation of spermatogenesis by androgens. Semin Cell Dev Biol. 2014;30:2–13. doi:10.1016/j.semcdb.2014.02.012
12. Storbeck KH, Mostaghel EA. Canonical and noncanonical androgen metabolism and activity. In: Dehm S, Tindall D, editors. Prostate Cancer. Advances in Experimental Medicine and Biology. Cham: Springer; 2019:1210.
13. Bao D, Cheng C, Lan X, et al. Regulation of p53wt glioma cell proliferation by androgen receptor-mediated inhibition of small VCP/p97-interacting protein expression. Oncotarget. 2017;8(14):23142–23154. doi:10.18632/oncotarget.15509
14. Yu X, Jiang Y, Wei W, et al. Androgen receptor signaling regulates growth of glioblastoma multiforme in men. Tumour Biol. 2015;36(2):967–972. doi:10.1007/s13277-014-2709-z
15. Melcangi RC, Poletti A, Cavarretta I, et al. The 5alpha-reductase in the central nervous system: expression and modes of control. J Steroid Biochem Mol Biol. 1998;65(1–6):295–299. doi:10.1016/S0960-0760(98)00030-2
16. Zalcman N, Canello T, Ovadia H, et al. Androgen receptor: a potential therapeutic target for glioblastoma. Oncotarget. 2018;9(28):19980–19993. doi:10.18632/oncotarget.25007
17. Colaprico A, Silva TC, Olsen C, et al. TCGAbiolinks: an R/Bioconductor package for integrative analysis of TCGA data. Nucleic Acids Res. 2016;44(8):e71. doi:10.1093/nar/gkv1507
18. Rodríguez-Lozano DC, Piña-Medina AG, Hansberg-Pastor V, Bello-Álvarez C, Camacho-Arroyo I. Testosterone promotes glioblastoma cell proliferation, migration, and invasion through androgen receptor activation. Front Endocrinol. 2019;10:16. doi:10.3389/fendo.2019.00016
19. Seliger C, Ricci C, Meier CR, et al. Diabetes, use of antidiabetic drugs, and the risk of glioma. Neuro Oncol. 2016;18(3):340–349. doi:10.1093/neuonc/nov100
20. Ceccarelli I, Rossi A, Maddalena M, Weber E, Aloisi AM. Effects of morphine on testosterone levels in rat C6 glioma cells: modulation by anastrozole. J Cell Physiol. 2009;221(1):1–4. doi:10.1002/jcp.21830
21. Pinacho-Garcia LM, Valdez RA, Navarrete A, Cabeza M, Segovia J, Romano MC. The effect of finasteride and dutasteride on the synthesis of neurosteroids by glioblastoma cells. Steroids. 2019;155:108556. doi:10.1016/j.steroids.2019.108556
22. Rittmaster R. 5 alpha-reductase inhibitors. J Androl. 1997;18(6):582–587.
23. Clark R, Hermann D, Cunningham G, Wilson T, Morrill B, Hobbs S. Marked suppression of dihydrotestosterone in men with benign prostatic hyperplasia by dutasteride, a dual 5alpha-reductase inhibitor. J Clin Endocrinol Metab. 2004;89(5):2179–2184. doi:10.1210/jc.2003-030330
24. Chen HC. Boyden chamber assay. Methods Mol Biol. 2005;294:15–22. doi:10.1385/1-59259-860-9:015
25. Zhu ML, Kyprianou N. Androgen receptor and growth factor signaling cross-talk in prostate cancer cells. Endocr Relat Cancer. 2008;15:841–849. doi:10.1677/ERC-08-0084
26. Hyde Z, Flicker L, McCaul K, et al. Associations between testosterone levels and incident prostate, lung, and colorectal cancer. A population-based study. Cancer Epidemiol Biomarkers Prev. 2012;21(8):1319–1329. doi:10.1158/1055-9965.EPI-12-0129
27. Fletcher CE, Dart DA, Bevan CL. Interplay between steroid signalling and microRNAs: implications for hormone-dependent cancers. Endocr Relat Cancer. 2014;21(5):R409–R429. doi:10.1530/ERC-14-0208
28. Azzouni F, Godoy A, Li Y, Mohler J. The 5 alpha-reductase isozyme family: a review of basic biology and their role in human diseases. Adv Urol. 2012;2012:530121. doi:10.1155/2012/530121
29. Toorians A, Kelleher S, Gooren LJ, Jimenez M, Handelsman DJ. Estimating the contribution of the prostate to blood dihydrotestosterone. J Clin Endocrinol Metab. 2003;88(11):5207–5211. doi:10.1210/jc.2003-030521
30. Aumüller G, Eicheler W, Renneberg H, Adermann K, Vilja P, Forssmann WG. Immunocytochemical evidence for differential subcellular localization of 5α-reductase isoenzymes in human tissues. Acta Anat. 1996;156(4):241–252. doi:10.1159/000147852
31. Melcangi RC, Giatti S, Garcia-Segura LM. Levels and actions of neuroactive steroids in the nervous system under physiological and pathological conditions: sex-specific features. Neurosci Biobehav Rev. 2016;67:25–40. doi:10.1016/j.neubiorev.2015.09.023
32. Pelletier G. Steroidogenic enzymes in the brain: morphological aspects. Prog Brain Res. 2010;181:193–207.
33. Thigpen AE, Silver RI, Guileyardo JM, Casey ML, McConnell OD, Russell DW. Tissue distribution and ontogeny of steroid 5α-reductase isozyme expression. J Clin Invest. 1993;92(2):903–910. doi:10.1172/JCI116665
34. Thomas LN, Lazier CB, Gupta R, et al. Differential alterations in 5α-reductase type 1 and type 2 levels during development and progression of prostate cancer. Prostate. 2005;63(3):231–239. doi:10.1002/pros.20188
35. Thomas L, Douglas RC, Lazier CB, Too CK, Rittmaster RS, Tindall DJ. Type 1 and type 2 5alpha-reductase expression in the development and progression of prostate cancer. Eur Urol. 2008;53(2):244–252. doi:10.1016/j.eururo.2007.10.052
36. Zamora-Sánchez CJ, Hansberg-Pastor V, Salido-Guadarrama I, Rodríguez-Dorantes M, Camacho-Arroyo I. Allopregnanolone promotes proliferation and differential gene expression in human glioblastoma cells. Steroids. 2017;119:36–42. doi:10.1016/j.steroids.2017.01.004
37. Das K, Lorena P, Ng LK, et al. Differential expression of steroid 5α-reductase isozymes and association with disease severity and angiogenic genes predict their biological role in prostate cancer. Endocr Relat Cancer. 2010;17(3):757–770. doi:10.1677/ERC-10-0022
38. Grem J, Geoffroy F, Politi P, et al. Determinants of sensitivity to 1-beta- D-arabinofuranosylcytosine in HCT 116 and NCI-H630 human colon carcinoma cells. Mol Pharmacol. 1995;28:305–315.
39. Grant S. Ara-C: cellular and molecular pharmacology. Adv Cancer Res. 1998;72:197–233.
40. Moroz A, Delella FK, Almeida R, et al. Finasteride inhibits human prostate cancer cell invasion through MMP2 and MMP9 downregulation. PLoS One. 2013;8(12):e84757. doi:10.1371/journal.pone.0084757
41. Aggarwal S, Singh M, Kumar A, Mukhopadhyay T. SRD5A2 gene expression inhibits cell migration and invasion in prostate cancer cell line via F-actin reorganization. Mol Cell Biochem. 2015;408(1–2):15–23. doi:10.1007/s11010-015-2478-z
42. Lao K, Xun G, Gou X, Xiang H. Design, synthesis, and biological evaluation of novel and rost-17β-amide structurally related compounds as dual 5α-reductase inhibitors and androgen receptor antagonists. J Enzyme Inhib Med Chem. 2019;34(1):1597–1606. doi:10.1080/14756366.2019.1654469
43. Gupta A, Mays RR, Dotzert MS, Versteeg SG, Shear NH, Piguet V. Efficacy of non-surgical treatments for androgenetic alopecia: a systematic review and network meta-analysis. J Eur Acad Dermatol Venereol. 2018;32(12):2112–2125. doi:10.1111/jdv.15081
44. Wang J, Zhao S, Luo L, Li E, Li X, Zhao Z. 5-alpha reductase inhibitors and risk of male breast cancer: a systematic review and meta-analysis. Int Braz J Urol. 2018;44(5):865–873. doi:10.1590/s1677-5538.ibju.2017.0531
45. Liu L, Zhao S, Li F, et al. Effect of 5α-reductase inhibitors on sexual function: a meta-analysis and systematic review of randomized controlled trials. J Sex Med. 2016;13(9):1297–1310. doi:10.1016/j.jsxm.2016.07.006
46. Traish A, Krakowsky Y, Doros G, Morgentler A. Do 5α-reductase inhibitors raise circulating serum testosterone levels? A comprehensive review and meta-analysis to explaining paradoxical results. Sex Med Rev. 2019;7(1):95–114. doi:10.1016/j.sxmr.2018.06.002
 © 2020 The Author(s). This work is published and licensed by Dove Medical Press Limited. The
full terms of this license are available at https://www.dovepress.com/terms
and incorporate the Creative Commons Attribution
- Non Commercial (unported, 3.0) License.
By accessing the work you hereby accept the Terms. Non-commercial uses of the work are permitted
without any further permission from Dove Medical Press Limited, provided the work is properly
attributed. For permission for commercial use of this work, please see paragraphs 4.2 and 5 of our Terms.
© 2020 The Author(s). This work is published and licensed by Dove Medical Press Limited. The
full terms of this license are available at https://www.dovepress.com/terms
and incorporate the Creative Commons Attribution
- Non Commercial (unported, 3.0) License.
By accessing the work you hereby accept the Terms. Non-commercial uses of the work are permitted
without any further permission from Dove Medical Press Limited, provided the work is properly
attributed. For permission for commercial use of this work, please see paragraphs 4.2 and 5 of our Terms.