Back to Journals » Clinical Ophthalmology » Volume 13
Digital image processing software for diagnosing diabetic retinopathy from fundus photograph
Authors Ratanapakorn T, Daengphoonphol A, Eua-Anant N, Yospaiboon Y, Yospaiboon Y ![]()
Received 22 November 2018
Accepted for publication 20 February 2019
Published 17 April 2019 Volume 2019:13 Pages 641—648
DOI https://doi.org/10.2147/OPTH.S195617
Checked for plagiarism Yes
Review by Single anonymous peer review
Peer reviewer comments 2
Editor who approved publication: Dr Scott Fraser
Tanapat Ratanapakorn,1 Athiwath Daengphoonphol,2 Nawapak Eua-Anant,2 Yosanan Yospaiboon1
1KKU Eye Center, Department of Ophthalmology, Faculty of Medicine, Khon Kaen University, Khon Kaen, Thailand; 2Department of Computer Engineering, Faculty of Engineering, Khon Kaen University, Khon Kaen, Thailand
Objective: The aim of this study was to develop automated software for screening and diagnosing diabetic retinopathy (DR) from fundus photograph of patients with diabetes mellitus.
Methods: The extraction of clinically significant features to detect pathologies of DR and the severity classification were performed by using MATLAB R2015a with MATLAB Image Processing Toolbox. In addition, the graphic user interface was developed using the MATLAB GUI Toolbox. The accuracy of software was measured by comparing the obtained results to those of the diagnosis by the ophthalmologist.
Results: A set of 400 fundus images, containing 21 normal fundus images and 379 DR fundus images (162 non-proliferative DR and 217 proliferative DR), was interpreted by the ophthalmologist as a reference standard. The initial result showed that the sensitivity, specificity and accuracy of this software in detection of DR were 98%, 67% and 96.25%, respectively. However, the accuracy of this software in classifying non-proliferative and proliferative diabetic retinopathy was 66.58%. The average time for processing is 7 seconds for one fundus image.
Conclusion: The automated DR screening software was developed by using MATLAB programming and yielded 96.25% accuracy for the detection of DR when compared to that of the diagnosis by the ophthalmologist. It may be a helpful tool for DR screening in the distant rural area where ophthalmologist is not available.
Keywords: automated diabetic retinopathy software, diabetic retinopathy screening, fundus photography diagnosis, digital image processing
Introduction
Diabetic retinopathy (DR) is a leading cause of vision loss worldwide. It is one of the most common causes of preventable blindness and visual impairment.1 A meta-analysis involving 35 studies worldwide estimated the global prevalence of DR among diabetes patients to be 7.62%–47.1%.2 The severity of DR can be divided into two stages as non-proliferative diabetic retinopathy (NPDR) and proliferative diabetic retinopathy (PDR). NPDR can be subdivided into mild, moderate and severe. Mild NPDR is an early stage with microaneurysm (MA) and dot/blot hemorrhage (HA) occurring. Flame-shaped hemorrhages (FSHs), hard exudates (HEs) and cotton-wool spots (CWSs) occur in moderate NPDR stage as the disease progresses. In the severe NPDR stage, many more MAs, HAs or venous beading (VB) occurs. The PDR stage is the advanced stage of DR. The significant pathologies are new abnormal blood vessels that called neovascularization (NV), pre-retinal hemorrhages (PHs), vitreous hemorrhage (VH), and fibrous proliferation (FP), which is the cause of tractional retinal detachment. Screening and diagnosing DR early can prevent visual loss and blindness in these diabetic patients. In distant rural area, however, there is no ophthalmologist available. Therefore, we developed automation software that can screen and diagnose DR with the pathology extraction by using the digital image processing algorithms. It is expected that this software can be a helpful tool for the medical personnel who has less experience in diagnosing DR.
Materials and methods
This study followed the tenets of Declaration of Helsinki and was approved by the Khon Kaen University Ethics Committee for Human Research. Written informed consent from the patients to review their fundus photographs was not required by the ethics committee. The fundus photographs had no link to the patients’ identities, and the researcher respected the privacy of the patients. A total of 400 fundus images with 45° field of view from KKU Eye Center, Faculty of Medicine, Khon Kaen University were initially diagnosed and classified based on the DR severity into three groups as no DR, NPDR and PDR by the ophthalmologist (TR). The conceptual framework of this study is to develop the software in a kind of top-down programming. MATLAB R2015a with MATLAB Image Processing Toolbox (The MathWorks Inc., Natick, MA, USA) was used to extract the clinically significant features of DR pathologies and classify the severity of DR. The accuracy of software was measured by comparing the obtained results with the reference standard, diagnosis from the ophthalmologist. The sensitivity, specificity, positive predictive value and negative predictive value of this software were also reported.
Results
Development of the software
Figure 1 shows the proposed four main steps in the development of the software.
 | Figure 1 The four main steps in the development of the software. |
Fundus image normalization
This was the first step called pre-processing. The fundus image was normalized using the image enhancement and restoration techniques to improve the quality of the image.3 Therefore, the objects and background were more suitable for feature extraction in the next steps. The Gaussian low-pass filter was used to reduce blocking artifacts in the fundus image, which was the high compression ratio. The RGB retinal images were converted into multiple channel images including gray scale, R, G and B component images in order to distinguish objects from background. Contrast-limited Adaptive Histogram Equalization (CLAHE) was used to enhance the contrast of local areas in gray scale images. Then, the 2D median filter was applied to reduce impulse noises. Figure 2 shows the results of the proposed method.
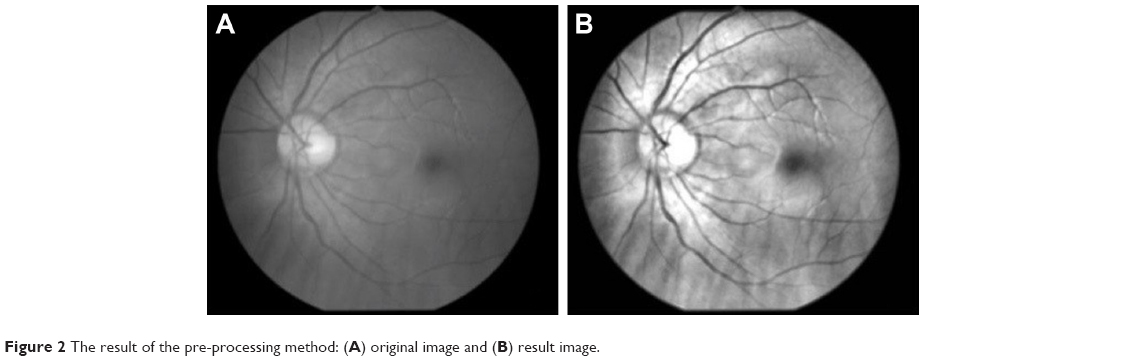 | Figure 2 The result of the pre-processing method: (A) original image and (B) result image. |
Structure extraction of general fundus image
In this step, the feature extraction of general fundus image was performed, which could be divided into three features: optic disk, fovea and vessel structure.
Optic disc localization
The localization of an optic disc was performed initially by thresholding a red component image where an optic disc has pixel intensity brighter than other regions.4 The area/perimeter2 ratio of each area was computed. The region with highest ratio was chosen to be the optic disc area. After that morphological closing operation and convex hull technique were then applied to complete localization of the optic disc region. The results are shown in Figure 3.
 | Figure 3 Localization of optic disk: (A) original image and (B) result image. |
Fovea and macula localization
Image subtraction and object segmentation were used to locate fovea and macula.5 Morphological erosion was also used to complete fovea and macula object. The position of fovea was defined to be not far from the center of optic disc than twice of the size of optic disc in horizontal direction. An example result is shown in Figure 4.
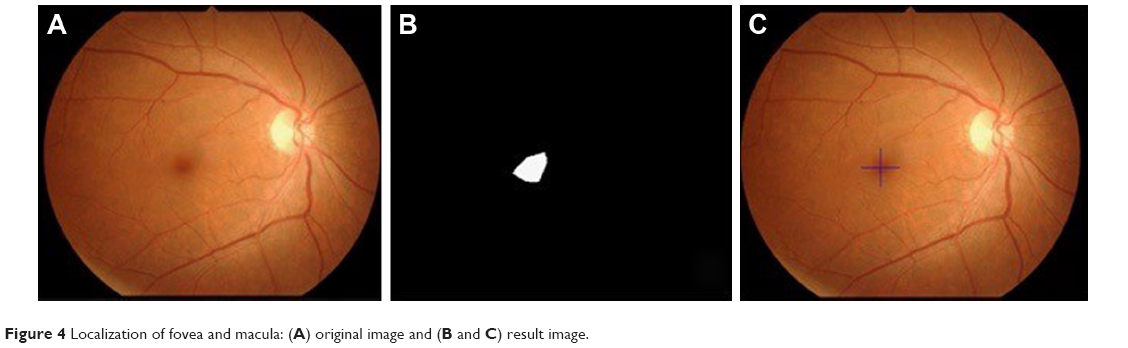 | Figure 4 Localization of fovea and macula: (A) original image and (B and C) result image. |
Vessel extraction
The retinal vessels were best seen in the green component image. The new images were reconstructed using morphological reconstruction and the bottom hat filtered the image.6 The output image of segmented vessels was obtained by combining all reconstructed images. After applying the region growing algorithm, the results are shown in Figure 5.
 | Figure 5 Vessel extraction: (A) original image and (B) result image. |
Extraction of DR pathology
The algorithms were developed to cover the DR pathologies corresponding to the severity classification of DR. The proposed algorithms could be separated by each structure of pathology in fundus image accordingly.
Detection of brightening pathologies
Lesions with bright intensity and sharp edges such as HAs, CWSs and FP could be segmented by using intensity thresholding from the bright objects with sharp edges and highest contrast.7 The results are shown in Figures 6 and 7.
 | Figure 6 An example result of hard exudate and cotton-wool spot detection: (A) original image and (B) result image. |
 | Figure 7 An example result of fibrous proliferation detection: (A) original image and (B) result image. |
MA and HA detection
The green component of preprocessed image was the threshold with intensity lower than 20% of the maximum intensity and eliminated the optic disk, fovea and blood vessels to detect MAs and HAs.8 The Canny edge detection was later performed on the result image. To classify MAs, dot/blot HAs or FSHs, minor and major axes, original areas and convex hull areas of each labeled objects were calculated. The size of object was taken into consideration. Large objects were classified as FSHs, whereas very large objects were classified as either PH or VH. It was noted that, in comparison with VH, only PH has a noticeable horizontal line. The result is shown in Figure 8.
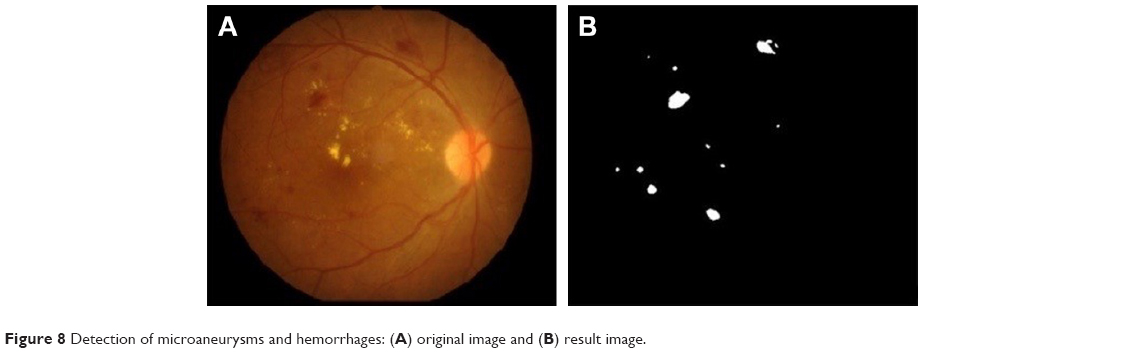 | Figure 8 Detection of microaneurysms and hemorrhages: (A) original image and (B) result image. |
VB detection
VB was characterized by tortuous retinal vein and aneurysm-like wampum. By considering the difference between maximum and minimum radiuses of vessels along vessel length, VB was detected when this difference was greater than the threshold value and such variations of vessel radiuses occurred at least defined times along the vessel part.9 The result is shown in Figure 9.
 | Figure 9 An example result of venous beading detection: (A) original image, (B) result of vessel extraction and (C) the diameter and perimeter of vessels. |
Abnormalities and tortuosity
The pathologies could be measured from structures and this algorithm classifies VB in severe NPDR, and NVE or NVD in PDR. The result is shown in Figure 10.
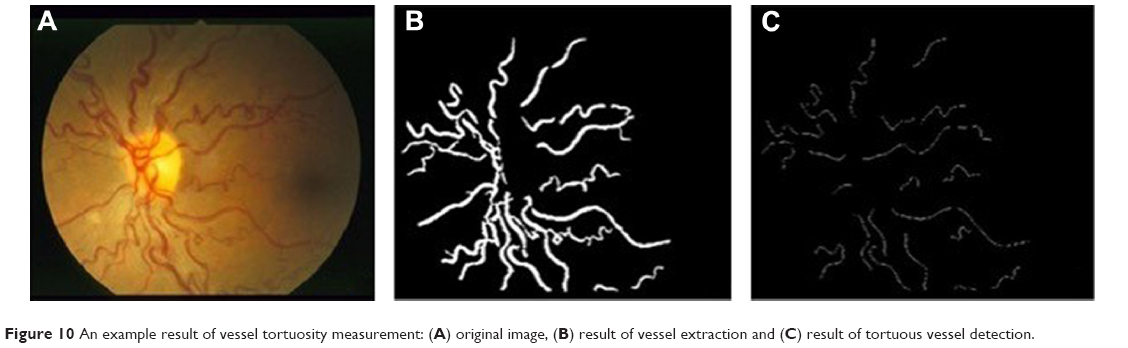 | Figure 10 An example result of vessel tortuosity measurement: (A) original image, (B) result of vessel extraction and (C) result of tortuous vessel detection. |
NV detection
Neovascularization elsewhere (NVE) and neovascularization of the disk (NVD) were detected by using tortuosity measurement. The patterns of tortuous vessels were usually “C” and “S” shapes.10 Using data obtained from the previous stage, each labeled vessel section was thinned using morphological thinning operation. The tortuosity was then measured by the difference between scalar and vector distances. The result is shown in Figure 11.
 | Figure 11 An example result of NVE and NVD detection: (A) original image, (B) result of vessel extraction and (C) result of NVE and NVD detection. |
Severity classification of DR
The severity of DR in this study was classified based on the pathologies of DR which were divided into three groups.
- Normal: there is no pathology of DR on fundus image.
- NPDR: with MAs/dot-blot HAs or FSHs or CWSs or HEs or venous beadings.
- PDR: with NV or PH or VH or FP.
Graphic user interface
The graphic user interface of the software is shown in Figure 12. The existing fundus images in the format of .jpg and .jpeg could be imported into the software for diagnosing. Moreover, a folder that contained a set of fundus images could also be selected in order to screen DR in one time as well. The directory box in the center showed the list of fundus images but the user could select a fundus image for screening if needed. The window showed the original fundus images and pointed out the significant feature of DR at the same time. The information of fundus images could be collected in the history table after the screening. The examples were the name of fundus image, the folder path, the date created, the screening date, the status of DR and so on. The software could be connected to Microsoft Excel® to export the data in the history table as the Excel file, and the fundus images could be grouped into sheets according to the severity classification of DR.
 | Figure 12 Graphic user interface of the software. |
Comparison with diagnosis by ophthalmologist
A total of 400 fundus photographs were initially diagnosed and classified based on the DR severity into three groups as no DR, NPDR and PDR by the ophthalmologist (TR). These fundus photographs were not the same as those used in the development of the software. The comparison between the automated software and ophthalmologist in detection of DR is shown in Table 1. The sensitivity and specificity of the automated software were 98% and 67%, respectively. The positive predictive value and negative predictive value were 98.15% and 63.64%, respectively. The accuracy of the automated software in detection of DR was 96.25%. Table 2 shows the comparison between this software and ophthalmologist in classifying no DR, NPDR and PDR. It was noted that the accuracy in classifying was 66.58%. The average time for processing one fundus image is 7 seconds.
 | Table 1 Comparison of the automated software and ophthalmologist in the detection of DR |
 | Table 2 Comparison of the automated software and ophthalmologist in classifying the severity of DR |
Discussion
In this study, the automated software for diagnosing DR from fundus photograph was developed by MATLAB program, and its accuracy in the detection of DR was 96.25%. The result is comparable to those of other algorithms using various digital image processing techniques,11,12 the artificial intelligent and deep learning methods.13–16 This finding indicates that the software can be used as a primary tool for DR screening in the remote area where ophthalmologist is not available. Moreover, it can help ophthalmologist in the rural area where there are many task overloads.
The strengths of the automated software developed by MATLAB program lie in its simplicity and reduction in cost. It can be operated independently and does not need web-based setting. It does not need plenty of resources and much time for learning as in the case of artificial intelligence and deep learning. Another strength of this software is at the preprocessing stage. Although fundus images in this study were obtained with various image qualities, for example, color, light and shadow, they were normalized in the preprocessing stage using image enhancement techniques to adjust image quality so that the regions of interest were suitable for further analysis. In addition, the software can process a group of fundus images at a time and generate a result report to the user.
Limitations
Although the software has many strengths and advantages, there are some limitations. The automated software in this study focused on the detection of only DR pathologies. The fundus photographs of the patients, however, may contain some lesions similar to the DR pathologies. Drusen and laser scar are examples. This caused an increase in the false positive result as the drusen or laser scar can be detected as HE or MA. The black edge of fundus image is also a problem in detection of HAs. This may have some effect on some fundus images when the black color is connected to PR or VH. This problem can be solved by a circle mask applied before the image processing methods.
Another limitation lies in the evaluation of the diagnostic accuracy. Most fundus photographs used in this study had DR (95%) and only 5% were normal fundus without DR. In the real world, however, only about 30%–50% of the diabetic patients have DR. Therefore, the accuracy rate and positive predictive rate may be exaggerated in this study. Although a high sensitivity is good for screening, a relative low specificity will result in more false positive cases in the real world than in this study. Nevertheless, these false positive cases will be advised to follow-up or see ophthalmologist for detailed evaluation. This is acceptable in the setting of mass screening.
In order to classify the severity level of DR, the software must provide the very high accuracy to classify the DR pathologies correctly. Although this software has good accuracy in detection of DR, it yields moderate accuracy in classifying the severity of DR. This may be attributed to the similarity of some lesions and difficulty in differentiation. In addition, the high difference in various image qualities is another problem. Once trying to adjust the suitable parameters in an image processing method for one lesion, it may have some effect on another lesion. Further software development was therefore required to improve the accuracy of DR classification in the future. Additional digital image processing techniques or other methods based on artificial intelligence17,18 and deep learning19 may be used to improve the image analysis algorithms.
Regarding the processing time, the coding was developed as a top-down programming in each step, which caused the processing to take time (about 7 seconds per fundus image). The algorithms could be adapted using the parallel program to further reduce this processing time.
Conclusion
The automated software for screening and diagnosing DR, by using the combination of digital image processing techniques, has been developed. This software yields the good accuracy for the detection of DR from fundus photographs. It can be used as an alternative or adjunctive tool for DR screening, especially in the remote area where ophthalmologist is not available or in the rural area where ophthalmologist has many task overloads. However, the software yields fair accuracy for classifying the severity of DR. Further software development was required to improve the accuracy of DR classification, which may include additional digital image processing techniques or other methods based on artificial intelligence and deep learning.
Acknowledgments
The authors thank Dr Kaewjai Thepsuthammarat, Clinical Epidemiology Unit, Faculty of Medicine, Khon Kaen University for statistical analysis. This study was supported by invitation research grant (I57131) from the Faculty of Medicine, Khon Kaen University.
Disclosure
The authors report no conflicts of interest in this work.
References
Lee R, Wong TY, Sabanayagam C. Epidemiology of diabetic retinopathy, diabetic macular edema and related vision loss. Eye Vis (Lond). 2015;2(17):1–25. doi:10.1186/s40662-015-0011-9 | ||
Yau JW, Rogers SL, Kawasaki R, et al. Global prevalence and major risk factors of diabetic retinopathy. Diabetes Care. 2012;35(3):556–564. doi:10.2337/dc11-1909 | ||
Poddar S, Kumajha B, Chrakaborty C. Quantitative clinical marker extraction from colour fundus images for non-proliferative diabetic retinopathy grading. ICIIP 2011 – Proceedings: 2011 International Conference on Image Information Processing 6108956;1–6. Shimla, Himachal Pradesh, India. | ||
Kaur J, Sinha HP. Automated localization of optic disc and macula from fundus Images. Int J Adv Res Comput Sci Softw Eng. 2012;2(4):242–249. | ||
Singh J, Sivaswamy J. Fundus Foveal Localization Based on Image Relative subtraction-IReS Approach. Hyderabad, India: International Institute of Information Technology; 2008:1–5. | ||
Mendonça A, Campilho A. Segmentation of retinal blood vessels by combining the detection of centerlines and morphological reconstruction. IEEE Trans Med Imaging. 2006;25(9):1200–1213. | ||
Venkatalakshmi B, Saravanan V, Niveditha GJ. Graphical user interface for enhanced retinal image analysis for diagnosing diabetic retinopathy. IEEE 3rd International Conference on Communication Software and Networks (ICCSN); 2011:610–613. Xi’an, China. | ||
Purwita AA, Adityowibowo K, Dameitry A, Atman MWS Automated microaneurysm detection using mathematical morphology. International Conference on Instrumentation, Communications, Information Technology, and Biomedical Engineering (ICICI-BME); 2011:117–120. doi:10.1007/s00228-010-0929-8 | ||
Haralick RM, Shapiro LG. Computer and robot vision. Boston: Addison-Wesley Longman Publishing Co., Inc; 1992. | ||
Satyarthi D, Raju BAN, Dandapat S. Detection of diabetic retinopathy in fundus images using vector quantization technique. Annual IEEE India Conference; 2006:1–4. New Delhi, India. | ||
Bhaskaranand M, Ramachandre C, Bhat S, et al. Automated diabetic retinopathy screening and monitoring using retinal fundus image analysis. J Diabetes Sci Technol. 2016;10:254–261. doi:10.1177/1932296816628546 | ||
Wang K, Jayadev C, Nittala MG, et al. Automated detection of diabetic retinopathy lesions on ultrawidefield pseudocolour images. Acta Ophthamol. 2018;96:e168–e173. doi:10.1111/aos.13528 | ||
Rajalakshmi R, Subashini R, Anjana RM, Mohan V. Automated diabetic retinopathy detection in smartphone-based fundus photography using artificial intelligence. Eye (Lond). 2018;32:1138–1144. doi:10.1038/s41433-018-0064-9 | ||
Ting DSW, Cheung CY, Lim G, et al. Development and validation of a deep learning system for diabetic retinopathy and related eye diseases using retinal images from multiethnic populations with diabetes. JAMA. 2017;318(22):2211–2223. doi:10.1001/jama.2017.18152 | ||
Tufail A, Kapetanakis VV, Salas-Vega S, et al. An observational study to assess if automated diabetic retinopathy image assessment software can replace one or more steps of manual imaging grading and to determine their cost-effectiveness. Health Technol Assess. 2016;20(92):1–72. doi:10.3310/hta20920 | ||
Tufail A, Rudisill C, Egan C, et al. Automated diabetic retinopathy image assessment software: diagnostic accuracy and cost-effectiveness compared with human graders. Ophthalmology. 2017;124:343–351. doi:10.1016/j.ophtha.2016.11.014 | ||
Schmidt-Erfurth U, Sadeghipour A, Gerendas BS, Waldstein SM, Bogunovic H. Artificial intelligence in retina. Prog Retin Eye Res. 2018;67:1–29. doi:10.1016/j.preteyeres.2018.07.004 | ||
Hogarty DT, Mackey DA, Hewitt AW. Current state and future prospects of artificial intelligence in ophthalmology: a review. Clin Exp Ophthalmol. 2018. doi:10.1111/ceo.13381 | ||
Grewal PS, Oloumi F, Rubin U, Tennant MTS. Deep learning in ophthalmology: a review. Can J Ophthalmol. 2018;53(4):309–313. doi:10.1016/j.jcjo.2018.04.019 |
 © 2019 The Author(s). This work is published and licensed by Dove Medical Press Limited. The
full terms of this license are available at https://www.dovepress.com/terms
and incorporate the Creative Commons Attribution
- Non Commercial (unported, 3.0) License.
By accessing the work you hereby accept the Terms. Non-commercial uses of the work are permitted
without any further permission from Dove Medical Press Limited, provided the work is properly
attributed. For permission for commercial use of this work, please see paragraphs 4.2 and 5 of our Terms.
© 2019 The Author(s). This work is published and licensed by Dove Medical Press Limited. The
full terms of this license are available at https://www.dovepress.com/terms
and incorporate the Creative Commons Attribution
- Non Commercial (unported, 3.0) License.
By accessing the work you hereby accept the Terms. Non-commercial uses of the work are permitted
without any further permission from Dove Medical Press Limited, provided the work is properly
attributed. For permission for commercial use of this work, please see paragraphs 4.2 and 5 of our Terms.