Back to Journals » OncoTargets and Therapy » Volume 9
Differentiation between adrenal adenomas and nonadenomas using dynamic contrast-enhanced computed tomography
Authors Wang XF, Li KG, Sun HR, Zhao JL, Zheng LF, Zhang ZL, Bai RJ, Zhang GX
Received 4 May 2016
Accepted for publication 20 September 2016
Published 3 November 2016 Volume 2016:9 Pages 6809—6817
DOI https://doi.org/10.2147/OTT.S112003
Checked for plagiarism Yes
Review by Single anonymous peer review
Peer reviewer comments 2
Editor who approved publication: Dr Min Li
Xifu Wang,1 Kangan Li,1 Haoran Sun,2 Jinglong Zhao,1 Linfeng Zheng,1 Zhuoli Zhang,3 Renju Bai,2 Guixiang Zhang1
1Department of Radiology, Shanghai General Hospital, Shanghai Jiao Tong University, Shanghai, 2Department of Radiology, Tianjin Medical University General Hospital, Tianjin, People’s Republic of China; 3Department of Radiology, Feinberg School of Medicine, Northwestern University, Chicago, IL, USA
Abstract: This study was performed to evaluate the findings including the time density curve (TD curve), the relative percentage of enhancement washout (Washr) and the absolute percentage of enhancement washout (Washa) at dynamic contrast-enhanced computed tomography (DCE-CT) in 70 patients with 79 adrenal masses (including 44 adenomas and 35 nonadenomas) confirmed histopathologically and/or clinically. The results demonstrated that the TD curves of adrenal masses were classified into 5 types, and the type distribution of the TD curves was significantly different between adenomas and nonadenomas. Types A and C were characteristic of adenomas, whereas types B, D and E were features of nonadenomas. The sensitivity, specificity and accuracy for the diagnosis of adenoma based on the TD curves were 93%, 80% and 87%, respectively. Furthermore, when myelolipomas were excluded, the specificity and accuracy for adenoma were 90% and 92%, respectively. The Washr and the Washa values for the adenomas were higher than those for the nonadenomas. The diagnostic efficiency for adenoma was highest at 7-min delay time at DCE-CT; Washr was more efficient than Washa. Washr ≥34% and Washa ≥43% were both suggestive of adenomas and, on the contrary, suspicious of nonadenomas. The sensitivity, specificity and accuracy for the diagnosis of adenoma were 84%, 77% and 81%, respectively. When myelolipomas were precluded, the diagnostic specificity and accuracy were 87% and 85%, respectively. Therefore, DCE-CT aids in characterization of adrenal tumors, especially for lipid-poor adenomas which can be correctly categorized on the basis of TD curve combined with the percentage of enhancement washout.
Keywords: adrenal adenomas, adrenal nonadenomas, dynamic contrast-enhanced CT, enhancement pattern
Introduction
The detection of adrenal lesions has increased with the growing use of cross-sectional imaging. Adrenal masses are incidentally detected at routine computed tomography (CT) in approximately 5% of cases.1 This incidence increases to 9%–13% in patients imaged for a known malignancy,2,3 but only 26%–36% of such adrenal lesions are metastatic.3,4 Adequate characterization of adrenal lesions is crucial for patient care. With regard to X-ray, positron emission tomography (PET) and magnetic resonance imaging (MRI), X-ray test is limited to examining calcification of the adrenal glands. However, if an adrenal gland is not fully calcified and the kidney is not well defined, then it can be difficult to describe the adrenal glands for more details. PET is a useful imaging technique in characterizing adrenal masses.5 Nevertheless, false-positive interpretations may result from benign lesions,5 and thus PET is mostly used in patients with known cancer and not recommended in patients without a known malignancy. MRI has rapidly become a leading research tool in characterization of adrenal masses. The advantages of MRI include being free from ionizing radiation, multiple planar imaging, lower toxicity of gadolinium, etc. Unfortunately, MRI has many limitations such as, higher cost, longer exam duration, limited availability, practical difficulties of scanning with intensive care unit equipment, and is not ideal for claustophobic patients or patients with metal implants, and so on. At present, CT scanning is still most widely available; it is actually more popular in clinics because it is fast, painless, noninvasive and accurate, although in research patients it has been shown to have side effects and can cause adverse and allergic reactions. Many reports have demonstrated that delayed CT has been useful in characterizing adrenal masses.6–17 To date, much research interest has focused on using the findings in dynamic contrast-enhanced CT (DCE-CT) to accurately characterize adrenal adenomas and nonadenomas. Therefore, the purpose of our study was to evaluate the appearances of DCE-CT in a cohort of 70 patients with adrenal masses, so that DCE-CT can be used for the characterization of adenomas, particularly for distinguishing lipid-poor adenomas from nonadenomas.
Materials and methods
Study population
This study was approved by the Institutional Review Board of Tianjin Medical University General Hospital, and all patients gave written informed consent. The patient population with adrenal lesions consisted of 22 men and 48 women with a mean age of 50 years and an age range of 9–82 years. Forty adrenal masses involved the left adrenal gland, 39 the right. Nine of the 70 patients had bilateral masses. Seventy-nine consecutive adrenal masses were evaluated using a dedicated adrenal CT imaging protocol. The average maximal diameter of the adrenal masses was 3.4 cm (range 0.8–10.3 cm). Sample sizes and mass sizes according to different age groups are described in Table 1. Among these adrenal masses, a definitive diagnosis was established in 64 masses when histological proof was obtained upon surgery. The diagnosis of adrenal metastases in 10 masses was based on substantial growth at the 3-month CT follow-up in 5 patients with known extra-adrenal primary malignancies. The final clinical diagnosis of the remaining 5 myelolipomas without any clinical symptoms was based on a large amount of visible fatty components (≤−30 HU) in the CT images and a stable appearance or size change on a subsequent CT scan with a minimum of 6 months follow-up. Thus, the definite diagnosis of 79 adrenal masses confirmed on the basis of surgery, histopathology and clinical information included both adrenal adenomas (n=44) and nonadenomas (n=35). The nonadenomas were as follows: pheochromocytomas (n=12), metastases (n=13), neurogenic tumors (n=4), cortical carcinoma (n=1) and myelolipomas (n=5).
 | Table 1 Sample sizes, mass sizes, male/female and TD curve according to different age groups |
Imaging protocol
DCE-CT scans were obtained using a Hispeed CT/i scanner (GE Healthcare, Milwaukee, WI, USA). Helical scans were performed before and after intravenous (IV) administration of contrast material. The dedicated adrenal protocol consisted of volumetric data acquisition through the adrenal glands with the patient in the supine position. The technique parameters included 3- or 5-mm collimation, 1:1 pitch, 120 kVp and 220 mA. Each scan (acquisition time, 18–24 sec) was obtained from patients at full inspiration to ensure the reproducibility of measurements.
Initially, a noncontrast-enhanced CT scan was obtained as a baseline scan through the adrenal glands in each individual patient. Subsequently, DCE-CT scans with the largest diameters of 3 consecutive sections were performed after an IV initiation of 100–120 mL of Ultravist 370 (Bayer Schering Pharma, Berlin, Germany) or Omnipaque 350 (Nycomed/GE Healthcare), depending on the patient size. IV contrast material was injected using a power injector (MCT Plus, Medrad, Stellant, Pittsburgh, PA, USA) at a rate of 2.5 mL/sec. The imaging parameters for each phase were the same contiguous collimation, table feed and duration as the initial scan. The delay time at DCE-CT was 30 sec and 1, 2, 3, 5 and 7 min after administration of contrast material from the clock time on the images. Scans were obtained using standard soft-tissue window settings. The CT scanner was calibrated using a water phantom every day to ensure precise attenuation measurement.
Image and data analysis
Image assessment of the DCE-CT scans of the adrenal gland was retrospectively performed by 2 experienced radiologists in CT who were blinded to the final diagnosis of the lesions and worked independently (without consultation). The transverse maximal section of the adrenal mass was selected. A circular or ovoid region of interest (ROI) was placed centrally over the adrenal gland, covering one-half to two-thirds of the area of the adrenal mass, avoiding the edges to reduce the partial volume effect. The minimum surface area of the ROI was 4–16 mm2.9 Additionally, necrotic, cystic, calcified or hemorrhagic components of adrenal masses were excluded from the ROI measurement. Each mass was measured at least twice using a cursor of the same size and configuration placed at similar locations in the mass. The average measurements of the CT attenuation value in adrenal masses obtained by the 2 radiologists were further calculated.
The same radiologist documented the average attenuation value and then calculated the Washr value for all the adrenal lesions using the following equation:6,10,14,16,17 Washr = [Dmax − Dpost]/Dmax ×100%. The Washa value was also obtained using the following equation: Washa = [(Dmax − Dpre) − (Dpost − Dpre)]/(Dmax − Dpre) ×100%. Dmax was the enhancement peak of CT attenuation value in the adrenal masses following the administration of contrast material. Dpost was the CT attenuation value at different delay times after the enhancement peak of the mass. Dpre was the unenhanced CT attenuation value of the adrenal masses.
Statistical analysis
From the data obtained, we calculated the percentage of enhancement washout at each delay time. The measurement data mentioned earlier between groups were analyzed using a 2-sample average t-test. If a nonnormal distribution was present and remained after numeric conversion, the Mann–Whitney rank sum application test was used. The counting data, including the types of TD curves and VEGF expression between the groups, were analyzed using the Pearson χ2 test. A P-value of <0.05 was considered statistically significant. For the DCE-CT data set, the sensitivity, specificity, accuracy, positive predictive value and negative predictive value for the diagnosis of adrenal adenoma were also calculated.
In addition, using the CT attenuation values, we also generated receiver operating characteristic (ROC) curves to assess the efficiency of the percentage of enhancement washout at each delay time to differentiate adrenal adenomas from nonadenomas. The areas under the ROC curves were then analyzed to compare the differences.
Results
The TD curves on DCE-CT in adrenal masses
The TD curves were generated based on the absolute CT attenuation value at each delay time. The TD curves of the masses were classified into the following 5 types according to the tendency of the change in CT attenuation value before and after the initiation of contrast material (Figure 1). Type A represents a rapidly rising slope (wash-in) during the early phase (≤1 min), followed by a rapid washout phase after the peak enhancement; type B represents a rapid rise during the early phase (≤1 min), followed by a smooth decay or plateau in the latter portion; type C represents a slowly rising slope during the early phase (≥2 min), followed by rapid washout phases after the peak enhancement; type D represents a slowly rising slope during the early phase (≥2 min), followed by a smooth decay or plateau in the latter portion, and type E represents a slow and gradual rise throughout the scan period.
 | Figure 1 Tendency of TD curves on DCE-CT scan in adrenal masses. |
The types of TD curves for adrenal masses included (Figure 1): type A (n=44), type B (n=21), type C (n=5), type D (n=7) and type E (n=2). Types of TD curves according to different sex and age groups are shown in Table 1. Type A and type C both exhibited rapid contrast washout after enhancement peak, whereas type B, type D and type E all tended to washout more slowly. For the TD curves in 44 adrenal adenomas, type A was predominantly found in 37 (84%) of 44 adenomas, type C in 4 (9%), type B in 2 (4.5%), type D in 1 (2.3%) and none in type E. Regarding the TD curve in 35 adrenal nonadenomas, all the types of TD curves are present, including type A in 7 of 35 nonadenomas, type B in 19, type C in 1, type D in 6 and type E in 2. Types B, D and E accounted for 27 (77%) of 35 nonadenomas. The type distribution of TD curves was significantly different between adrenal adenomas and nonadenomas (χ2=40.93, P=0.000) (Figures 2–4). Therefore, the sensitivity for the diagnosis of adenoma on the basis of TD curves was 93%; the specificity was 80% and the accuracy was 87%. When myelolipomas that were easily diagnosed based on large amounts of fat within the mass were excluded, the sensitivity for the diagnosis of adenoma using the TD curve was 93%, the specificity was 90% and the accuracy was 92%.
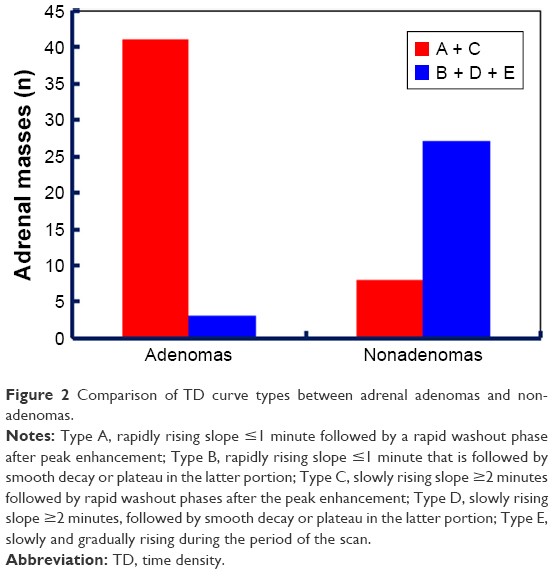 | Figure 2 Comparison of TD curve types between adrenal adenomas and nonadenomas. |
 | Figure 3 Left adrenal adenoma. |
 | Figure 4 Right adrenal pheochromocytoma. |
The percentage of enhancement washout on DCE-CT
There were significant differences in the Washr values at 3-, 5- and 7-min delay times between adrenal adenomas and nonadenomas (P≤0.001). The Washr value for adrenal adenomas was much faster than for nonadenomas (Table 2; Figures 3 and 4). For the percentage of enhancement washout at each delay time mentioned earlier, these ROC curves were all higher and to the left of the initial curve (P<0.005) (Figure 5). However, the area under the 7-min delay curve was highest, presented as the largest diagnostic value (Table 3); correspondingly, the Washr threshold for the diagnosis of adenoma is 34%. That is, a Washr value of 34% or more at a 7-min delay time was suggestive of adrenal adenomas, whereas other values suggested nonadenomas. At the Washr threshold of 34%, the sensitivity, specificity and accuracy for the diagnosis of adrenal adenomas were 84%, 77% and 81%, respectively. Furthermore, because adrenal myelolipomas were easily diagnosed based on CT findings, the diagnostic efficiency of the Washr value for adrenal adenomas increased to some extent when myelolipomas were excluded from this study. The diagnostic specificity and accuracy were 87% and 85%, respectively.
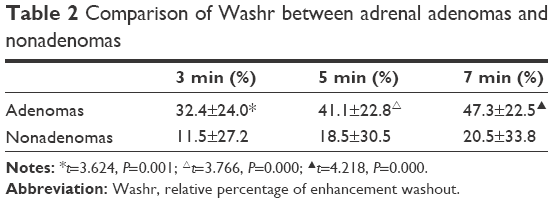 | Table 2 Comparison of Washr between adrenal adenomas and nonadenomas |
 | Figure 5 ROC curves of Washr at 3-, 5- and 7-min delay times. |
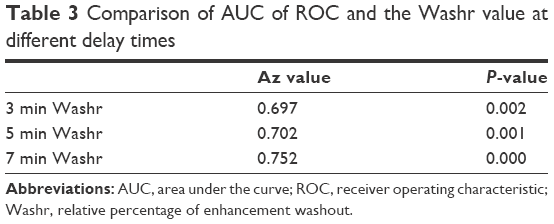 | Table 3 Comparison of AUC of ROC and the Washr value at different delay times |
There were significant differences in the Washa value at the 3-, 5- and 7-min delay times between adrenal adenomas and nonadenomas (P=0.001) (Figures 3 and 4; Table 4). The Washa value for adrenal adenomas was much faster than for nonadenomas. In comparison, the diagnostic threshold of the Washa value at the 7-min delay time for adrenal adenomas was 43% based on the analysis of the ROC curve (Table 5; Figure 6). A Washa value ≥43 HU was suggestive of adrenal adenomas, while other values suggested nonadenomas. Similarly, the diagnostic efficiency of Washa for adrenal adenomas improved to some extent when myelolipomas were not included in this study.
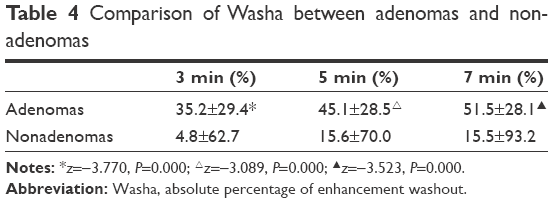 | Table 4 Comparison of Washa between adenomas and nonadenomas |
 | Table 5 ROC comparison of AUC and Washa values at different delay times |
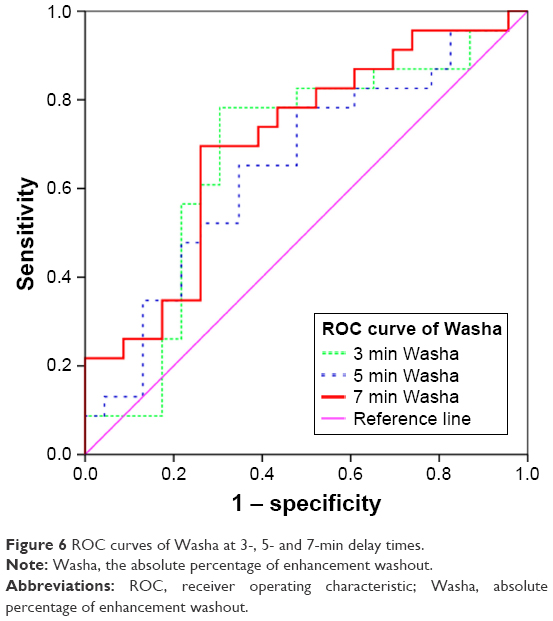 | Figure 6 ROC curves of Washa at 3-, 5- and 7-min delay times. |
Discussion
Many studies have confirmed the usefulness of attenuation measurement on unenhanced and delayed contrast-enhanced CT scan in the differentiation of adenomas from nonadenomas.7,10,18,19 All lesions of 10 HU or less on unenhanced CT images are lipid-rich adenomas.7 However, unenhanced CT attenuation could not be used to sufficiently differentiate adenomas from nonadenomas. The delayed contrast-enhanced CT values is accurate to help differentiate lipid-rich adenomas,10 but it shows too much overlap between the groups to allow an accurate differentiation. Lipid-poor adenomas have an attenuation of >10 noncontrast HU and can be further characterized by their contrast enhancement and wash out patterns.7,15–17,20–22 Compared to CT scanning, early dynamic MRI aids in the characterization of adrenal tumors;23 dynamic, contrast-enhanced MRI can accurately differentiate lipid-poor adrenal adenomas from nonadenomas.23–25 Nevertheless, widespread use of MRI is limited due to the abovementioned disadvantages of MRI. In this study, hence, our results demonstrate that DCE-CT is very useful for the differentiation of adenomas, in particular lipid-poor adenomas, from nonadenomas, which are in accordance with previous reports.
The comparison of TD curves on DCE-CT between adenomas and nonadenomas
Although several previous researchers have reported the contrast enhancement curves of adrenal adenomas and nonadenomas,15–17,26 to our knowledge, the characterization of adrenal mass directly using TD curve has not yet been published. In our study, TD curve did not need to be graded quantitatively with quantitative indicators, such as the enhancement rate after the injection of contrast material, but can be directly obtained on the basis of the absolute CT attenuation value at each delay time.
The types of TD curves for the adenomas were type A (n=37), type B (n=2), type C (n=4) and type D (n=1). The TD curves of DCE-CT in adrenal adenomas were characterized by types A and C, accounting for 93%. Although there were different wash-in rates before peak enhancement in the DCE-CT scans between type A and type C, the latter portions after peak time both turned significantly downward. Our results suggested that the CT attenuation value of adrenal masses decreased rapidly after peak enhancement at DCE-CT, which reflected the rapid washout of the contrast material. Types B and D curves accounted for only 7% of the DCE-CT scans in adrenal adenomas. There are some exceptions to the characteristics of TD curve in adenomas, 2 adenomas are of type B in males (age group, 19–40 years old), and the remaining one is of type D in a female (age group, 41–60 years old). In this situation, not only tumor size but extension, configuration, invasiveness and blood tests should also be considered for their characterization in clinics. None is of type E in this subgroup of adenomas. Thus, once type E of the TD curve for adrenal masses has appeared, adrenal adenomas should be ruled out.
Regarding nonadenomas, all 5 types of TD curves were demonstrated. Nevertheless, types B (n=19), D (n=6) and E (n=2) were characteristic, accounting for 77%. The latter portions of the TD curves for nonadenomas demonstrated a smooth decay or platform after the peak enhancement or a slow and continuous increase throughout the exam duration. The results indicated that the contrast material had slow washout and even progressive wash-in in the DCE-CT scans in nonadenomas. In addition, type A (n=7) and type C (n=1) were also found in the remaining nonadenomas, there was very little overlap between adrenal adenomas and nonadenomas. A total of 7 type A TD curves included 4 myelolipomas, 1 metastasis, 2 pheochromocytomas; type C was of 1 metastasis. As we all know, myelolipoma is usually not difficult to diagnose with a great amount of fat-containing components (type A =4 and type B =1). Additionally, these results suggested that type E of the TD curve was unique to the neurogenic tumor, which was characterized by very slow and continuously increasing enhancement (wash-in) over the scanning period, as it was not present in any other nonadenomas in our study.
There is a significant difference in these TD curve types between adenomas and nonadenomas, anyway. Types A and C are characteristics of adrenal adenomas, whereas types B, D and E are features of nonadenomas. In the light of the diagnostic criteria of TD curves, the sensitivity for adrenal adenomas was 93%, the specificity was 80% and the accuracy was 87%. If myelolipomas, easier to diagnose, are not included in this study group, the diagnostic sensitivity of TD curves for adrenal adenomas was 93%, the specificity was 90% and the accuracy was 92%. In contrast, the specificity and the accuracy for the diagnosis of adenomas are significantly improved.
In a word, TD curve is effective in distinguishing adenomas from nonadenomas. Furthermore, TD curves are generated simply and without complicated and time-consuming calculations, and can be illustrated briefly and visually at the same time.
The comparison of enhancement washout on DCE-CT between adenomas and nonadenomas
Many previous results have confirmed that it is highly valuable to differentiate adenomas from nonadenomas based on the percentage of enhancement washout after peak enhancement on DCE-CT scans.13,22,27 Although the validity of these parameters by using 5-, 10- and 15-min DCE-CT has been demonstrated, shorter delay time in the DCE-CT scans to facilitate the differentiation of these lesions would be desirable. In this study, the finding was in concordance with those of previous reports. According to the assessment of ROC curves for the diagnostic value of different delay times, the Washr and the Washa values at the 7-min delay time in DCE-CT scans are more helpful for the diagnosis of adrenal adenomas. The diagnostic sensitivity, specificity and accuracy for adrenal adenomas using Washr and Washa were 84%, 77% and 81% and 82%, 57% and 71%; respectively. Furthermore, when adrenal myelolipomas were excluded from this study group, the sensitivity, specificity and accuracy for the diagnosis of adrenal adenomas were 84%, 87% and 85% and 82%, 67% and 76%, respectively. The results demonstrated that the diagnostic specificity and accuracy for adrenal adenomas can thus be significantly increased.
Furthermore, Washr was more diagnostically accurate than Washa for diagnosing adrenal lesions. In this study, the diagnostic abilities of the Washr value at the 7-min delay time on DCE-CT scans for adrenal adenomas are better than the abilities of Washa, which is consistent with previous study.15 In fact, the Washr is an approximation of the Washa and was initially described as an alternative calculation, especially when an unenhanced CT was not obtained. Washr is identical to Washa only for adrenal adenomas with an attenuation of 0 HU at unenhanced CT, whereas Washa can reflect the true enhancement washout value. Therefore, Washr tends to overestimate the true enhancement washout value and, in contrast, underestimate the value for nonadenomas. We speculate that this behavior is why the Washr value shows very little overlap between adenomas and nonadenomas: the overall effect on differentiation between the 2 groups was substantial. The results of our study show that the sensitivity, specificity and accuracy for the diagnosis of adrenal adenomas were more optimal for Washr than for Washa. Furthermore, the Washr value can be obtained even when the unenhanced CT attenuation value is not obtained, and thus the calculation of the Washr for DCE-CT scans may lead to a highly useful test enabling the characterization of adrenal adenomas, obviating the requirement for an additional examination on a subsequent day, circumventing the additional medical expense, ignoring the unenhanced CT attenuation value and calculating the Washr value simply.
The CT features on DCE-CT in adrenal lipid-poor adenomas
As is well known, the lipid-poor adrenal adenomas that are now discovered accidentally remain indeterminate due to insufficient fat concentrations, because of their relatively high attenuation (>10 HU) on unenhanced CT.28 In general, lipid-poor adenomas account for as many as 30% of adrenal adenomas. Fortunately, several studies demonstrated that lipid-poor adenoma could be diagnosed using Washr and Washa.6,10,14,16,17,22 In this present study group, 17 (39%) of the 44 adrenal adenomas were proven by means of histopathology to be lipid-poor adenomas with attenuation >10 HU at unenhanced CT, all unilateral and accounted for 20% (17/79) of the entire group of adrenal masses. The results of our study demonstrated that the enhancement features of DCE-CT for lipid-poor adrenal adenomas are nearly identical to the enhancement features of lipid-rich adenomas and significantly greater than the enhancement features of nonadenomas. The types of TD curves in the 17 lipid-poor adenomas included type A (n=14), type B (n=2) and type D (n=1). All of the lipid-poor adenomas with type A showed the typical rapid enhancement washout, and the Washr and Washa values at the 7-min delay time in the DCE-CT scans were ≥34% and ≥43%, respectively; nevertheless, 3 of the 17 lipid-poor adenomas remained indeterminate because of the curves type B (n=2) and type D (n=1).
The evaluation of diagnostic performance on DCE-CT in adrenal masses
In this study, the results also show that DCE-CT is very useful for the diagnosis of adrenal masses. In particular, TD curves may continuously and directly demonstrate the different features between adrenal adenomas and nonadenomas. Unlike Washr and Washa, the TD curves may avoid changing in tendency when the measurement of the CT attenuation value for adrenal masses at one delay time is obtained incorrectly and can still continue to document the characterization of wash-in and washout after initiation of the IV injection of the contrast bolus. Therefore, the diagnostic value of the TD curve is unique for the diagnosis of adrenal masses, and the ability to differentiate between adrenal adenomas and nonadenomas using the TD curve is more optimal than using the Washr and Washa values in DCE-CT. In contrast, Washr and Washa are sometimes not calculated accurately due to an incorrect measurement of the CT attenuation value caused by various factors at certain delay times, and thus, this analysis will directly determine whether a correct and real-time diagnosis of adrenal adenomas may be made. Because an incorrect diagnosis of adrenal adenomas using Washr and Washa is relatively easy to make, the diagnostic ability of the percentage of enhancement washout for adrenal adenomas is accordingly not as good as for the TD curves. However, none of the diagnostic indicators or modalities could absolutely make a precise diagnosis of the adrenal adenomas, as at times 1 parameter is atypical for certain adrenal mass, while the other is typical.
Our study had several limitations. First, the diagnosis of adrenal metastases was not histologically verified in several patients. The growth of mass within 6 months follow-up was used to confirm metastases. Second, although the number of adrenal nonadenomas was small in this study, the number of metastases was relatively small, particularly there is only 1 adrenal cortical carcinoma in the group, compared with that of adenomas. So more patients will be required for the study. Third, there seems to be a little bit more in terms of radiation exposure for TD curves. However, radiation dose should be reduced greatly with the development of CT technology and the optimization of scanning parameters. Finally, this study was completed only in our own hospital; a multicenter study is necessary to establish the undisputed value of DCE-CT for distinguishing the adenomas from nonadenomas.
Conclusion
The TD curve is most optimal for the diagnosis of adrenal adenomas, followed by Washr and then Washa. Nevertheless, the following protocol for a more accurate diagnosis of adrenal adenomas should be recommended: first, simple and visual TD curves are used clinically combined with the percentage of enhancement washout if necessary, and the diagnoses based on the TD curves and the percentage of enhancement washout can be used to verify and complement each other to ultimately improve diagnostic accuracy with high confidence.
Acknowledgments
We would like to thank Dr Wenhong Wang (Department of Imaging, Tianjin People’s Hospital, Tianjin, People’s Republic of China) for her help in the collection of patients and thank the following 3 grant supports: 1) Shanghai Pujiang Talent Program (14PJD028); 2) Biomedical Engineering Cross Fund of Shanghai Jiao Tong University (YG2015MS31); 3) Medical Education Research of Shanghai Jiao Tong University School of Medicine (YB150606).
Disclosure
The authors report no conflicts of interest in this work.
References
Song JH, Chaudhry FS, Mayo-Smith WW. The incidental adrenal mass on CT: prevalence of adrenal disease in 1,049 consecutive adrenal masses in patients with no known malignancy. AJR Am J Roentgenol. 2008;190(5):1163–1168. | ||
Blake MA, Cronin CG, Boland GW. Adrenal imaging. AJR Am J Roentgenol. 2010;194(6):1450–1460. | ||
Bovio S, Cataldi A, Reimondo G, et al. Prevalence of adrenal incidentaloma in a contemporary computerized tomography series. J Endocrinol Invest. 2006;29(4):298–302. | ||
Oliver TW Jr, Bernardino ME, Miller JI, Mansour K, Greene D, Davis WA. Isolated adrenal masses in nonsmall-cell bronchogenic carcinoma. Radiology. 1984;153(1):217–218. | ||
Blake MA, Prakash P, Cronin CG. PET/CT for adrenal assessment. AJR Am J Roentgenol. 2010;195(2):W91–W95. | ||
Koo HJ, Choi HJ, Kim HJ, Kim SO, Cho KS. The value of 15-minute delayed contrast-enhanced CT to differentiate hyperattenuating adrenal masses compared with chemical shift MR imaging. Eur Radiol. 2014;24(6):1410–1420. | ||
Kumagae Y, Fukukura Y, Takumi K, et al. Distinguishing adrenal adenomas from non-adenomas on dynamic enhanced CT: a comparison of 5 and 10 min delays after intravenous contrast medium injection. Clin Radiol. 2013;68(7):696–703. | ||
Boland GW, Hahn PF, Pena C, Mueller PR. Adrenal masses: characterization with delayed contrast-enhanced CT. Radiology. 1997;202(3):693–696. | ||
Szolar DH, Kammerhuber F. Quantitative CT evaluation of adrenal gland masses: a step forward in the differentiation between adenomas and nonadenomas? Radiology. 1997;202(2):517–521. | ||
Kamiyama T, Fukukura Y, Yoneyama T, Takumi K, Nakajo M. Distinguishing adrenal adenomas from nonadenomas: combined use of diagnostic parameters of unenhanced and short 5-minute dynamic enhanced CT protocol. Radiology. 2009;250(2):474–481. | ||
Blake MA, Kalra MK, Sweeney AT, et al. Distinguishing benign from malignant adrenal masses: multi-detector row CT protocol with 10-minute delay. Radiology. 2006;238(2):578–585. | ||
Sangwaiya MJ, Boland GW, Cronin CG, Blake MA, Halpern EF, Hahn PF. Incidental adrenal lesions: accuracy of characterization with contrast-enhanced washout multidetector CT – 10-minute delayed imaging protocol revisited in a large patient cohort. Radiology. 2010;256(2):504–510. | ||
Caoili EM, Korobkin M, Francis IR, Cohan RH, Dunnick NR. Delayed enhanced CT of lipid-poor adrenal adenomas. AJR Am J Roentgenol. 2000;175(5):1411–1415. | ||
Caoili EM, Korobkin M, Francis IR, et al. Adrenal masses: characterization with combined unenhanced and delayed enhanced CT. Radiology. 2002;222(3):629–633. | ||
Korobkin M, Brodeur FJ, Francis IR, Quint LE, Dunnick NR, Londy F. CT time-attenuation washout curves of adrenal adenomas and nonadenomas. AJR Am J Roentgenol. 1998;170(3):747–752. | ||
Szolar DH, Kammerhuber FH. Adrenal adenomas and nonadenomas: assessment of washout at delayed contrast-enhanced CT. Radiology. 1998;207(2):369–375. | ||
Pena CS, Boland GW, Hahn PF, Lee MJ, Mueller PR. Characterization of indeterminate (lipid-poor) adrenal masses: use of washout characteristics at contrast-enhanced CT. Radiology. 2000;217(3):798–802. | ||
Halefoglu AM, Bas N, Yasar A, Basak M. Differentiation of adrenal adenomas from nonadenomas using CT histogram analysis method: a prospective study. Eur J Radiol. 2010;73(3):643–651. | ||
Korobkin M, Brodeur FJ, Yutzy GG, et al. Differentiation of adrenal adenomas from nonadenomas using CT attenuation values. AJR Am J Roentgenol. 1996;166(3):531–536. | ||
Korivi BR, Elsayes KM. Cross-sectional imaging work-up of adrenal masses. World J Radiol. 2013;5(3):88. | ||
Park SW, Kim TN, Yoon JH, et al. The washout rate on the delayed CT image as a diagnostic tool for adrenal adenoma verified by pathology: a multicenter study. Int Urol Nephrol. 2012;44(5):1397–1402. | ||
Kebapci M, Kaya T, Gurbuz E, Adapinar B, Kebapci N, Demirustu C. Differentiation of adrenal adenomas (lipid rich and lipid poor) from nonadenomas by use of washout characteristics on delayed enhanced CT. Abdom Imaging. 2003;28(5):709–715. | ||
Rodacki K, Ramalho M, Dale BM, et al. Combined chemical shift imaging with early dynamic serial gadolinium-enhanced MRI in the characterization of adrenal lesions. AJR Am J Roentgenol. 2014;203(1):99–106. | ||
Inan N, Arslan A, Akansel G, Anik Y, Balci NC, Demirci A. Dynamic contrast enhanced MRI in the differential diagnosis of adrenal adenomas and malignant adrenal masses. Eur J Radiol. 2008;65(1):154–162. | ||
Becker-Weidman D, Kalb B, Mittal PK, et al. Differentiation of lipid-poor adrenal adenomas from non-adenomas with magnetic resonance imaging: utility of dynamic, contrast enhancement and single-shot T2-weighted sequences. Eur J Radiol. 2015;84(11):2045–2051. | ||
Lee MJ, Hahn PF, Papanicolaou N, et al. Benign and malignant adrenal masses: CT distinction with attenuation coefficients, size, and observer analysis. Radiology. 1991;179(2):415–418. | ||
Korobkin M, Brodeur FJ, Francis IR, Quint LE, Dunnick NR, Goodsitt M. Delayed enhanced CT for differentiation of benign from malignant adrenal masses. Radiology. 1996;200(3):737–742. | ||
Boland GW, Lee MJ, Gazelle GS, Halpern EF, McNicholas MM, Mueller PR. Characterization of adrenal masses using unenhanced CT: an analysis of the CT literature. AJR Am J Roentgenol. 1998;171(1):201–204. |
 © 2016 The Author(s). This work is published and licensed by Dove Medical Press Limited. The
full terms of this license are available at https://www.dovepress.com/terms
and incorporate the Creative Commons Attribution
- Non Commercial (unported, 3.0) License.
By accessing the work you hereby accept the Terms. Non-commercial uses of the work are permitted
without any further permission from Dove Medical Press Limited, provided the work is properly
attributed. For permission for commercial use of this work, please see paragraphs 4.2 and 5 of our Terms.
© 2016 The Author(s). This work is published and licensed by Dove Medical Press Limited. The
full terms of this license are available at https://www.dovepress.com/terms
and incorporate the Creative Commons Attribution
- Non Commercial (unported, 3.0) License.
By accessing the work you hereby accept the Terms. Non-commercial uses of the work are permitted
without any further permission from Dove Medical Press Limited, provided the work is properly
attributed. For permission for commercial use of this work, please see paragraphs 4.2 and 5 of our Terms.