Back to Journals » Infection and Drug Resistance » Volume 14
Differentiating Between an Atypical Hepatic Abscess and Tumor Metastasis Using Magnetic Resonance Imaging and Hepatobiliary Phase Imaging
Authors Zhuo LY, Xing LH, Ma X, Zhang Y, Ma ZP, Yin XP, Wang JN
Received 30 April 2021
Accepted for publication 20 July 2021
Published 17 August 2021 Volume 2021:14 Pages 3263—3274
DOI https://doi.org/10.2147/IDR.S318291
Checked for plagiarism Yes
Review by Single anonymous peer review
Peer reviewer comments 4
Editor who approved publication: Prof. Dr. Héctor Mora-Montes
Li-Yong Zhuo,* Li-Hong Xing,* Xi Ma, Yu Zhang, Ze-Peng Ma, Xiao-Ping Yin, Jia-Ning Wang
Department of CT-MRI Diagnostic, Affiliated Hospital of Hebei University, Baoding, People’s Republic of China
*These authors contributed equally to this work
Correspondence: Xiao-Ping Yin; Jia-Ning Wang
Department of CT-MRI Diagnostic, Affiliated Hospital of Hebei University, 212 Eastern Yuhua Road, Baoding City, Hebei Province, 071000, People’s Republic of China
Tel +8613103128133
; +8618233289724
Email [email protected]; [email protected]
Objective: To identify diffusion-weighted imaging (DWI) patterns and conspicuity discrepancies on hepatobiliary phase imaging (HBPI) to distinguish atypical hepatic abscesses from hepatic metastases.
Materials and Methods: This retrospective study recruited 31 patients with 43 atypical hepatic abscesses and 32 patients with 35 hepatic metastases who underwent gadobenate dimeglumine-enhanced magnetic resonance imaging. All lesions were confirmed by pathological or clinical diagnosis. For the qualitative and quantitative analyses, the signal intensity, DWI pattern, apparent diffusion coefficient, degree of perilesional edema, perilesional hyperemia, perilesional signal on HBPI, conspicuity, size discrepancy between sequences, contrast-to-noise ratio, signal-to-noise ratio, and relative enhancement ratio on dynamic phases were independently assessed by two radiologists. Significant findings for differentiating the two groups were identified via univariate and multivariate analyses with a nomogram for predicting atypical hepatic abscesses. The interobserver agreement was also analyzed for each variable.
Results: The multivariate analysis revealed that the conspicuity discrepancy (odds ratio [OR] 34.78, 95% confidence interval [CI] 2.09– 579.47, p = 0.013) and non-peripheral high signal intensity (SI) rim on DWI (OR 67.46, 95% CI 2.64, 1723.20, p = 0.011) were significant independent factors for predicting atypical hepatic abscesses. They were also shown to be high predictor points on the nomogram. When any of the set criteria were satisfied, 97.7% of atypical hepatic abscesses were correctly identified, with a specificity of 65.7%. When both criteria were combined, the specificity was up to 100%, with a sensitivity of 44.9%.
Conclusion: Conspicuity discrepancy and a non-peripheral high SI rim on DWI are reliable and meaningful features that can distinguish atypical hepatic abscesses from hepatic metastases.
Keywords: liver, MRI, abscess, metastasis, hepatocyte-specific contrast
Introduction
A hepatic abscess is defined as a localized collection of necrotic inflammatory tissue in the hepatic parenchyma caused by an infection. The imaging features of a hepatic abscess include a “cluster sign,” a “double-target sign,” or gas in the center of the lesion on computed tomography (CT) and magnetic resonance imaging (MRI).1–3 Clinical manifestations such as rigor, high fever, or severe abdominal pain can also help diagnose hepatic abscesses.4
There is a growing body of literature establishing the classic radiological findings of hepatic abscesses, ie, four-layered enhancement (a central localized collection of pus, an inner granulation layer, an outer collagenous layer, and peripheral compensatory hyperemia). However, the imaging manifestations of hepatic abscesses can vary with the degree of maturation. Sometimes, patients have no typical symptoms (ie, an atypical hepatic abscess) and only vague abdominal pain.4,5 These atypical hepatic abscesses have been described as pre-suppurative entities caused by the invasion and multiplication of microorganisms,6 with imaging features such as heterogenous, hypodense, poorly demarginated, irregular contours, which can occasionally mimic hepatic malignancy.2,7,8 Although various radiological features of hepatic metastases on CT and MRI have been demonstrated,9–12 overlapping imaging features have frequently been reported, such as perilesional enhancement and diffusion restriction.9,13–15 As a result, the accurate diagnosis of atypical hepatic abscesses and hepatic metastases can be challenging, especially in the absence of distinctive clinical symptoms or for patients with a history of malignant tumor surgery.
With recent technological developments, diffusion-weighted imaging (DWI) has become increasingly widespread in clinical practice for abdominal and, in particular, liver imaging. Based on tissue water mobility, DWI can qualitatively and quantitatively evaluate the characterization of benign and malignant lesions, as well as tumor response to treatment, and assist in the diagnosis of fibrosis and cirrhosis.16–19 The signal intensity (SI) of cystic or necrotic tumors is higher on high b-value DWI with a higher apparent diffusion coefficient (ADC) value due to the relatively free movement of water molecules at the center of the lesion. In contrast, cellular tissues in tumors or high-viscosity pus in abscesses have been observed with a high SI for high b-value DWI and low ADC values.19
Recently, numerous studies have addressed the distinguishing features of abscesses and metastases. Choi et al have found that parts of hepatic microabscesses are invisible on unenhanced T1-weighted images (T1WIs).20 Recent evidence has suggested a non-defect of the arterial enhancing rim on hepatobiliary phase imaging (HBPI) in gadolinium-ethoxybenzyl-diethylenetriamine pentaacetic acid–enhanced MRI, which means the SI of the rim may be lower than that of the surrounding liver parenchyma and higher than that of the central portion.14 In other words, the boundary between the liver parenchyma and abscess is blurred due to the same SI. Therefore, it is hypothesized that the conspicuity of a liver abscess might change with different phases of dynamic MRI, and this variation may help differentiate atypical hepatic abscesses from metastases.
Thus far, only a few studies have outlined the DWI pattern between atypical hepatic abscesses and metastases using gadobenate dimeglumine (Gd-BOPTA)–enhanced MRI. The purpose of this study is to evaluate the efficacy of conspicuity discrepancy and DWI in differentiating hepatic abscesses from malignant mimickers, with a focus on the periphery of the lesions.
Materials and Methods
Patient Population
The institutional review board of the Affiliated Hospital of Hebei University approved the study, and it was conducted in accordance with the declaration of Helsinki. Written informed consent was obtained from all the participants. We retrospectively investigated the radiological data of patients diagnosed with hepatic abscess and metastasis who underwent liver MRI between January 2018 and July 2020. There were 40 patients diagnosed with a hepatitis abscess and 42 diagnosed with metastasis. Of these 82 patients, some were excluded from the study for the following reasons: the MRI findings, such as a cluster sign or double-target sign, were typical of hepatic abscesses (n = 7); there was a lack of follow-up in cases without a confirmed abscess or metastasis (n = 10); and the image quality was poor (n = 2).
Finally, 31 patients with atypical hepatic abscesses (17 males and 14 females; mean age, 61.13 years; age range, 43–87 years) were included in the study. A total of 43 lesions were found: 22 patients had only 1 lesion, 4 patients had 2 lesions, 3 patients had 3 lesions, and 1 patient had 4 lesions. Among the 43 lesions in the hepatic abscess group, one was pathologically confirmed by biopsy, and the remaining 42 lesions were clinically diagnosed, as the lesion disappeared or decreased in size after antibiotic treatment during follow-up.
Among the 32 patients with hepatic metastases (14 males and 18 females; mean age, 57.61 years; age range, 32–77 years), 35 lesions were found; 29 patients had 1 lesion, and 3 patients had 2 lesions. The lesions in the metastasis group included colorectal cancer metastasis (n = 14), gastric carcinoma metastasis (n = 1), breast cancer metastasis (n = 6), serous papillary cystadenocarcinoma metastasis (n = 1), pancreatic ductal adenocarcinoma metastasis (n = 2), gastrointestinal stromal tumor metastasis (n = 3), gallbladder carcinoma metastasis (n = 2), neuroendocrine tumor metastasis (n = 1), cervical cancer metastasis (n = 1), and ureteral cancer metastasis (n = 1). Among all the metastatic tumor lesions, 23 were pathologically confirmed by percutaneous needle biopsy, and 9 were confirmed by clinical diagnosis. The clinical diagnostic criteria for the metastatic tumors were as follows: follow-up CT or MRI indicating that new focal lesions had appeared or that the lesions had grown; and the size of the lesions had increased or decreased after chemotherapy. The case accrual process is summarized in Figure 1.
 |
Figure 1 Flow chart of the study population. |
MRI Examination
Within 2 days of hospitalization, MRI was performed with a 3.0-T whole-body MRI system (GE Discovery MR 750 3.0T, GE Healthcare, Milwaukee, WI, USA) with a 32-channel phased-array coil as the receiver coil. The MRI protocol included several sequences with the following parameters: T2-weighted single-shot fast spin-echo (repetition time [TR], 8000 ms; echo time [TE], 68.9 ms; matrix size, 320 × 320; slice thickness, 5 mm; interslice gap, 6 mm; number of excitations [NEX], 2) and in- and out-of-phase gradient-echo sequences (TR, 3.70 ms; TE, 2.23 and 4.70 ms; matrix size, 260 × 224; slice thickness, 5 mm; interslice gap, 2.5 mm; NEX, 0.70). The DWI was performed with a breath-hold, fat-suppressed, single-shot spin-echo echoplanar imaging sequence axially and acquired before administration of the contrast agent with gradient factors of b = 400 and b = 1000 s/mm2 (TR, 7500 ms; TE, 1.67 ms; matrix size, 128 × 130; slice thickness, 5 mm; interslice gap, 6 mm; NEX, 1). The ADC was calculated using a monoexponential function with b-values of 400 and 1000 s/m2.
Dynamic imaging was performed after the intravenous injection of Gd-BOPTA (Multihance, Bracco Imaging) at a dose of 0.01 mmol/kg body weight and a flow rate of 2 mL/s, followed by a 20-mL saline flush. The early arterial phase (AP), late AP, portal venous phase (PVP), transitional phase (TP), and HBP were also acquired at 25–30 s, 60 s, 180 s, 4–5 min, and 90 min from the start of the Gd-BOPTA injection.
Qualitative and Quantitative Analysis
All the images were independently evaluated by two radiologists with 5 and 10 years of experience in abdominal MRI interpretation on a picture archiving and communication system (Tianjin Technology Group, Zhongguancun Fengtai Science Park, Beijing, China). Both observers were blinded to each patient’s clinical information or histopathological results. After the completion of the independent image evaluation, interobserver agreement was reached concerning the MRI findings. Thereafter, the two reviewers negotiated and arrived at a consensus for the discordant cases.
For the qualitative analysis, the following imaging parameters were evaluated: 1) the SI of the lesions on T1WIs was classified as hyperintense and iso- to hypointense and compared with unaffected liver parenchyma; 2) the SI of the lesions on DWI (b-value of 1000 s/mm2) with the ADC map was divided into three groups: inhomogeneous SI, peripheral high SI rim, and center high; 3) the degree of edema of the perilesional hepatic parenchyma surrounding the lesions was analyzed as follows: no edema; mild edema, defined as range < the liver segment; and severe edema, defined as range > liver segment; 4) the perilesional hyperemia (ie, fuzzy marginated hyperenhancement outside the lesion border on AP that became iso-SI with normal liver parenchyma in PVP) was analyzed; and 5) with regard to the lesion conspicuity, the sharpness of the border between the lesion and surrounding liver tissue was assessed by dynamic imaging and HBPI. The lesion21 conspicuity was identified using a five-point scale (1 = non-identifiable, 2 = hardly identifiable, 3 = adequate, 4 = good, 5 = excellent); the presence of conspicuity discrepancy was used to refer to the lesion conspicuity on HBPI that was smaller than that on TP. When lesions were not seen on HBPI, they were classified as a conspicuity discrepancy.
The quantitative evaluation included the following parameters: 1) considering that there may have been inconsistencies in the size of the infectious lesions observed with the naked eye on the T1WIs, T2WIs, and HBPI,9,22 the longest diameter of the lesions in the above images was measured. A significant difference in lesion size was defined as the longest diameter of a T1WI lesion ≧20% smaller than that on the T2WI or HBPI; 2) to evaluate the SI and enhancement degree of the lesions, a circular area of interest (range 12.04–224.91 mm2) was manually placed in the lesions and surrounding normal liver parenchyma for measurement, avoiding large blood vessels and artifacts as much as possible. The background noise was measured on the ventral side of the right anterior abdominal wall (phase-encoding direction). The contrast-to-noise ratio (CNR) and signal-to-noise ratio (SNR) were calculated as follows: SNR = SIlesion/ SDnoiseCNR = (SIlesion − SIliver)/ SDnoise, where SIlesion is the signal intensities of the liver and lesion and SDnoise is the standard deviation of the background noise23; and 3) using the following formula for the SI pre- and post-enhancement, the relative enhancement ratio (RER) was calculated in each phase of the dynamic imaging: ([SIpost-SIpre]/ SIpre) × 100%.
Statistical Analysis
The data were expressed in terms of the median value ± standard deviation and number (%). The frequency of the categorical variables was analyzed with the chi-square test or Fisher’s exact test (gender, T1WI, T2WI, DWI, ADC, degree of edema of the surrounding normal hepatic parenchyma, perilesional hyperemia, perilesional signal on HBPI, conspicuity discrepancy, percentage change in size from T1 to T2, and percentage change in size from T1 to HBPI). A Mann–Whitney U-test was used for the categorical variables (conspicuity), and a Student’s t-test was performed on the continuous variables (age, CNR, SNR, and RER). To identify the two disease entities, based on the Akaike information criterion and selected significant variables, a multivariate regression model was established using stepwise logistic regression. Thereafter, a nomogram was constructed based on this prediction model. Interobserver agreement was performed for each variable using kappa statistics. The consistency of the conventional interpretation was as follows: poor agreement, <0.20; fair, 0.20–039; moderate, 0.40–0.59; substantial, 0.60–0.79; and almost perfect, 0.80.
All statistical analyses were performed using the statistical software SPSS version 26 (SPSS Inc, Chicago, IL, USA) and R version 3.3.2 (R Foundation for Statistical Computing, Vienna, Austria). A significant difference was defined as p < 0.05.
Results
Demographic Characteristics
Table 1 shows the baseline characteristics of the patient population. No significant differences in gender and age were observed between the two groups (p = 0.173 and p = 0.454, respectively).
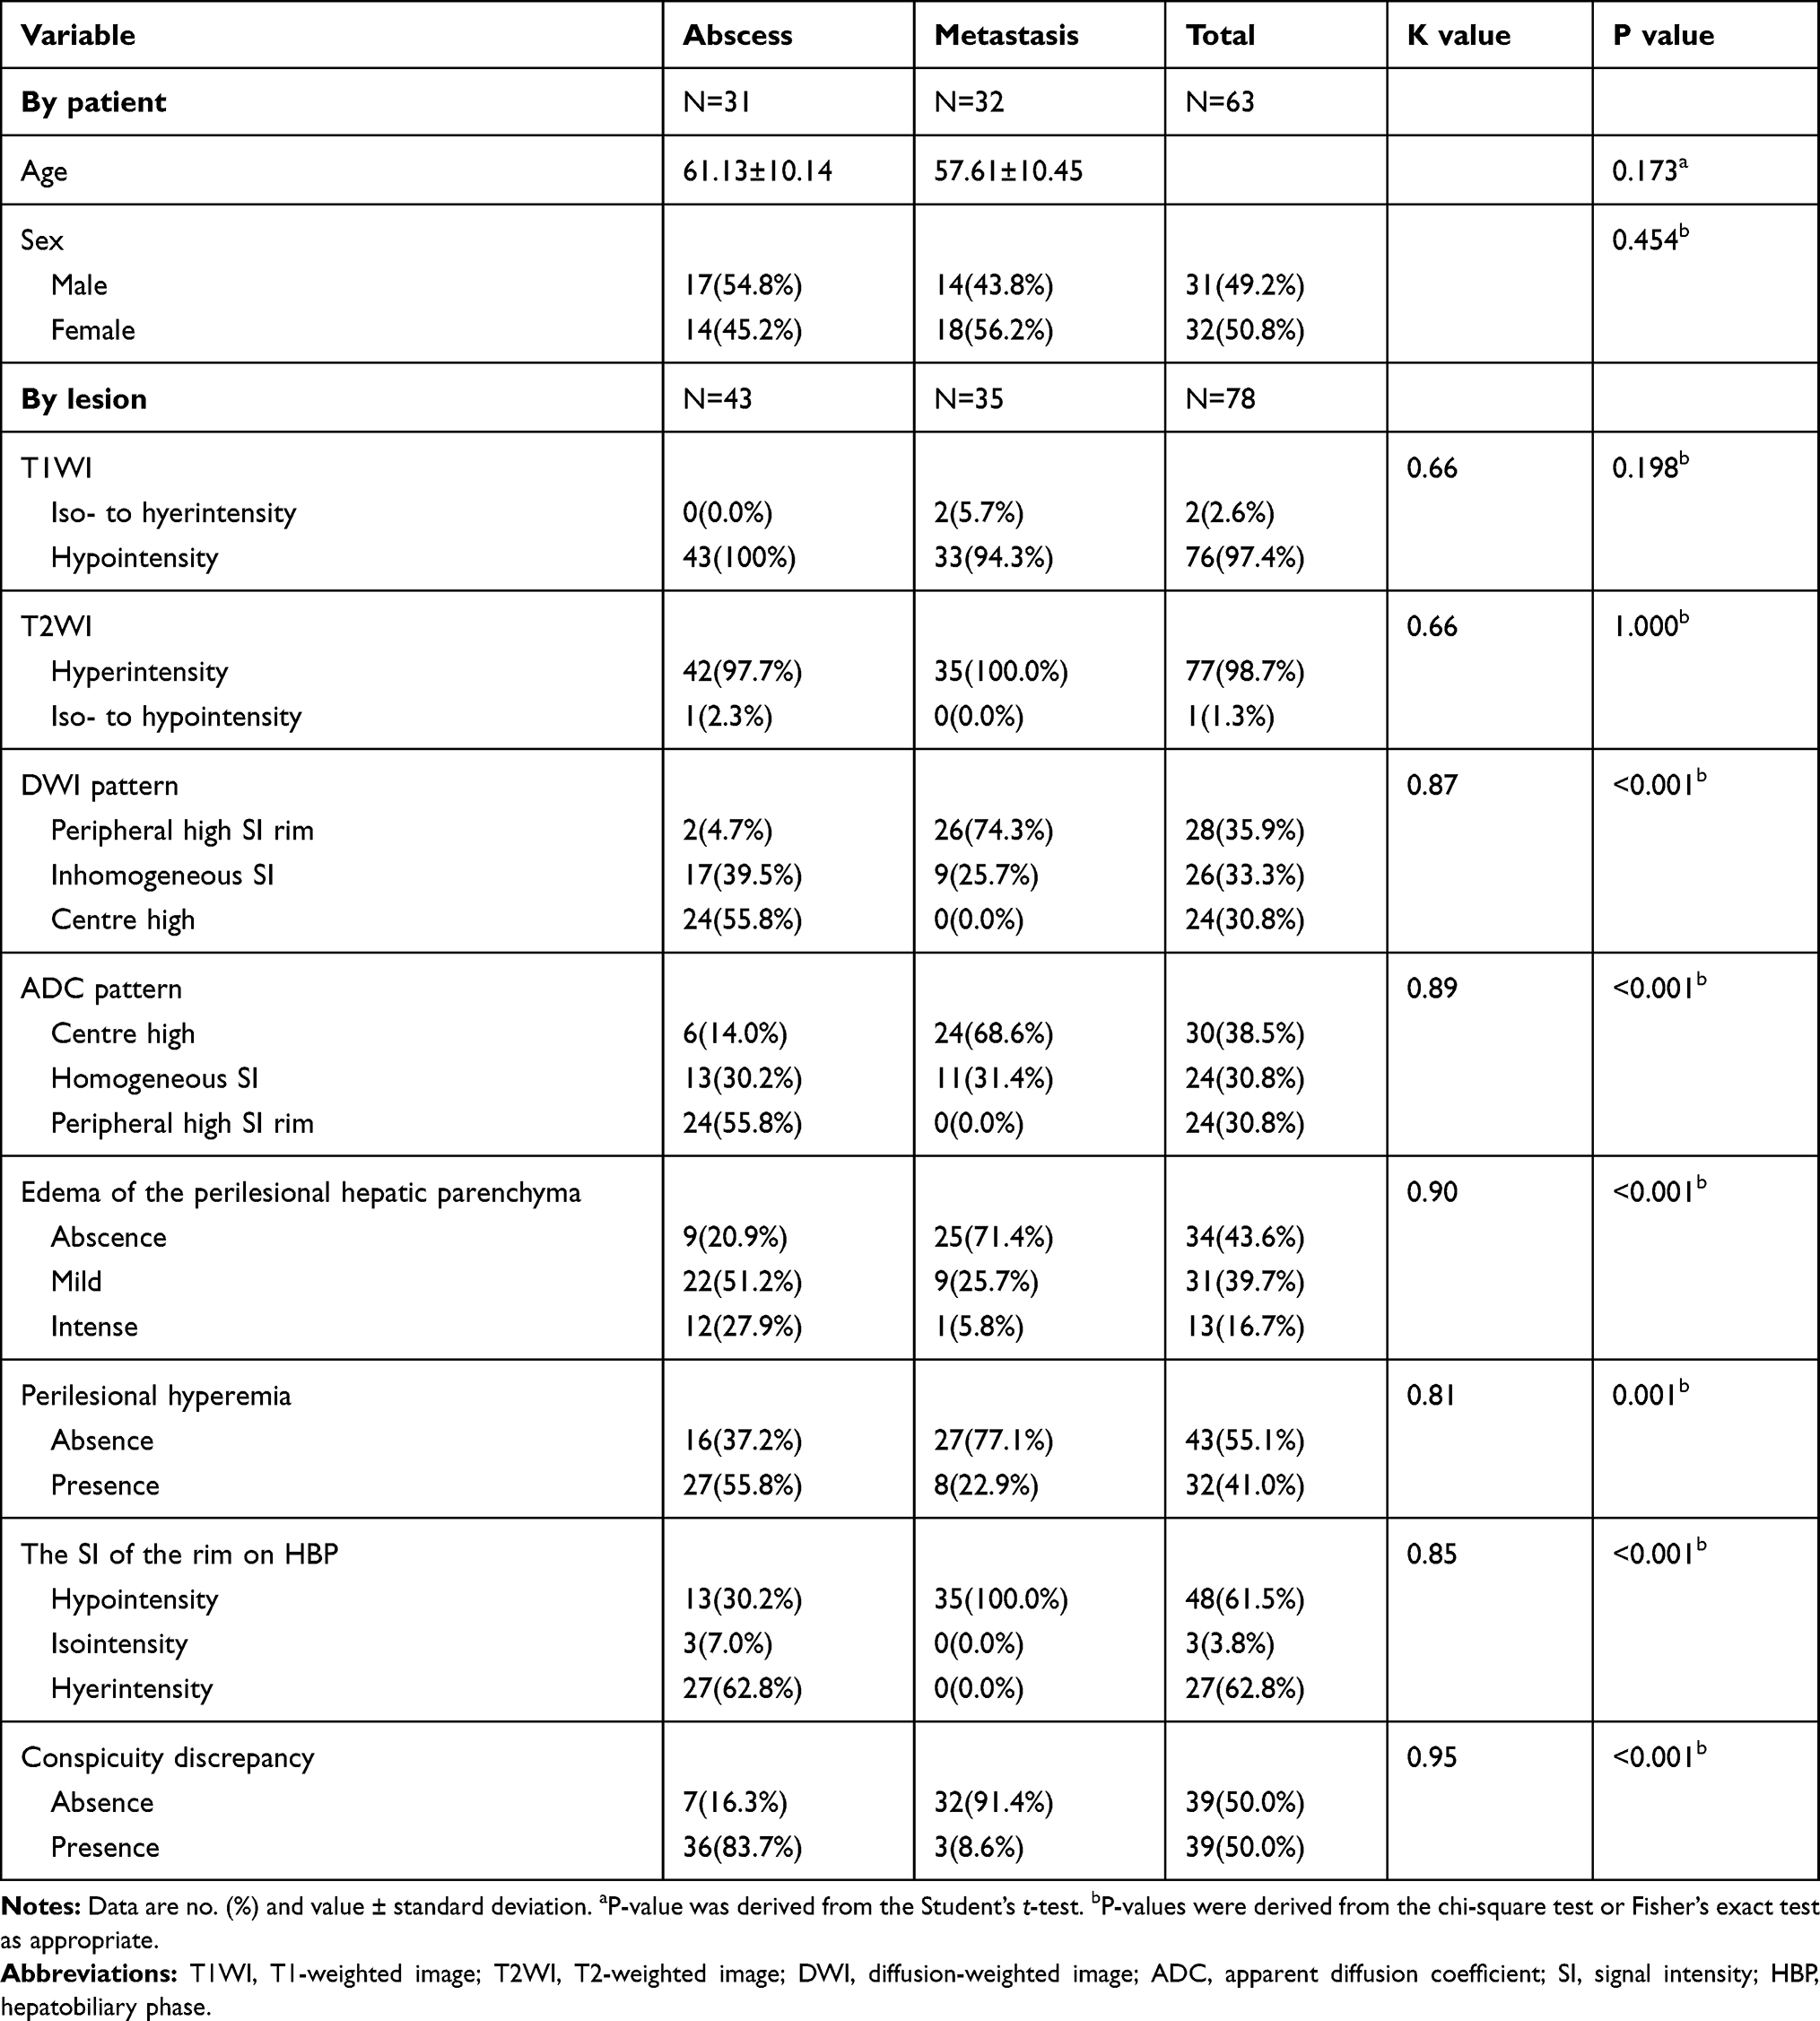 |
Table 1 Characteristics of Patients and Imaging Findings on Gd-BOPTA-Enhanced MRI |
MRI Imaging Features
Table 1 summarizes the qualitative analysis results; the representative images are shown in Figures 2 and 3. In the univariate analysis, there was no significant difference in the SI of the lesions between the two groups on the T1WI (p = 0.198) or T2WI (p = 1.000). The DWI pattern was significantly different between the groups; no hepatic metastasis showed a high SI on the central portion, while 24 (55.8%) atypical hepatic abscesses presented with a high SI on the central portion (p < 0.001). Furthermore, a center high portion on the ADC map was more frequently observed in metastases than in atypical hepatic abscesses (68.6% vs 14.0%, respectively, p < 0.001). With regard to the degree of edema of the hepatic parenchyma surrounding the lesions, mild and severe edema was more frequently seen in the atypical hepatic abscesses than in the liver metastases (51.2%, 27.9% vs 25.7%, 5.8%, respectively, p < 0.001). Moreover, 27 out of the 43 hepatic abscesses (55.8%) presented with perilesional hyperemia around the lesions, while only 8 out of the 35 hepatic metastases presented with perilesional hyperemia (22.9%, p = 0.001). Concerning the signal characteristics on HBPI, no liver metastasis showed an iso- or hyper-SI rim, and all 35 lesions showed a hypo-SI rim; meanwhile, 13 of the 43 atypical liver abscess (30.2%) lesions showed a low SI rim, 3 (7.0%) showed iso-SI, and the remaining 27 liver abscesses (62.8%) showed hyper-SI.
 |
Figure 2 A 52-year-old woman with an atypical hepatic abscess. (A) The T2-weighted imaging shows a well-defined hyperintense lesion (arrow) in segment V. (B) In the early AP, the conspicuity score of the fuzzy lesion was 3. (C–E) In the late AP (C), PVP (D), and TP (E), the lesion had clearer boundaries (rating 4). (F) The HBPI obtained 90 min after injection of the contrast agent shows an ill-defined lesion (arrow, rating 2); it was regarded as having a conspicuity discrepancy. |
 |
Figure 3 A 47-year-old man with colorectal cancer. (A) The T2-weighted imaging shows a well-defined hyperintense lesion in segment V. (B) In the early AP, the conspicuity score of the lesion was 4. (C–E) In the late AP (C), PVP (D), and TP (E), the lesion had clear boundaries (rating 5). (F) The lesion was depicted in sharp contrast with surrounding liver parenchyma on HBPI (rating 5). |
The frequency of the conspicuity discrepancy of the liver abscesses was higher than that of the liver metastases (83.7% vs 8.6%, respectively, p < 0.001). Figure 4 shows that the rating value of the conspicuity of the hepatic metastases was higher than that of the atypical liver abscesses on the T1WIs, T2WIs, early AP, late AP, PVP, and HBPI (all p < 0.001) but showed no difference (p = 0.416) between the two groups on TP.
 |
Figure 4 Violin plot of the conspicuity in the T1WIs, T2WIs, and dynamic imaging. Mann–Whitney U-test; *P < 0.001, #P = 0.416. |
The results of the quantitative analysis are illustrated in Table 2. In total, 15 (34.9%) hepatic abscesses showed a size discrepancy of ≥20% between the T1WIs and HBPI, while 32 (91.4%) hepatic metastases showed a size discrepancy of <20% between the T1WIs and HBPI (p = 0.007). No significant differences were found between the atypical hepatic abscesses and hepatic metastases in the size discrepancy of ≥20% between the T1WIs and T2WIs (14.0% vs 2.9%, respectively, p = 0.122).
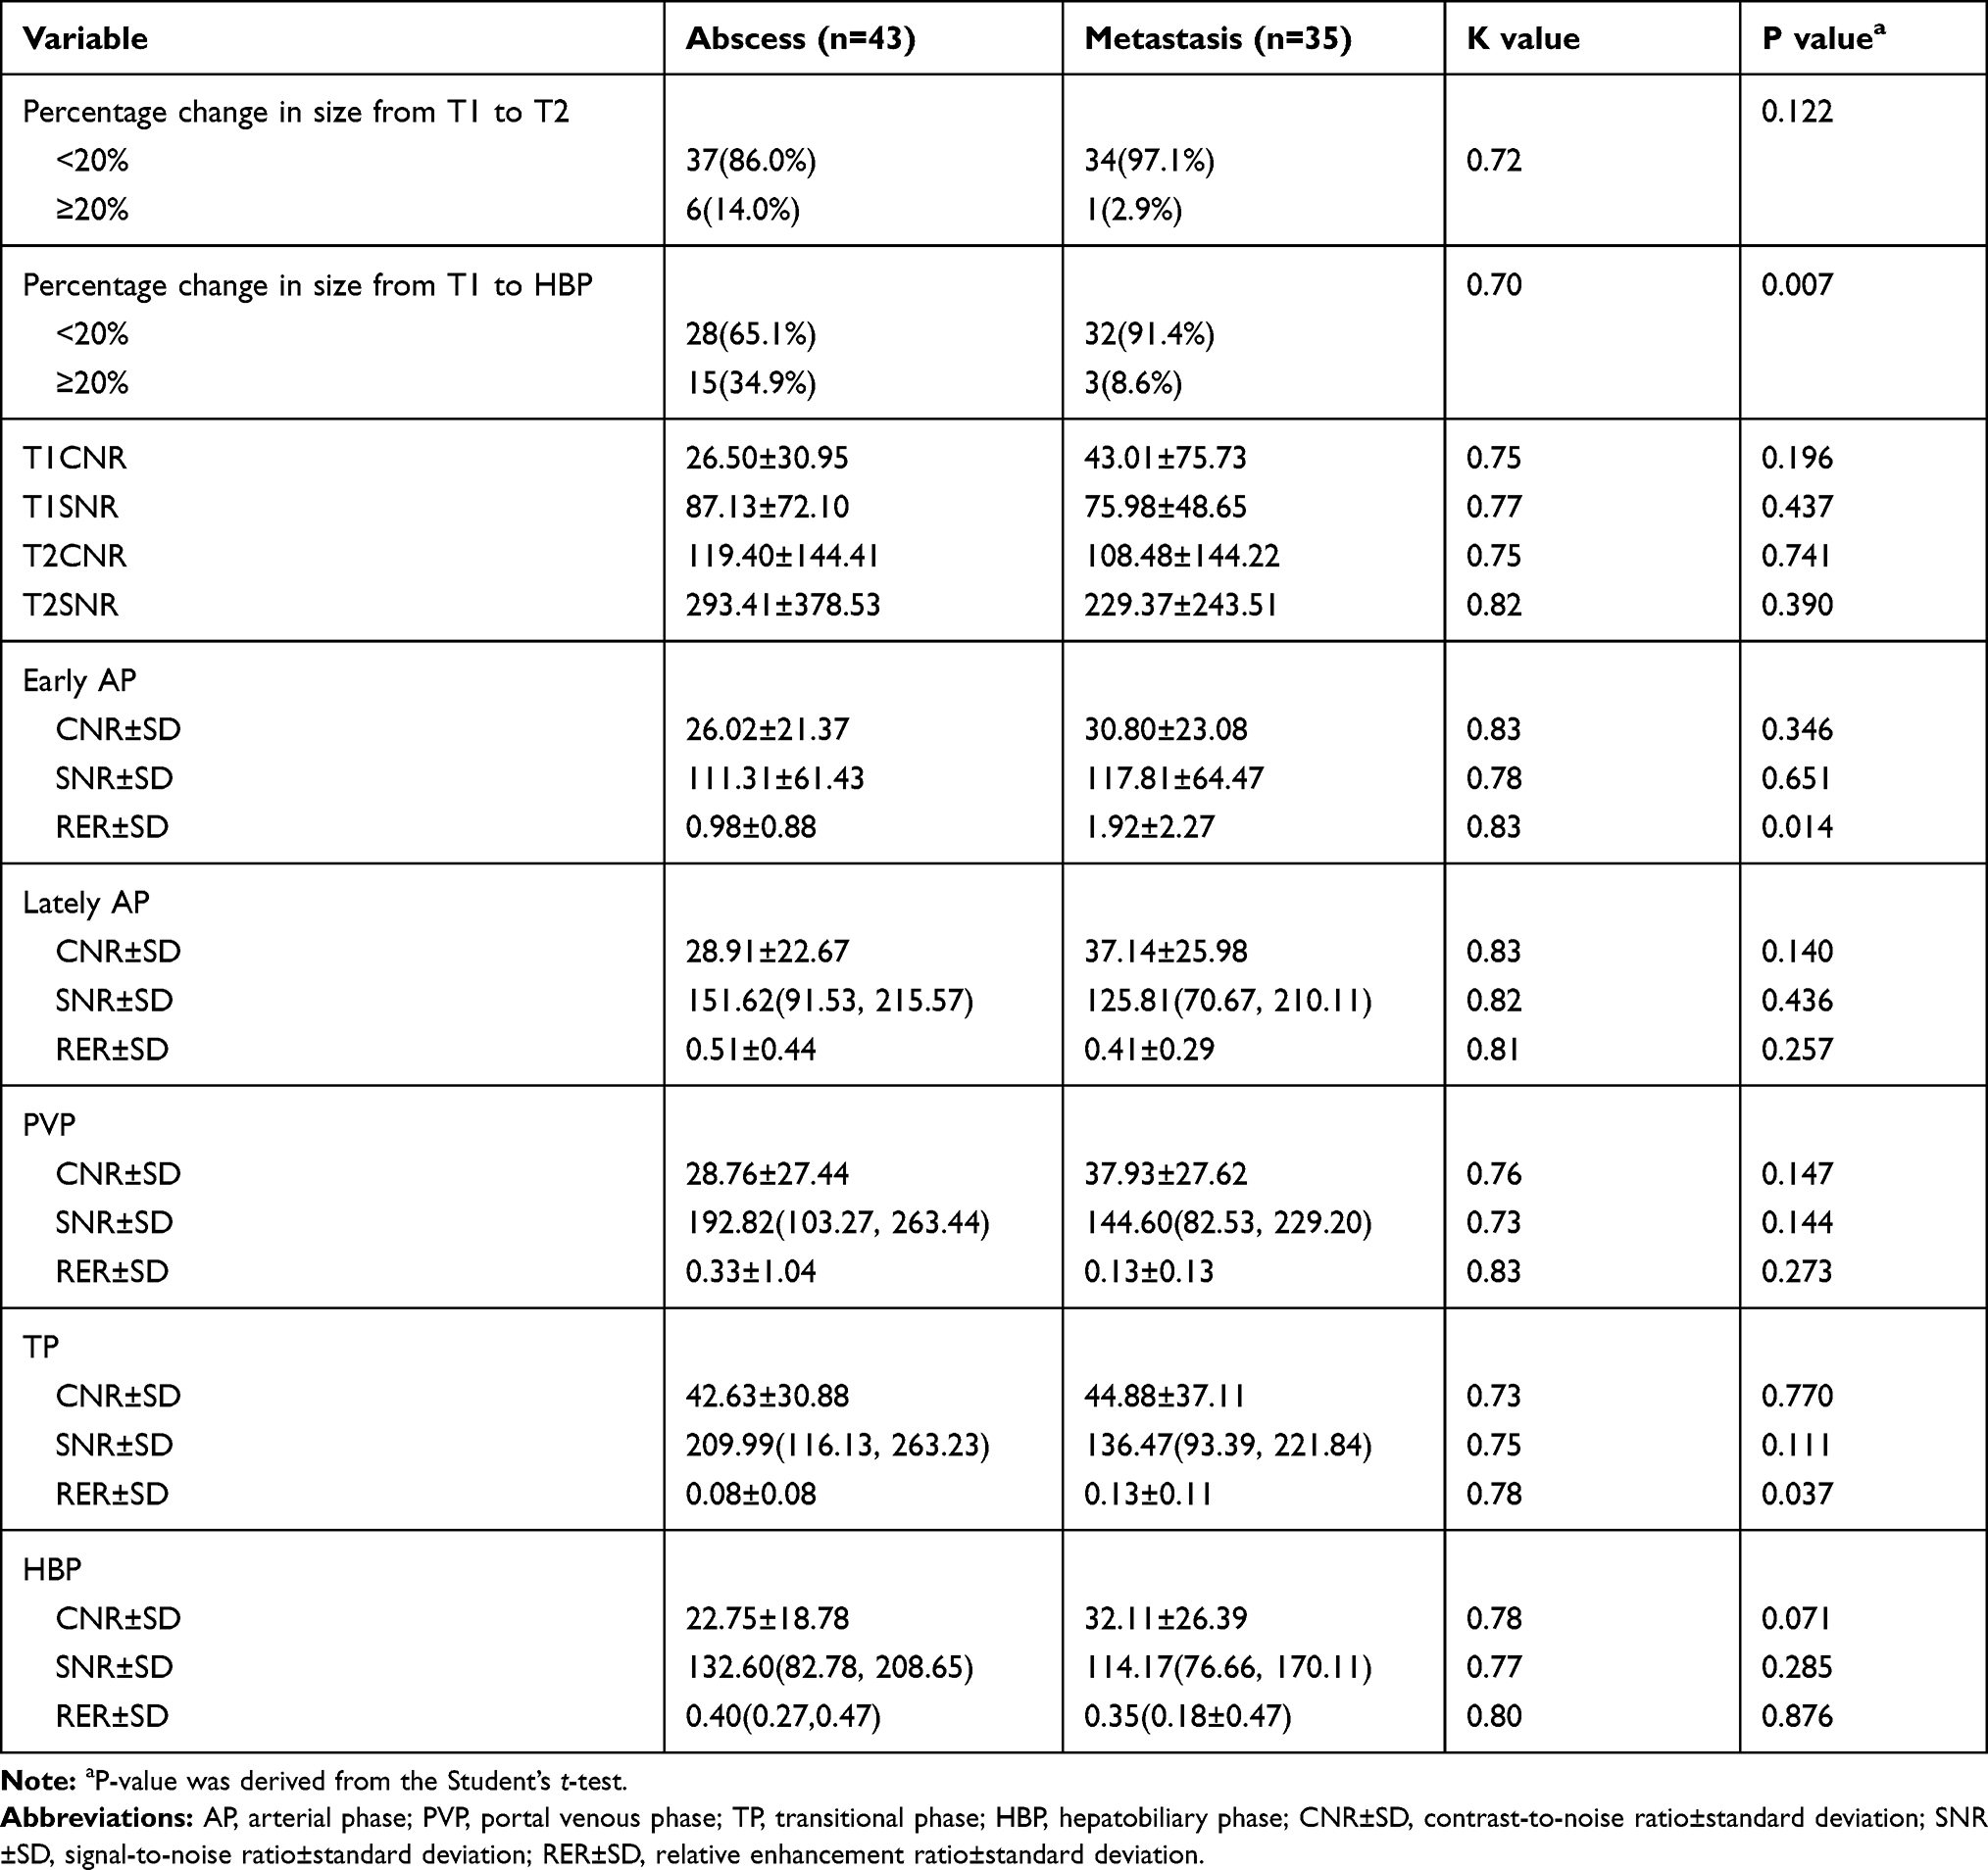 |
Table 2 Quantitative Comparison of MRI Parameters of Lesions in Patients with Atypical Hepatic Abscess and Those with Metastasis |
The OR of each significant MRI category for distinguishing the atypical hepatic abscesses from hepatic metastases is presented in Table 3. In the multivariate analysis, the absence of a peripheral high SI rim on DWI (p = 0.011) and conspicuity discrepancy (p = 0.013) were considered significant variables for predicting atypical hepatic abscesses rather than hepatic metastases. A nomogram was constructed based on the regression coefficients of the significant variables (Figure 5).
 |
Table 3 Diagnostic Performance of Each Variable for Differentiating Atypical Hepatic Abscess from Metastasis |
 |
Figure 5 Nomogram for differentiating atypical hepatic abscesses from metastases. Top: predictor points found on an uppermost point scale that corresponds to each variable. Bottom: points for all variables added and translated into a probability of hepatic abscess. Conspicuity discrepancy: 1; non-peripheral high SI rim on DWI: 1. |
Table 4 demonstrates the sensitivity, specificity, accuracy, positive likelihood ratio, and negative likelihood ratio for the significant imaging findings and their combinations. When a lesion was positive for the absence of a peripheral high SI rim on DWI or conspicuity discrepancy, the sensitivity, specificity, and accuracy for identifying atypical liver abscesses were 89.5% (95% CI 80.6–94.8%), 82.9% (95% CI 71.6–90.5%), and 51.1% (95% CI 47.0–63.0%), respectively. When both categories were satisfied, the sensitivity and accuracy were 97.2% (95% CI 83.8–99.9%) and 61.0 (95% CI 47.4–73.2%), and the specificity was 100% (95% CI 82.2–100%). The interobserver agreement for all the imaging features was substantial to perfect (k = 0.66–0.95).
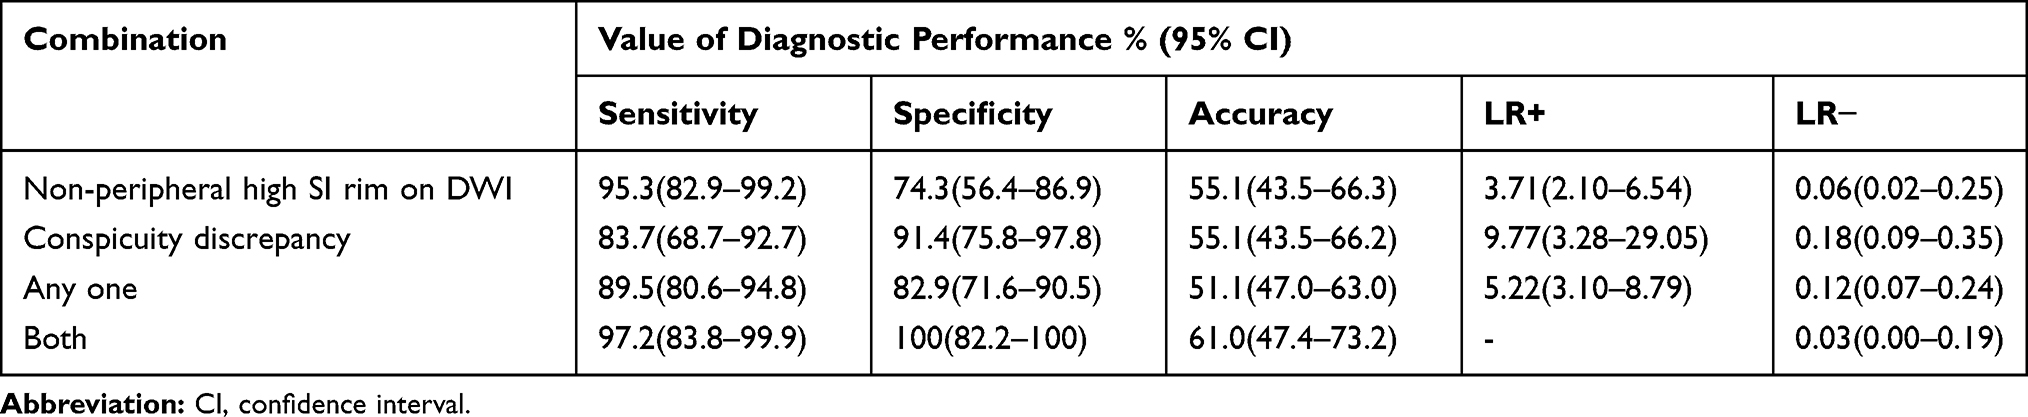 |
Table 4 Diagnostic Performance of MRI Features for Identifying Atypical Hepatic Abscess |
Discussion
Our study showed that among various MRI findings, the absence of a peripheral high SI rim on DWI and conspicuity discrepancy are independent factors for distinguishing atypical hepatic abscesses from metastases. Compared with liver metastases, the specificity of the two criteria in diagnosing atypical hepatic abscesses was 74.3% and 91.4%, respectively. When either of the two criteria was positive, the sensitivity and accuracy reached 82.9% and 51.1%. In addition, positive radiologic findings increased the sensitivity and accuracy of an atypical hepatic abscess by 17.1% and 9.9%, respectively, for any one feature, suggesting that this method is useful for predicting atypical liver abscesses and has important clinical significance in reducing the misdiagnosis and improper treatment of atypical liver abscesses. In addition, a nomogram for individualized risk estimation that calculated the numerical probability of atypical hepatic abscesses was presented.
In our study, the conspicuity discrepancy of HBPI was the significant independent variable for distinguishing atypical liver abscesses from liver metastases (p = 0.013). We believe that the peripheral portion of an atypical hepatic abscess may have a high chance of contrast agent retention due to the presence of vascularized granulation tissue around the abscess, the fibrotic inflammatory processes, and the preserved functioning hepatocytes around the abscess, which may be responsible for an ill-defined margin relative to the peripheral portion of a hepatic metastasis with abundant tumoral cellularity (which results in a well-defined margin).24–26 Regarding the other phases, except for TP, the conspicuity of the metastases was higher than that of the atypical hepatic abscesses. This may reflect the perfusion within the well-vascularized peripheral portion of lesions, which has good arterial supply and good venous withdrawal of the contrast material.11
When the DWI was combined with the ADC map, the SI pattern of the atypical hepatic abscess and hepatic metastasis signals differed. Most liver metastases showed a peripheral high SI rim compared with the center section (26/35, 74.3%), which was not the case for most liver abscesses (2/45, 4.7%). These data were consistent with the target sign of liver metastasis from breast or colon cancer reported in previous studies.27–29 In the multivariate analysis, the target sign on DWI became an independent risk factor for distinguishing atypical hepatic abscesses from metastases (p = 0.011). Therefore, our study reaffirmed the role of the target sign on DWI in accurately characterizing atypical hepatic abscesses. The DWI high signal in the center of the hepatic abscess lesions could be explained by the increased restriction of diffusion of high-viscosity pus in the central area.20 In our study, there were only two (4.7%) cases of atypical hepatic abscesses with high SI and ADC values, an effect known as “T2 shine-through,” while the surrounding area of the malignant tumors showed diffusion limitation. Abscesses can lead to decreased cellularity and increased extracellular fluid in the periphery, secondary to inflammation, leading to prolonged T2 relaxation time without diffusion restriction.9 Unlike hepatic abscesses, hepatic metastases have been found to have restricted diffusion due to the crowding of tumor cells at the peripheral areas, leading to a hyperintense rim on high b-value DWI with diffusion restriction, which is consistent with our study.9,29,30
In our study, most of the peripheral areas of the atypical hepatic abscesses lesions had iso- or hyperintense SI, and a peripheral low SI rim was seen in most of the hepatic metastases, which was consistent with the results of previous studies.14 When using hepatocyte-specific agent Gd-BOPTA (Multihance) on 90-minute delayed HBPI, the hepatobiliary metabolism in lesions with functional hepatocytes remained primarily the same as that of normal hepatocytes, taking in the contrast agent and excreting it into the bile. Therefore, inflammatory lesions, such as liver abscesses, usually present as isointense or hyperintense relative to the center, and the imaging findings may vary according to the degree of inflammation and proportions of destroyed hepatic parenchyma.14 In contrast, it is well known that hepatic metastases do not contain functional hepatocytes. Therefore, the hepatobiliary metabolism is blocked or inhibited, hepatocytes are usually unable to uptake and excrete hepatocyte-specific agents, and most of these malignant lesions are surrounded by abundant tumor cells, leading to hypointense HBPI.31,32 In our study, 13 (30.2%) liver abscess margins presented as hypointense on HBPI, which may have been due to infection, inflammation, or impaired peripheral biliary function in the peripheral portion, resulting in damage to the hepatocytes, as many previous studies have shown.14,33–35
In our study, a size discrepancy of ≥20% between the T1WIs and HBPI occurred in a higher proportion of liver abscesses than hepatic metastases (34.9% vs 8.6%, respectively), similar to previous studies.21,35,36 However, this is not an important indicator for distinguishing atypical hepatic abscesses from hepatic metastases. Theoretically, perfusion abnormalities and inflammatory changes around inflammatory lesions can cause damage to hepatocytes from sinus congestion, inflammatory cell infiltration, and hyperplasia around the lesions, which may be due to the size discrepancy between T1WIs and HBP images.36,37 When examining the dynamic enhancement pattern, we found that the RERs of the hepatic metastases in the early AP (1.92 ± 2.27 vs 0.98 ± 0.88) and TP (0.13 ± 0.11 vs 0.08 ± 0.08) were greater than those of the atypical hepatic abscesses. The reason for this may be closely related to the proliferative reaction around the tumors, the infiltration of inflammatory cells (eg, eosinophils and lymphocytes), and the proliferation of blood vessels around the tumors,12,23 which in turn caused the larger RER in the hepatic metastases.
Several studies have reported that hyperemia around lesions is an imaging feature that may be related to hepatic abscesses, stemming from the increase in local portal venous blood flow and compensatory arterial blood flow, caused by acute inflammation of the liver parenchyma around the abscess.2,38 For hepatic metastases, the mechanism of perilesional hyperemia may be that inflammatory infiltration of the tumor side increases the perfusion of the surrounding hepatic parenchyma by releasing local factors as follows: (1) increased hepatic arterial blood flow is caused by arterialization of the area lacking portal blood flow, secondary to tumor occlusion; (2) the siphoning effect of vascular tumors and tumor blood vessels leads to increased hepatic artery blood flow; and (3) hepatic parenchymal compression caused by a large number of masses in the liver parenchyma produces an area of increased blood vessels.26 Our study found that 55.8% (27/43) of the atypical hepatic abscesses had hyperemia around the lesions, which was observed in only 22.9% (8/35) of the liver metastases. Our research findings are supported by several previous research studies.24 Unfortunately, the variable was not statistically significant in the multivariate analysis model.
Limitations
Our research had several limitations. First, it was limited by the retrospective evaluation of the selected patient groups, which may have generated selection bias. We included patients suspected of hepatic abscess and hepatic metastasis, so our results were only relevant for distinguishing atypical hepatic abscesses from hepatic metastases rather than any other malignant tumors. Second, histological evidence was not available for all the lesions, and so, for the lesions that were not pathologically confirmed, we only included the cases that were strongly suspected of being lesions based on our criteria. Third, no independent validation set was used for the external analysis to validate the ratio used to construct the nomogram. Therefore, larger prospective studies are needed to do so in the future.
Conclusion
In conclusion, Gd-BOPTA–enhanced MRI has practical value in the identification of atypical hepatic abscesses and hepatic metastases. Moreover, conspicuity discrepancy and a non-peripheral high SI rim on DWI are correlated with the characterization of atypical hepatic abscesses and hepatic metastases. The imaging characteristics may also prove useful in patients with a history of malignant tumor surgery or without specific clinical symptoms.
Funding
Outstanding young scientific research and innovation team of Hebei University (605020521007); Natural Science Foundation of Hebei(H2021201017),CT Radiomics Study on the Correlation between Colorectal Liver Metastasis and Microsatellite Instability; Medical Discipline Cultivation Project(2020B05),CT Radiomics Study on the Correlation between Colorectal Liver Metastasis and Microsatellite Instability; The Financial Department of Hebei Province,Health commission of Hebei Province(361007),CT Radiomics Study on the Correlation between Colorectal Liver Metastasis and Microsatellite Instability.
Disclosure
The authors report no conflicts of interest in this work.
References
1. Jeffrey RB
2. Mathieu D, Vasile N, Fagniez PL, Segui S, Grably D, Lardé D. Dynamic CT features of hepatic abscesses. Radiology. 1985;154(3):749–752. doi:10.1148/radiology.154.3.3969480
3. Thng CB, Tan YP, Shelat VG. Gas-forming pyogenic liver abscess: a world review. Ann HepatobiliaryPancreat Surg. 2018;22(1):11–18. doi:10.14701/ahbps.2018.22.1.11
4. Barnes PF, De Cock KM, Reynolds TN, Ralls PW. A comparison of amebic and pyogenic abscess of the liver. Medicine. 1987;66(6):472–483. doi:10.1097/00005792-198711000-00005
5. Ralls PW. Inflammatory disease of the liver. Clin Liver Dis. 2002;6(1):203–225. doi:10.1016/S1089-3261(03)00073-4
6. Lardière-Deguelte S, Ragot E, Amroun K, et al. Hepatic abscess: diagnosis and management. J Visc Surg. 2015;152(4):231–243. doi:10.1016/j.jviscsurg.2015.01.013
7. Ryan RS, Al-Hashimi H, Lee MJ. Hepatic abscesses in elderly patients mimicking metastatic disease. Ir J Med Sci. 2001;170(4):251–253. doi:10.1007/BF03167790
8. Jan YY, Yeh TS, Chen MF. Cholangiocarcinoma presenting as pyogenic liver abscess: is its outcome influenced by concomitant hepatolithiasis? Am J Gastroenterol. 1998;93(2):253–255. doi:10.1111/j.1572-0241.1998.00253.x
9. Park HJ, Kim SH, Jang KM, Lee SJ, Park MJ, Choi D. Differentiating hepatic abscess from malignant mimickers: value of diffusion-weighted imaging with an emphasis on the periphery of the lesion. J MagnReson Imaging. 2013;38(6):1333–1341. doi:10.1002/jmri.24112
10. Zech CJ, Herrmann KA, Reiser MF, Schoenberg SO. MR imaging in patients with suspected liver metastases: value of liver-specific contrast agent Gd-EOB-DTPA. MagnReson Med Sci. 2007;6(1):43–52.
11. Danet IM, Semelka RC, Leonardou P, et al. Spectrum of MRI appearances of untreated metastases of the liver. AJR Am J Roentgenol. 2003;181(3):809–817. doi:10.2214/ajr.181.3.1810809
12. Lee KH, Lee JM, Park JH, et al. MR imaging in patients with suspected liver metastases: value of liver-specific contrast agent gadoxetic acid. Korean J Radiol. 2013;14(6):894–904. doi:10.3348/kjr.2013.14.6.894
13. Balci NC, Semelka RC, Noone TC, et al. Pyogenic hepatic abscesses: MRI findings on T1- and T2-weighted and serial gadolinium-enhanced gradient-echo images. J MagnReson Imaging. 1999;9(2):285–290. doi:10.1002/(SICI)1522-2586(199902)9:2<285::AID-JMRI20>3.0.CO;2-S
14. Choi SH, Lee CH, Kim BH, et al. “Nondefect” of arterial enhancing rim on hepatobiliary phase in 3.0-T gadolinium-ethoxybenzyl-diethylenetriamine pentaacetic acid-enhanced liver magnetic resonance imaging: distinguishing hepatic abscess from metastasis. J Comput Assist Tomogr. 2013;37(6):849–855. doi:10.1097/RCT.10.1097/RCT.0b013e318297211a
15. Demir OI, Obuz F, Sağol O, Dicle O. Contribution of diffusion-weighted MRI to the differential diagnosis of hepatic masses. DiagnIntervRadiol. 2007;13(2):81–86.
16. Bruegel M, Holzapfel K, Gaa J, et al. Characterization of focal liver lesions by ADC measurements using a respiratory triggered diffusion-weighted single-shot echo-planar MR imaging technique. Eur Radiol. 2008;18(3):477–485. doi:10.1007/s00330-007-0785-9
17. Padhani AR, Liu G, Koh DM, et al. Diffusion-weighted magnetic resonance imaging as a cancer biomarker: consensus and recommendations. Neoplasia. 2009;11(2):102–125. doi:10.1593/neo.81328
18. Parikh T, Drew SJ, Lee VS, et al. Focal liver lesion detection and characterization with diffusion-weighted MR imaging: comparison with standard breath-hold T2-weighted imaging. Radiology. 2008;246(3):812–822. doi:10.1148/radiol.2463070432
19. Taouli B, Koh DM. Diffusion-weighted MR imaging of the liver. Radiology. 2010;254(1):47–66. doi:10.1148/radiol.09090021
20. Choi SY, Kim YK, Min JH, Cha DI, Jeong WK, Lee WJ. The value of gadoxetic acid-enhanced MRI for differentiation between hepatic microabscesses and metastases in patients with periampullary cancer. EurRadiol. 2017;27(10):4383–4393.
21. Kang Y, Lee JM, Kim SH, Han JK, Choi BI. Intrahepatic mass-forming cholangiocarcinoma: enhancement patterns on gadoxetic acid-enhanced MR images. Radiology. 2012;264(3):751–760. doi:10.1148/radiol.12112308
22. Granata V, Catalano O, Fusco R, et al. The target sign in colorectal liver metastases: an atypical Gd-EOB-DTPA “uptake” on the hepatobiliary phase of MR imaging. Abdom Imaging. 2015;40(7):2364–2371. doi:10.1007/s00261-015-0488-7
23. Chung JJ, Kim MJ, Kim KW. Mangafodipir trisodium-enhanced MRI for the detection and characterization of focal hepatic lesions: is delayed imaging useful? J MagnReson Imaging. 2006;23(5):706–711. doi:10.1002/jmri.20557
24. Semelka RC, Hussain SM, Marcos HB, Woosley JT. Perilesional enhancement of hepatic metastases: correlation between MR imaging and histopathologic findings-initial observations. Radiology. 2000;215(1):89–94. doi:10.1148/radiology.215.1.r00mr2989
25. Hwang HS, Kim SH, Jeon TY, Choi D, Lee WJ, Lim HK. Hypointense hepatic lesions depicted on gadobenate dimeglumine-enhanced three-hour delayed hepatobiliary-phase MR imaging: differentiation between benignancy and malignancy. Korean J Radiol. 2009;10(3):294–302. doi:10.3348/kjr.2009.10.3.294
26. Terayama N, Matsui O, Ueda K, et al. Peritumoral rim enhancement of liver metastasis: hemodynamics observed on single-level dynamic CT during hepatic arteriography and histopathologic correlation. J Comput Assist Tomogr. 2002;26(6):975–980. doi:10.1097/00004728-200211000-00021
27. Tateyama A, Fukukura Y, Takumi K, et al. Gd-EOB-DTPA-enhanced magnetic resonance imaging features of hepatic hemangioma compared with enhanced computed tomography. World J Gastroenterol. 2012;18(43):6269–6276. doi:10.3748/wjg.v18.i43.6269
28. Doo KW, Lee CH, Choi JW, Lee J, Kim KA, Park CM. “Pseudo washout” sign in high-flow hepatic hemangioma on gadoxetic acid contrast-enhanced MRI mimicking hypervascular tumor. AJR Am J Roentgenol. 2009;193(6):W490–496. doi:10.2214/AJR.08.1732
29. Chan JH, Tsui EY, Luk SH, et al. Diffusion-weighted MR imaging of the liver: distinguishing hepatic abscess from cystic or necrotic tumor. Abdom Imaging. 2001;26(2):161–165. doi:10.1007/s002610000122
30. Taouli B, Vilgrain V, Dumont E, Daire JL, Fan B, Menu Y. Evaluation of liver diffusion isotropy and characterization of focal hepatic lesions with two single-shot echo-planar MR imaging sequences: prospective study in 66 patients. Radiology. 2003;226(1):71–78. doi:10.1148/radiol.2261011904
31. Kim A, Lee CH, Kim BH, et al. Gadoxetic acid-enhanced 3.0T MRI for the evaluation of hepatic metastasis from colorectal cancer: metastasis is not always seen as a “defect” on the hepatobiliary phase. Eur J Radiol. 2012;81(12):3998–4004. doi:10.1016/j.ejrad.2012.03.032
32. Ha S, Lee CH, Kim BH, et al. Paradoxical uptake of Gd-EOB-DTPA on the hepatobiliary phase in the evaluation of hepatic metastasis from breast cancer: is the “target sign” a common finding? Magn Reson Imaging. 2012;30(8):1083–1090. doi:10.1016/j.mri.2012.03.007
33. Runge VM, Wells JW, Williams NM. Hepatic abscesses. Magnetic resonance imaging findings using gadolinium-BOPTA. Invest Radiol. 1996;31(12):781–788. doi:10.1097/00004424-199612000-00008
34. Schneider G, Fries P, Samaras P, Remberger K, Uder M, Kramann B. Inflammatory pseudotumor of the liver in a patient with congenital granulocytopenia and HCV infection. Eur J Radiol. 2003;48(3):293–298. doi:10.1016/S0720-048X(03)00047-0
35. Bartolozzi C, Crocetti L, Lencioni R, Cioni D, Della Pina C, Campani D. Biliary and reticuloendothelial impairment in hepatocarcinogenesis: the diagnostic role of tissue-specific MR contrast media. EurRadiol. 2007;17(10):2519–2530.
36. Lee MH, Kim SH, Kim H, Lee MW, Lee WJ. Differentiating focal eosinophilic infiltration from metastasis in the liver with gadoxetic acid-enhanced magnetic resonance imaging. Korean J Radiol. 2011;12(4):439–449. doi:10.3348/kjr.2011.12.4.439
37. Park MS, Kim MJ, Lim JS, et al. Metastasis versus focal eosinophilic infiltration of the liver in patients with extrahepatic abdominal cancer: an evaluation with gadobenate dimeglumine-enhanced magnetic resonance imaging. J Comput Assist Tomogr. 2009;33(1):119–124. doi:10.1097/RCT.0b013e3181641b1a
38. Gabata T, Kadoya M, Matsui O, et al. Dynamic CT of hepatic abscesses: significance of transient segmental enhancement. AJR Am J Roentgenol. 2001;176(3):675–679. doi:10.2214/ajr.176.3.1760675
 © 2021 The Author(s). This work is published and licensed by Dove Medical Press Limited. The
full terms of this license are available at https://www.dovepress.com/terms
and incorporate the Creative Commons Attribution
- Non Commercial (unported, 3.0) License.
By accessing the work you hereby accept the Terms. Non-commercial uses of the work are permitted
without any further permission from Dove Medical Press Limited, provided the work is properly
attributed. For permission for commercial use of this work, please see paragraphs 4.2 and 5 of our Terms.
© 2021 The Author(s). This work is published and licensed by Dove Medical Press Limited. The
full terms of this license are available at https://www.dovepress.com/terms
and incorporate the Creative Commons Attribution
- Non Commercial (unported, 3.0) License.
By accessing the work you hereby accept the Terms. Non-commercial uses of the work are permitted
without any further permission from Dove Medical Press Limited, provided the work is properly
attributed. For permission for commercial use of this work, please see paragraphs 4.2 and 5 of our Terms.