Back to Journals » Clinical Ophthalmology » Volume 11
Different fixation targets affect retinal sensitivity obtained by microperimetry in normal individuals
Authors Nizawa T, Baba T, Kitahashi M, Oshitari T, Yamamoto S
Received 20 July 2017
Accepted for publication 30 September 2017
Published 14 November 2017 Volume 2017:11 Pages 2011—2015
DOI https://doi.org/10.2147/OPTH.S146831
Checked for plagiarism Yes
Review by Single anonymous peer review
Peer reviewer comments 2
Editor who approved publication: Dr Scott Fraser
Tomohiro Nizawa, Takayuki Baba, Masayasu Kitahashi, Toshiyuki Oshitari, Shuichi Yamamoto
Department of Ophthalmology and Visual Science, Chiba University Graduate School of Medicine, Chiba, Japan
Purpose: To determine the differences in the retinal sensitivities obtained by microperimetry with a single cross or a circular fixation target in normal individuals.
Methods: Thirty-two eyes of 16 healthy volunteers (mean age 28.9±1.4 years, range 24–44 years) were studied. The retinal sensitivity of the central 0 degrees and of the mean central 2 degrees consisting of 8 points were determined independently using the two different fixation targets with Microperimeter 3. The Goldmann III stimulus with a luminance of 1.0 cd/m2 was presented for 200 ms on a white background.
Results: The retinal sensitivity of the central 0 degrees was significantly better with the circular target than that with the cross target (P=0.003, right eyes; P=0.001, left eyes). The mean retinal sensitivity in the central 2 degrees was not significantly different between the cross and circular fixation targets. (P=0.07, right eyes; P=0.08, left eyes).
Conclusion: These results indicate that the circular fixation target is a better target to use to evaluate the central retinal sensitivity. The difference in the retinal sensitivity is most likely due to the cross fixation target overlapping the test stimulus target.
Keywords: microperimetry, retinal sensitivity, fixation targets, stimuli
Introduction
Microperimetry1 can be used to measure the local retinal sensitivity for functional assessments of the central retina. The automatic eye tracking system allows real-time corrections for eye movements and to present the stimulus exactly at the predefined retinal location. The results can be displayed over a fundus image. Microperimetry has been used clinically for the assessment of the sensitivity of the macular region in eyes with retinal and choroidal diseases,2–6 glaucoma,7,8 and in other subspecialties of ophthalmology including visual rehabilitation.
The scanning laser ophthalmoscope (SLO; Rodenstock Instruments, Munich, Germany) has been used to measure the central retinal sensitivity. Recently, new instruments for microperimetry, such as Microperimeter-1 (MP-1; Nidek Technologies, Padova, Italy), Macular Integrity Assessment (MAIA; CenterVue, Padova, Italy), and the Optos OCT SLO (Optos plc, Dunfermline, UK) have been developed. The newest instrument, Microperimeter-3 (MP-3; Nidek Technologies) is now available.
The clinical use of microperimetry has increased, and it is important to understand the characteristics of the algorithm of measurements to assess the results of the macular sensitivity. A number of studies have compared the retinal sensitivity measured by different microperimeters and a conventional automatic perimeter in normal subjects.9–13 The advanced microperimeters can measure a wider range of retinal sensitivities than earlier models.
The purpose of this study was to determine the differences of the retinal sensitivity obtained by MP-3 using two different fixation targets: a single cross (Cr) of 1 degree size and a circle (Ci) of 1 degree radius in normal individuals.
Subjects and methods
Participants
This study was performed on 32 eyes of 16 healthy Japanese volunteers (6 women, 10 men) with a mean age of 28.9±1.4 years (range 24–44 years). Both eyes were studied. The exclusion criteria were history of ocular or systemic diseases, refractive error more than −6 diopters (D), and a best-corrected visual acuity less than 20/20 (Table 1).
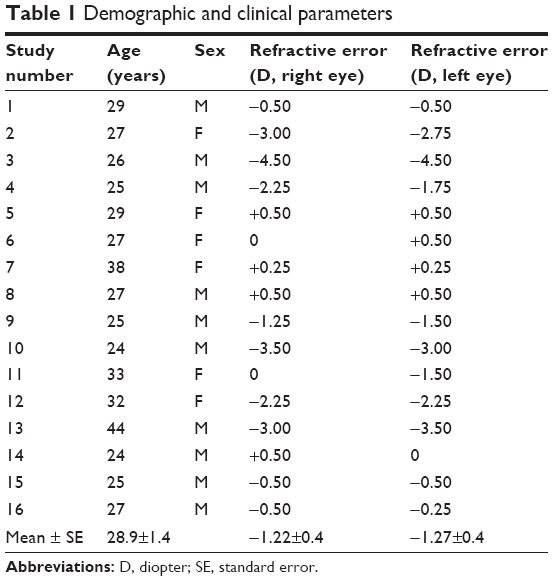 | Table 1 Demographic and clinical parameters |
This study was approved by the Institutional Review Board of Chiba University Graduate School of Medicine and conducted in accordance with the tenets of the Declaration of Helsinki. Written informed consent was obtained from each participant prior to enrollment in the study.
Perimetric examinations
Microperimetry was performed on all subjects with MP-3 (Nidek, software version 1.1.1) in a dark room without pupillary dilation. The Goldmann III size white stimulus with a luminance of 1.0 cd/m2 and a duration of 200 ms was projected onto a white background. The stimulus intensity ranged from 0 dB (3,193.1 cd/m2) to 34 dB (11.3 cd/m2), and the light threshold was determined by a 4–2 staircase strategy.
The retinal sensitivity within the central 2 degrees was measured using two different fixation targets. We used a Ci fixation target of 1 degree radius, which overlaps stimuli that are presented in the central 2 degrees. We also used a Cr fixation target which overlaps the central 0 degrees. Therefore, we measured the retinal sensitivity of the central 0 degrees and central 2 degrees independently. The sensitivity at the central 0 degrees was determined at one point and that at the central 2 degrees was determined by averaging 8 points excluding the central point. The findings were used for the statistical analyses.
A single 1 degree Cr and a Ci of 1 degree radius were used as the fixation targets (Figure 1). Four examinations were performed, and 3–5 min was required for each test. They included 1) right eye with the Ci target, 2) right eye with the Cr target, 3) left eye with the Ci target, and 4) left eye with the Cr target. To test the effects of learning and fatigue, the subjects were randomly divided into 2 groups according to the test order. The test protocol for Group 1 included the measurement of the retinal sensitivity with a Ci fixation target followed by test with a Cr fixation target. For Group 2, the measurements were made first with a Cr fixation target followed by measurements with the Ci fixation target.
 | Figure 1 Patterns of the fixation target and the locations of the stimuli. |
Fixation stability
To assess the fixation stability, the fundus movements were recorded during the examinations. The degree of movements of the fixation points were automatically classified into three groups: “stable” if more than 75% of the fixation points were within the central 2 degrees; “relatively unstable” when less than 75% of the fixation points were located within the central 2 degrees but more than 75% of the fixation points were located within the central 4 degrees; and “unstable” when fewer than 75% of the fixation points were located within the central 4 degrees (Figure 1).
Statistical analyses
Wilcoxon signed-rank tests were used to determine the significance of the differences in retinal sensitivity and fixation stability between the Cr and Ci fixation targets. A P-value <0.05 was considered to be statistically significant.
Results
The mean retinal sensitivities of the 32 eyes are shown in Table 2. The central retinal sensitivity with the Ci was significantly higher than that with the Cr (P=0.003 for right eyes; P=0.001 for left eyes) fixation targets. The mean retinal sensitivity within the central 2 degrees was not significantly different between the Cr and Ci targets (P=0.07 in the right eyes, P=0.08 in the left eyes). A representative case is shown in Figure 2.
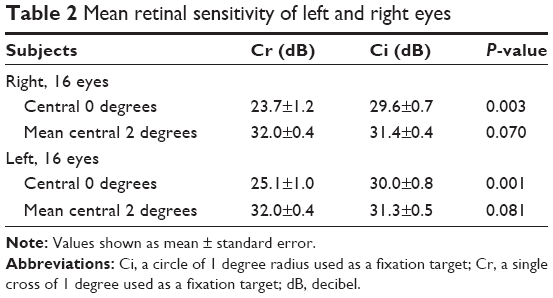 | Table 2 Mean retinal sensitivity of left and right eyes |
 | Figure 2 Retinal sensitivity measured using different targets in the same left eye. |
In the eyes of Group 1, the retinal sensitivity was measured first using the Ci fixation target and then with the Cr fixation target. For both eyes, the mean central retinal sensitivity at 0 degrees was significantly higher with Ci fixation target (P=0.028, right eyes; P=0.040, left eyes) (Table 3). For the eyes of Group 2, the retinal sensitivity was measured first using the Cr fixation target. For both eyes, the mean central retinal sensitivity at 0 degrees were significantly higher with the Ci fixation target (P=0.036, right eyes; P=0.018, left eyes) (Table 4).
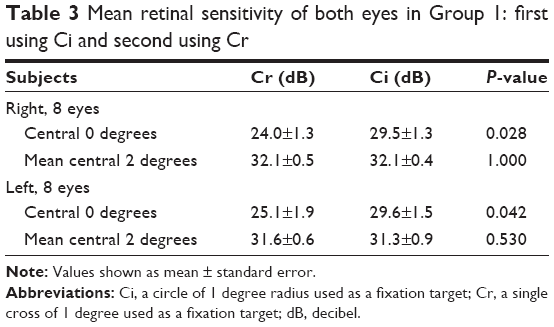 | Table 3 Mean retinal sensitivity of both eyes in Group 1: first using Ci and second using Cr |
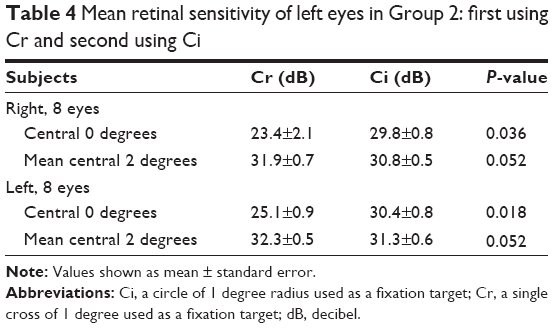 | Table 4 Mean retinal sensitivity of left eyes in Group 2: first using Cr and second using Ci |
These findings indicated that the retinal sensitivity of the central 0 degrees was higher with Ci fixation target and that of 2 degrees was not different between with the Ci and Cr fixation targets regardless of the order of the tests.
The percentage of fixations within the central 2 degrees was 99.8%±0.08% for the eyes measured using the Cr fixation target and 99.7%±0.1% for the eyes measured using the Ci fixation target. All fixations were determined as “stable”. The differences in the fixation stability between Cr and Ci fixation targets were not statistically significant (P=0.13).
Discussion
We measured the retinal sensitivity of normal eyes with the MP-3 instrument using two different fixation targets. The central retinal sensitivity using the Ci fixation target was significantly better than that using a Cr fixation target. The average retinal sensitivity at the central 2 degrees was not significantly different between the Cr and Ci fixation targets. The higher sensitivity with the Ci fixation target did not change regardless of the order of testing.
The differences in the retinal sensitivity between the two fixation targets may be caused by an overlap of the stimulus spot over the fixation target. The retinal sensitivity was reported to be influenced by age,13,15 axial length,16 and background luminance.13,17 On the other hand, Fujiwara et al13 and Denniss and Astle14 reported that the sensitivity of the parafoveal retina area was higher than that at the central 0 degrees in normal individuals. Fujiwara et al13 suggested that the difference was partly explained by low background luminance. On the other hand, Denniss et al14 reported that the difference could be explained by the masking effect caused by the nearby fixation target. This is a critical point because the cross target has been used in many studies on retinal sensitivity in various retinal diseases.18–21 Our results showed that the retinal sensitivity near the foveal center was lower when the cross target was used.
MP-3 has about 10 times higher background luminance than MAIA, and we still observed the low sensitivity at central 0 degrees even with brighter background which increased cone photoreceptors activity. Although it is difficult to compare our findings using MP-3 with those of previous reports that used MP-1 and MAIA instruments, the overlapping of light stimuli and fixation target makes it difficult to detect the stimuli and results in lower retinal sensitivity.
Previous studies used the central retinal sensitivity to evaluate the central retinal function. Wu et al22 reported the relationship between the inner-segment ellipsoid integrity and retinal sensitivity at the central 0 degrees in eyes with age-related macular degeneration. On the other hand, Chen et al23 reported that the central retinal sensitivity was related to the length and area of the preoperative photoreceptor inner/outer segment defects in eyes with a macular hole. We recommend that the authors state the type of fixation target that was used because the retinal sensitivity might be changed with the fixation target.
The limitations in this study were a small sample size, relatively young healthy volunteers, and having high fixation stability. It is difficult to determine the relationship between the retinal sensitivity and the fixation target in patients with macular disease and further studies are needed.
Conclusion
We measured the retinal sensitivity of normal eyes using two different fixation targets. The central retinal sensitivity using a Ci fixation target was significantly higher than that using a Cr fixation target. The differences of the retinal sensitivity were probably due to fixation targets overlapping the stimuli. These results indicate that the size and shape of the fixation target must be considered according to the specific purpose of the evaluation. For instance, if the examiner is interested in the central retinal sensitivity at 0 degree, the Ci fixation target should be used for better accuracy.
Acknowledgments
This work was supported by JSPS KAKENHI (Grant Number JP16K11280). The authors thank Professor Duco Hamasaki of the Bascom Palmer Eye Institute of the University of Miami for his critical discussion and editing the final manuscript.
The abstract of this paper was presented at the European Association for Vision and Eye Research (EVER) 2015 Congress as a poster presentation with interim findings. The poster’s abstract was published in “Poster Abstracts” in Abstract book EVER 2015: https://www.ever.be/~/media/Files/2015/EVER-2015-abstractbook/EVER2015abstractbookweb.pdf?la=en.
Disclosure
The authors report no financial support or financial conflicts of interest in the design and conduct of study, collection of data, management, analysis and interpretation of data, preparation, review, and approval of the manuscript, and no conflicts of interest in this work.
References
Rohrschneider K, Bultmann S, Springer C. Use of fundus perimetry (microperimetry) to quantify macular sensitivity. Prog Retin Eye Res. 2008;27(5):536–548. | ||
Yodoi Y, Tsujikawa A, Kameda T, et al. Central retinal sensitivity measured with the micro perimeter 1 after photodynamic therapy for polypoidal choroidal vasculopathy. Am J Ophthalmol. 2007;143(6):984–994. | ||
Sekine A, Imasawa M, Iijima H. Retinal thickness and perimetric sensitivity in central serous chorioretinopathy. Jpn J Ophthalmol. 2010;54(6):578–583. | ||
Ooka E, Mitamura Y, Baba T, Kitahashi M, Oshitari T, Yamamoto S. Foveal microstructure on spectral-domain optical coherence tomographic images and visual function after macular hole surgery. Am J Ophthalmol. 2011;152(2):283–290. | ||
Fujita K, Shinoda K, Matsumoto CS, et al. Microperimetric evaluation of chronic central serous chorioretinopathy after half-dose photodynamic therapy. Clin Ophthalmol. 2012;6:1681–1687. | ||
Baba T, Sato E, Oshitari T, Yamamoto S. Regional reduction of ganglion cell complex after vitrectomy with internal limiting membrane peeling for idiopathic macular hole. J Ophthalmol. 2014;2014:372589. | ||
Kameda T, Tanabe T, Hangai M, Ojima T, Aikawa H, Yoshimura N. Fixation behavior in advanced stage glaucoma assessed by the MicroPerimeter MP-1. Jpn J Ophthalmol. 2009;53(6):580–587. | ||
Orzalesi N, Miglior S, Lonati C, Rosetti L. Microperimetry of localized retinal nerve fiber layer defects. Vision Res. 1998;38(5):763–771. | ||
Rohrschneider K, Becker M, Schumacher N, Fendrich T, Volcker HE. Normal values for fundus perimetry with the scanning laser ophthalmoscope. Am J Ophthalmol. 1998;126(1):52–58. | ||
Springer C, Bultmann S, Volcker HE, Rohrschneider K. Fundus perimetry with the Micro Perimeter 1 in normal individuals: comparison with conventional threshold perimetry. Ophthalmology. 2005;112(5):848–854. | ||
Midena E, Vujosevic S, Cavarzeran F, Microperimetry Study G. Normal values for fundus perimetry with the microperimeter MP1. Ophthalmology. 2010;117(8):1571–1576. | ||
Acton JH, Bartlett NS, Greenstein VC. Comparing the Nidek MP-1 and Humphrey field analyzer in normal subjects. Optom Vis Sci. 2011;88(11):1288–1297. | ||
Fujiwara A, Shiragami C, Manabe S, Izumibata S, Murata A, Shiraga F. [Normal values of retinal sensitivity determined by macular integrity assessment]. Nippon Ganka Gakkai zasshi. 2014;118(1):15–21. Japanese. | ||
Denniss J, Astle AT. Central perimetric sensitivity estimates are directly influenced by the fixation target. Ophthalmic Physiol Opt. 2016;36(4):453–458. | ||
Rohrschneider K, Fendrich T, Becker M, Krastel H, Kruse FE, Volcker HE. Static fundus perimetry using the scanning laser ophthalmoscope with an automated threshold strategy. Graefes Arch Clin Exp Ophthalmol. 1995;233(12):743–749. | ||
Qin Y, Zhu M, Qu X, et al. Regional macular light sensitivity changes in myopic Chinese adults: an MP1 study. Invest Ophthalmol Vis Sci. 2010;51(9):4451–4457. | ||
Harrison ER. Visual acuity and the cone cell distribution of the retina. Br J Ophthalmol. 1953;37(9):538–542. | ||
Okada K, Yamamoto S, Mizunoya S, Hoshino A, Arai M, Takatsuna Y. Correlation of retinal sensitivity measured with fundus-related microperimetry to visual acuity and retinal thickness in eyes with diabetic macular edema. Eye (Lond). 2006;20(7):805–809. | ||
Wakabayashi T, Ikuno Y, Sayanagi K, Soga K, Oshima Y, Tano Y. Fundus autofluorescence related to retinal morphological and functional changes in idiopathic macular holes. Acta Ophthalmol. 2008;86(8):897–901. | ||
Mitamura Y, Aizawa S, Baba T, Hagiwara A, Yamamoto S. Correlation between retinal sensitivity and photoreceptor inner/outer segment junction in patients with retinitis pigmentosa. Br J Ophthalmol. 2009;93(1):126–127. | ||
Schmitz-Valckenberg S, Ong EE, Rubin GS, et al. Structural and functional changes over time in MacTel patients. Retina. 2009;29(9):1314–1320. | ||
Wu Z, Ayton LN, Luu CD, Guymer RH. Relationship between retinal microstructures on optical coherence tomography and microperimetry in age-related macular degeneration. Ophthalmology. 2014;121(7):1445–1452. | ||
Chen WC, Wang Y, Li XX. Morphologic and functional evaluation before and after successful macular hole surgery using spectral-domain optical coherence tomography combined with microperimetry. Retina. 2012;32(9):1733–1742. |
 © 2017 The Author(s). This work is published and licensed by Dove Medical Press Limited. The
full terms of this license are available at https://www.dovepress.com/terms
and incorporate the Creative Commons Attribution
- Non Commercial (unported, 3.0) License.
By accessing the work you hereby accept the Terms. Non-commercial uses of the work are permitted
without any further permission from Dove Medical Press Limited, provided the work is properly
attributed. For permission for commercial use of this work, please see paragraphs 4.2 and 5 of our Terms.
© 2017 The Author(s). This work is published and licensed by Dove Medical Press Limited. The
full terms of this license are available at https://www.dovepress.com/terms
and incorporate the Creative Commons Attribution
- Non Commercial (unported, 3.0) License.
By accessing the work you hereby accept the Terms. Non-commercial uses of the work are permitted
without any further permission from Dove Medical Press Limited, provided the work is properly
attributed. For permission for commercial use of this work, please see paragraphs 4.2 and 5 of our Terms.