Back to Journals » Diabetes, Metabolic Syndrome and Obesity » Volume 13
Differences in the Association Among the Vitamin D Concentration, Dietary Macronutrient Consumption, and Metabolic Syndrome Depending on Pre- and Postmenopausal Status in Korean Women: A Cross-Sectional Study
Authors Chun H ![]() , Kim GD
, Kim GD ![]() , Doo M
, Doo M ![]()
Received 6 August 2020
Accepted for publication 3 September 2020
Published 9 October 2020 Volume 2020:13 Pages 3601—3609
DOI https://doi.org/10.2147/DMSO.S275847
Checked for plagiarism Yes
Review by Single anonymous peer review
Peer reviewer comments 2
Editor who approved publication: Prof. Dr. Juei-Tang Cheng
Hyejin Chun, 1 Gi Dae Kim, 2 Miae Doo 3
1Department of Family Medicine, CHA Bundang Medical Center, CHA University, Seongnam, Gyeonggi, 13496, Republic of Korea; 2Department of Food and Nutrition, Kyungnam University, Changwon, Gyeongnam 51767, Republic of Korea; 3Department of Food and Nutrition, Kunsan National University, Gunsan, Jeonbuk 54150, Republic of Korea
Correspondence: Miae Doo
Department of Food and Nutrition, Kunsan National University, Daehak-Ro 558, Gunsan, Jeonbuk 54150, Republic of Korea
Tel +82-63-469-4635
Fax +82-63-469-2085
Email [email protected]
Background and Objectives: To assess whether the consumption of dietary macronutrient could change metabolic syndrome (MetS) related to vitamin D deficiency according to menopausal status.
Methods and Study Design: In a cross-sectional study of 8326 Korean women from the Korean National Health and Nutrition Examination Survey V (2010– 2012), we investigated the combined interaction effect of serum 25-hydroxyvitamin D [25(OH)D] concentration and menopausal status on MetS-related variables.
Results: The prevalence rates of 25(OH)D deficiency (vitamin D < 50 nmol/L) among premenopausal and postmenopausal women were 84.5% and 67.9%, respectively. Significant differences in MetS-related variables such as body mass index (P< 0.001), waist circumference (P=0.005), fast glucose (P=0.048), triglycerides (P=0.001), and high-density lipoprotein cholesterol (P=0.027) based on 25(OH)D concentration were observed among postmenopausal women but not among premenopausal women. Among the postmenopausal women with high consumption of dietary carbohydrate, the adjusted odds ratios (ORs) [95% confidence intervals (95% CIs)] of MetS among participants with 25(OH)D deficiency increased 1.380-fold (95% CI = 1.086– 1.753) using the 25(OH)D-sufficient group as a reference. In contrast, the participants with 25(OH)D deficiency showed an increased risk of MetS [OR (95% CI) = 1.313 (1.041– 1.655)] with low-fat consumption. However, the aforementioned findings did not differ among premenopausal women.
Conclusion: Thus, MetS due to 25(OH)D deficiency among postmenopausal women may be modified by the consumption of dietary macronutrient.
Keywords: dietary macronutrient, Korean national health and nutrition examination survey, menopausal status, metabolic syndrome, vitamin D
Corrigendum for this paper has been published
Introduction
The prevalence of vitamin D deficiency has increased worldwide and is recognized as a public health concern.1 Vitamin D deficiency is associated with many chronic diseases, including obesity, hypertension, metabolic syndrome (MetS), cardiovascular disease, and some cancers.2–4 In particular, vitamin D levels have been reported to influence the risk of MetS in many studies.2,5–7
After menopause, it is common to observe low concentrations of vitamin D among women.8 In addition, postmenopausal women are at high risk of MetS due to a decrease in estrogen levels.5–7 Some studies have shown an association between MetS variables and low levels of serum vitamin D in postmenopausal women.5–7 Postmenopausal women with low vitamin D status had a significantly increased risk of MetS and an increase in MetS variables, such as abdominal obesity, elevated blood pressure (BP), triglyceride (TG) levels, abnormal fasting glucose (FG) homeostasis, and decreased high-density lipoprotein cholesterol (HDL-C).
Diet is a very important factor for preventing or controlling MetS. It is well established that restricted-calorie diets and traditional dietary patterns, such as the Mediterranean diet and the Dietary Approaches to Stop Hypertension (DASH) diet, can improve MetS-related variables or ameliorate the risk of MetS.9–11 However, these dietary approaches are difficult to maintain for long periods until positive health outcomes associated with MetS occur, and based on previous studies, these dietary patterns are difficult for other races or nations to implement. In contrast, dietary macronutrient composition has been reported as a new strategy to address the problems of obesity and MetS.9,12,13 Low dietary carbohydrates (CHOs) and high dietary proteins, based on compositions independent of total dietary energy, have been shown to have positive effects on body weight, fat mass, and BP, HDL-C, and TG levels in the long term in meta-analysis studies.12,13
Although some studies have shown a significant association between blood vitamin D deficiency and MetS or MetS variables in postmenopausal women, the modification of those associations via dietary macronutrients has not been clarified. Therefore, the aim of this study was to examine the how the interaction between 25-hydroxyvitamin D [25(OH)D] concentration and MetS-related variables was different by menopausal status. This study also determined whether these differences were influenced by the macronutrient consumption among women in the Korean National Health and Nutrition Examination Survey (KNHANES).
Methods
Study Design and Participant Selection
This study used data from the KNHANES V (2010–12), which is a nationally representative cross-sectional survey conducted by the Korean Centers for Disease Control and Prevention (KCDC).14 The KNHANES was carried out to investigate the relationship between the health and nutritional status of selected noninstitutionalized civilians from the South Korean population using a complex and stratified multistage probability clustered sampling design. From a total of 25,534 participants (11,616 men and 13,918 women) in KNHANES V (2010–12), 8326 women participants over the age of 19 years with a plausible consumption of daily energy and no missing or inadequate data were selected for this study. All participants provided written informed consent, and this study was approved by the Institutional Review Board of the Kunsan National University (IRB No. 1040117-201811-HR-023-01).
Data Collection
The general characteristics, anthropometric and blood biochemical variables, and dietary consumption data were collected from the KNHANES data. Anthropometric and blood biochemical variables from the health examination were assessed using a direct measurement method. From the health interview, information regarding the general characteristics of the participants were collected using a self-reported method, and dietary macronutrient consumption data were collected by a trained nutritionist.
Anthropometric variables, including height, body weight, and waist circumference (WC), were measured using standardized methods. Body mass index (BMI) was calculated by dividing the body weight (kg) by the squared height (m2), and the definition of obesity, based on the Korean Society for the Study of Obesity, was BMI >25 kg/m2.15
BP, including systolic blood pressure (SBP) and diastolic blood pressure (DBP), was assessed using a mercury sphygmomanometer while the participant was in a seated position. The FG, TG, total cholesterol (TC), and HDL-C concentrations were measured using a Hitachi automatic analyzer 7600 (Hitachi, Tokyo, Japan) in a certified clinical laboratory. As a marker of vitamin D status, the concentration of 25(OH)D (total measurement of 25(OH)D2 and 25(OH)D3) was analyzed by a radioimmunoassay kit (DiaSorin, Stillwater, Minnesota, USA) using a 1470 WIZARD gamma-counter (PerkinElmer, Turku, Finland). To maintain the quality control for 25 (OH) D, the KCDC continuously monitored and checked through internal and external quality control. The internal quality control was evaluated as the precision and accuracy of an analysis system by the mean, standard deviation (SD), and coefficient of variation (CV%) through the Westgard multi-rule control method. Additionally, external quality control was evaluated according to the Vitamin D Quality Assessment Scheme (DEQAS), Vitamin D Metabolites Quality Assurance Program (VitDQAP) of the National Institute of Standards and Technology (NIST), and Accuracy-based Vitamin D survey of College of American Pathologists (CAP). Additionally, 25(OH)D deficiency was indicated by a 25(OH)D concentration <50 nmol/L (20 ng/mL), and a sufficient 25(OH)D concentration was indicated by a concentration ≥50 nmol/L (21 ng/mL) based on the Institute of Medicine.16
MetS status, with the exception of central obesity, was determined based on the US National Cholesterol Education Program/Adult Treatment Panel III (NCEP/ATP III).17 As ethnic-specific cutoff point of WC was defined as central obesity, WC was determined based on the Korean Society for the Study of Obesity (≥90 cm for men and ≥85 cm for women).18 Accordingly, MetS was defined if three or more of the following diagnostic criteria were met: 1) WC ≥85 cm, 2) TGs ≥150 mg/dL or receiving treatment for high TGs, 3) HDL-C <50 mg/dL or receiving treatment for low HDL-C, 4) BP ≥130/85 mmHg or receiving treatment for high BP, and 5) FG ≥100 mg/dL or receiving treatment for hyperglycemia.
Menopausal status was classified as “premenopausal (regular menstruation for the past 12 consecutive months)” or “postmenopausal (absence of menstruation for over 12 consecutive months)” according to self-reported menstrual cycle patterns.
The consumption of dietary macronutrients was assessed using a single 24-h recall record method.19 Highly trained dietitians conducted a nutrition survey through face-to-face interviews. Daily nutrient consumption including carbohydrates, proteins, and fat was estimated based on the food composition database published by the Rural Development Administration of Korea.20 The percentage of total daily energy from CHOs, protein, and fat was divided by the median values as follows: CHOs: 65.61%, protein: 14.22%, and fat: 19.47% for premenopausal women; CHOs: 76.14%, protein: 12.82%, and fat: 11.92% for postmenopausal women.
Statistical Analyses
All statistical analyses used the sample weights provided to reflect estimates of the entire Korean population. To evaluate the general characteristics by 25(OH)D concentrations or menopausal status, categorical variables were assessed using Pearson’s chi-squared test, whereas continuous variables were assessed using independent-samples t-tests. The MetS-related variables, menopausal status, and dietary macronutrient consumption based on 25(OH)D concentrations after adjustment for covariates were assessed using generalized linear models. To prevent confounding effects, socioeconomic variables (age, education level, family living together, and monthly household income) and health-related variables (current smoking status, alcohol consumption status, dietary supplement use, subjective stress, and physical activity) were adjusted as covariates. After data were divided by menopausal status, generalized linear models were used to analyze the effects of 25(OH)D on MetS-related variables and macronutrient consumption as well as the interaction between menopausal status and 25(OH)D with respect to the MetS-related variables and macronutrient consumption after adjusting for covariates. The risk for obesity or MetS depending on menopausal status was determined using a multinomial logistic regression model after adjusting for covariates. To determine the combined effect of menopausal status and 25(OH)D concentration based on dietary macronutrient consumption on obesity or MetS, a multinomial logistic regression model adjusted for covariates was used. The odds ratios (ORs) and 95% confidence intervals (CIs) for obesity or MetS were estimated in reference to a 25(OH)D concentration ≥50 nmol/L and the consumption level of dietary macronutrients according to menopausal status. Statistical significance was considered for p-values <0.05. All statistical analyses were performed using SPSS (version 24.0; IBM Corp., Armonk, NY, USA) software for Windows.
Results
The general characteristics of the participants according to 25(OH)D concentration are listed in Table 1. The subjects’ average age and 25(OH)D concentration were 46.13 years and 40.86 nmol/L, respectively. The prevalence of postmenopausal women in the 25(OH)D-sufficient and 25(OH)D-deficient groups was 58.2% and 35.1%, respectively (P<0.001). The average age was significantly higher in the 25(OH)D-sufficient group than in the 25(OH)D-deficient group (p<0.001). Significant differences according to 25(OH)D concentration were observed in regard to education level (p<0.001), living together with family (p<0.001), subjective stress (p<0.001), alcohol consumption (p<0.001), smoking (p=0.009), dietary supplement use (p<0.001), and household income (p<0.001).
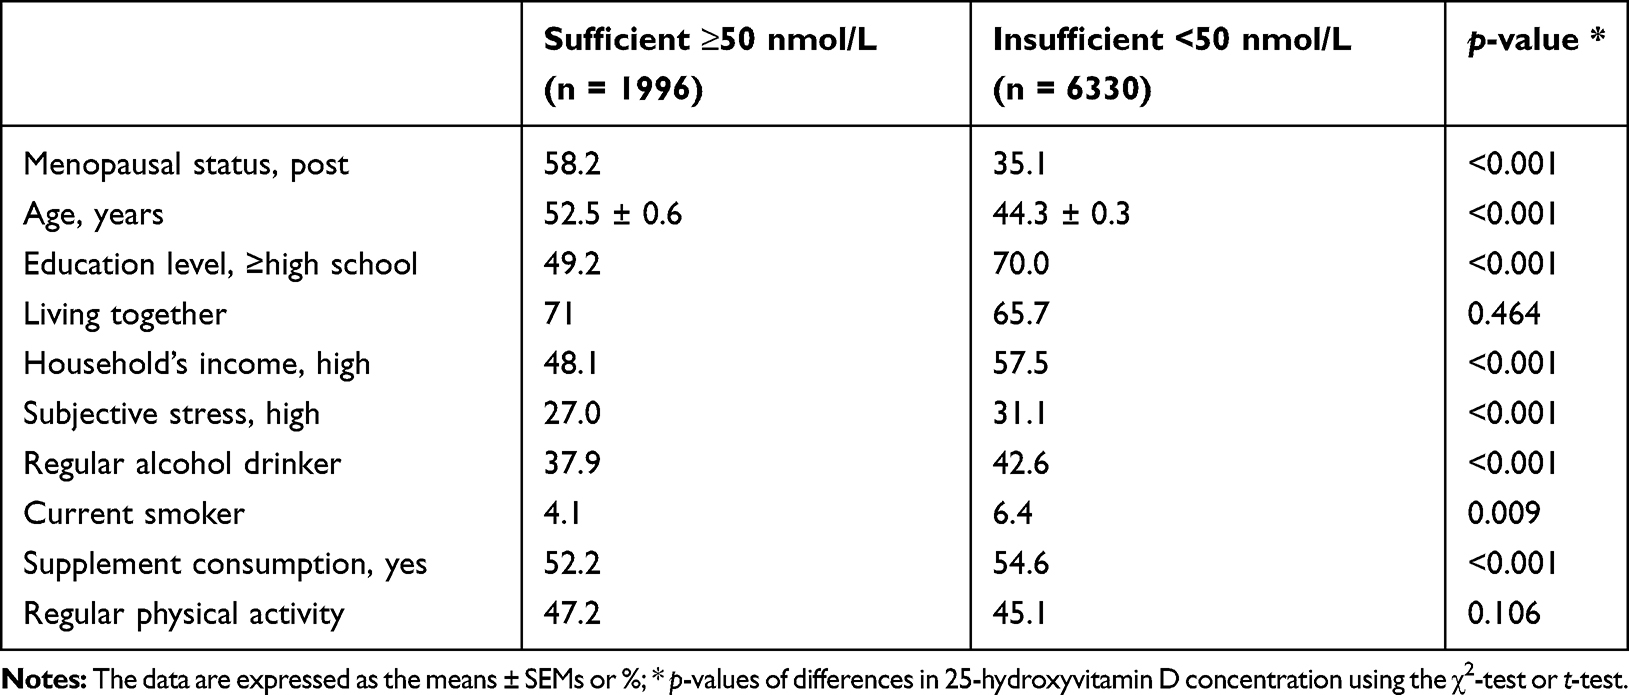 |
Table 1 General Characteristics |
The MetS-related variables and dietary macronutrient consumption according to 25(OH)D concentration after controlling for covariates are shown in Table 2. There were significant differences in MetS-related variables between the 25(OH)D-sufficient and 25(OH)D-insufficient groups. The variables of BMI (p=0.001), FG (p=0.009), and TGs (p<0.001) were significantly higher and HDL-C (p=0.003) was significantly lower in the 25(OH)D-insufficient group than in the 25(OH)D-sufficient group. However, dietary macronutrient consumption according to 25(OH)D concentration was not significantly different after controlling for covariates.
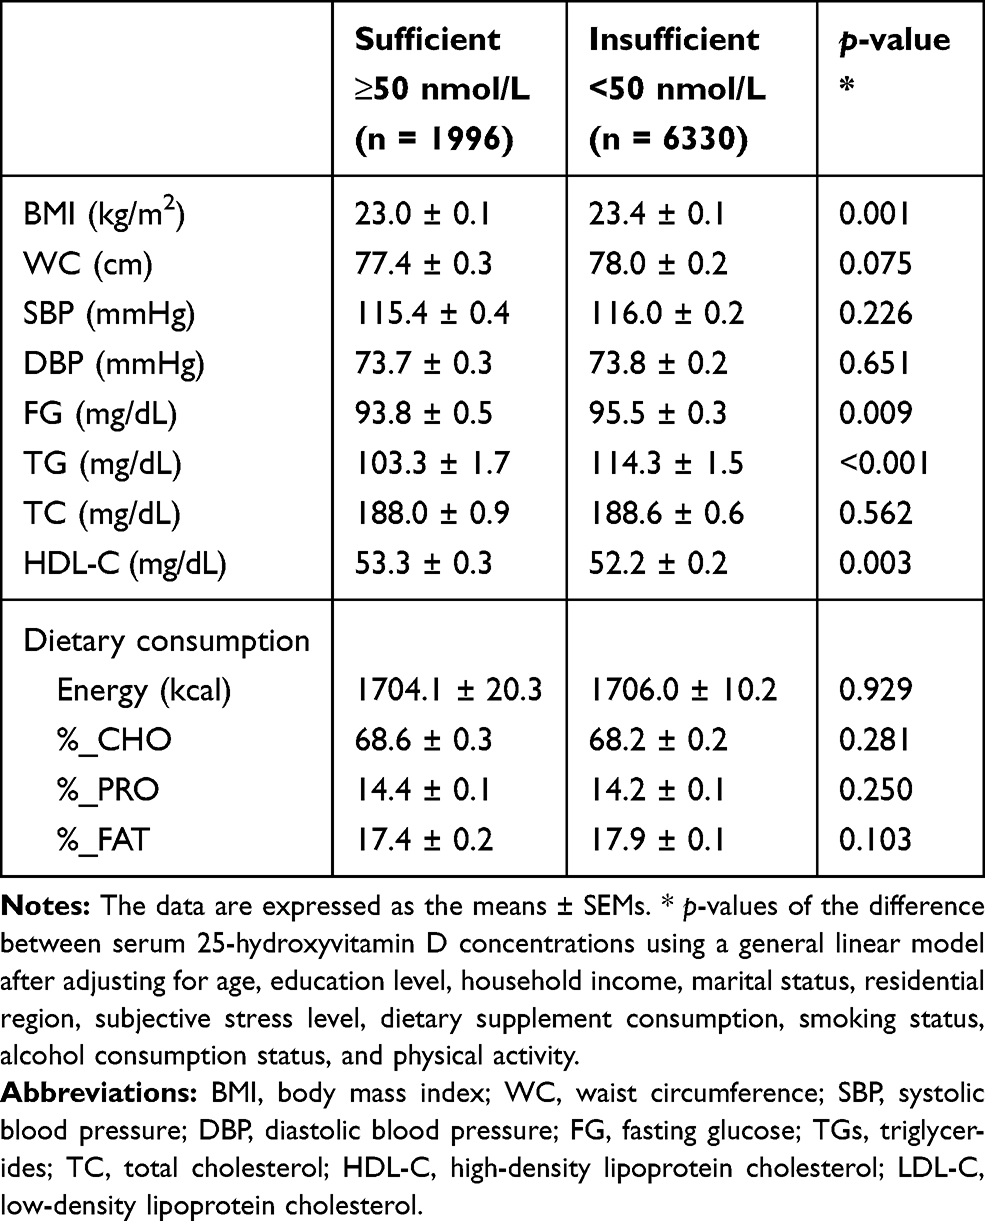 |
Table 2 Metabolic Syndrome-Related Variables and Dietary Macronutrient Consumption According to 25-Hydroxyvitamin D Concentration |
The combined effect of menopausal status and 25(OH)D concentration on MetS-related variables and dietary macronutrient consumption were assessed using a general linear model and a multivariate logistic regression model after controlling for covariates (Table 3 and Figure 1). Significant differences in the MetS-related variables according to 25(OH)D concentration were observed among postmenopausal women but not among premenopausal women. The postmenopausal women in the 25(OH)D-insufficient group had significantly higher BMIs (24.52 ± 0.10 kg/m2 vs 23.95 ± 0.11 kg/m2, p <0.001) and WCs (82.66 ± 0.26 cm vs 81.39 ± 0.40 cm, p=0.005) than the participants in the 25(OH)D-sufficient group after controlling for covariates. Additionally, FG (101.57 ± 0.67 mg/dL vs 99.60 ± 0.70 mg/dL, p =0.048) and TGs (140.66 ± 2.08 mg/dL vs 130.14 ± 2.41, p =0.001) were higher among postmenopausal women in the 25(OH)D-insufficient group than among women in the 25(OH)D-sufficient group. However, the concentration of HDL-C among postmenopausal women in the 25(OH)D-insufficient group (49.44 ± 0.27 mg/dL) was lower than that of women in the 25(OH)D-sufficient group (50.46 ± 0.39 mg/dL) (p=0.027). On the other hand, there were no differences in MetS-related variables, except TG (p=0.001), according to 25(OH)D concentration among premenopausal women. Dietary macronutrient consumption according to 25(OH)D concentration did not show significant differences between premenopausal and postmenopausal women. A significant interaction between menopausal status and 25(OH)D was related to the risk of obesity and MetS (p-interaction <0.01). Using the 25(OH)D-sufficient group as a reference, the adjusted odds ratio for obesity and MetS of the participants in the 25(OH)D-insufficient group increased by 1.335- (95% CI = 1.105–1.617) and 1.263-times (95% CI = 1.059–1.507), respectively, among the postmenopausal women, whereas this increase was not observed among the premenopausal women (Figure 1).
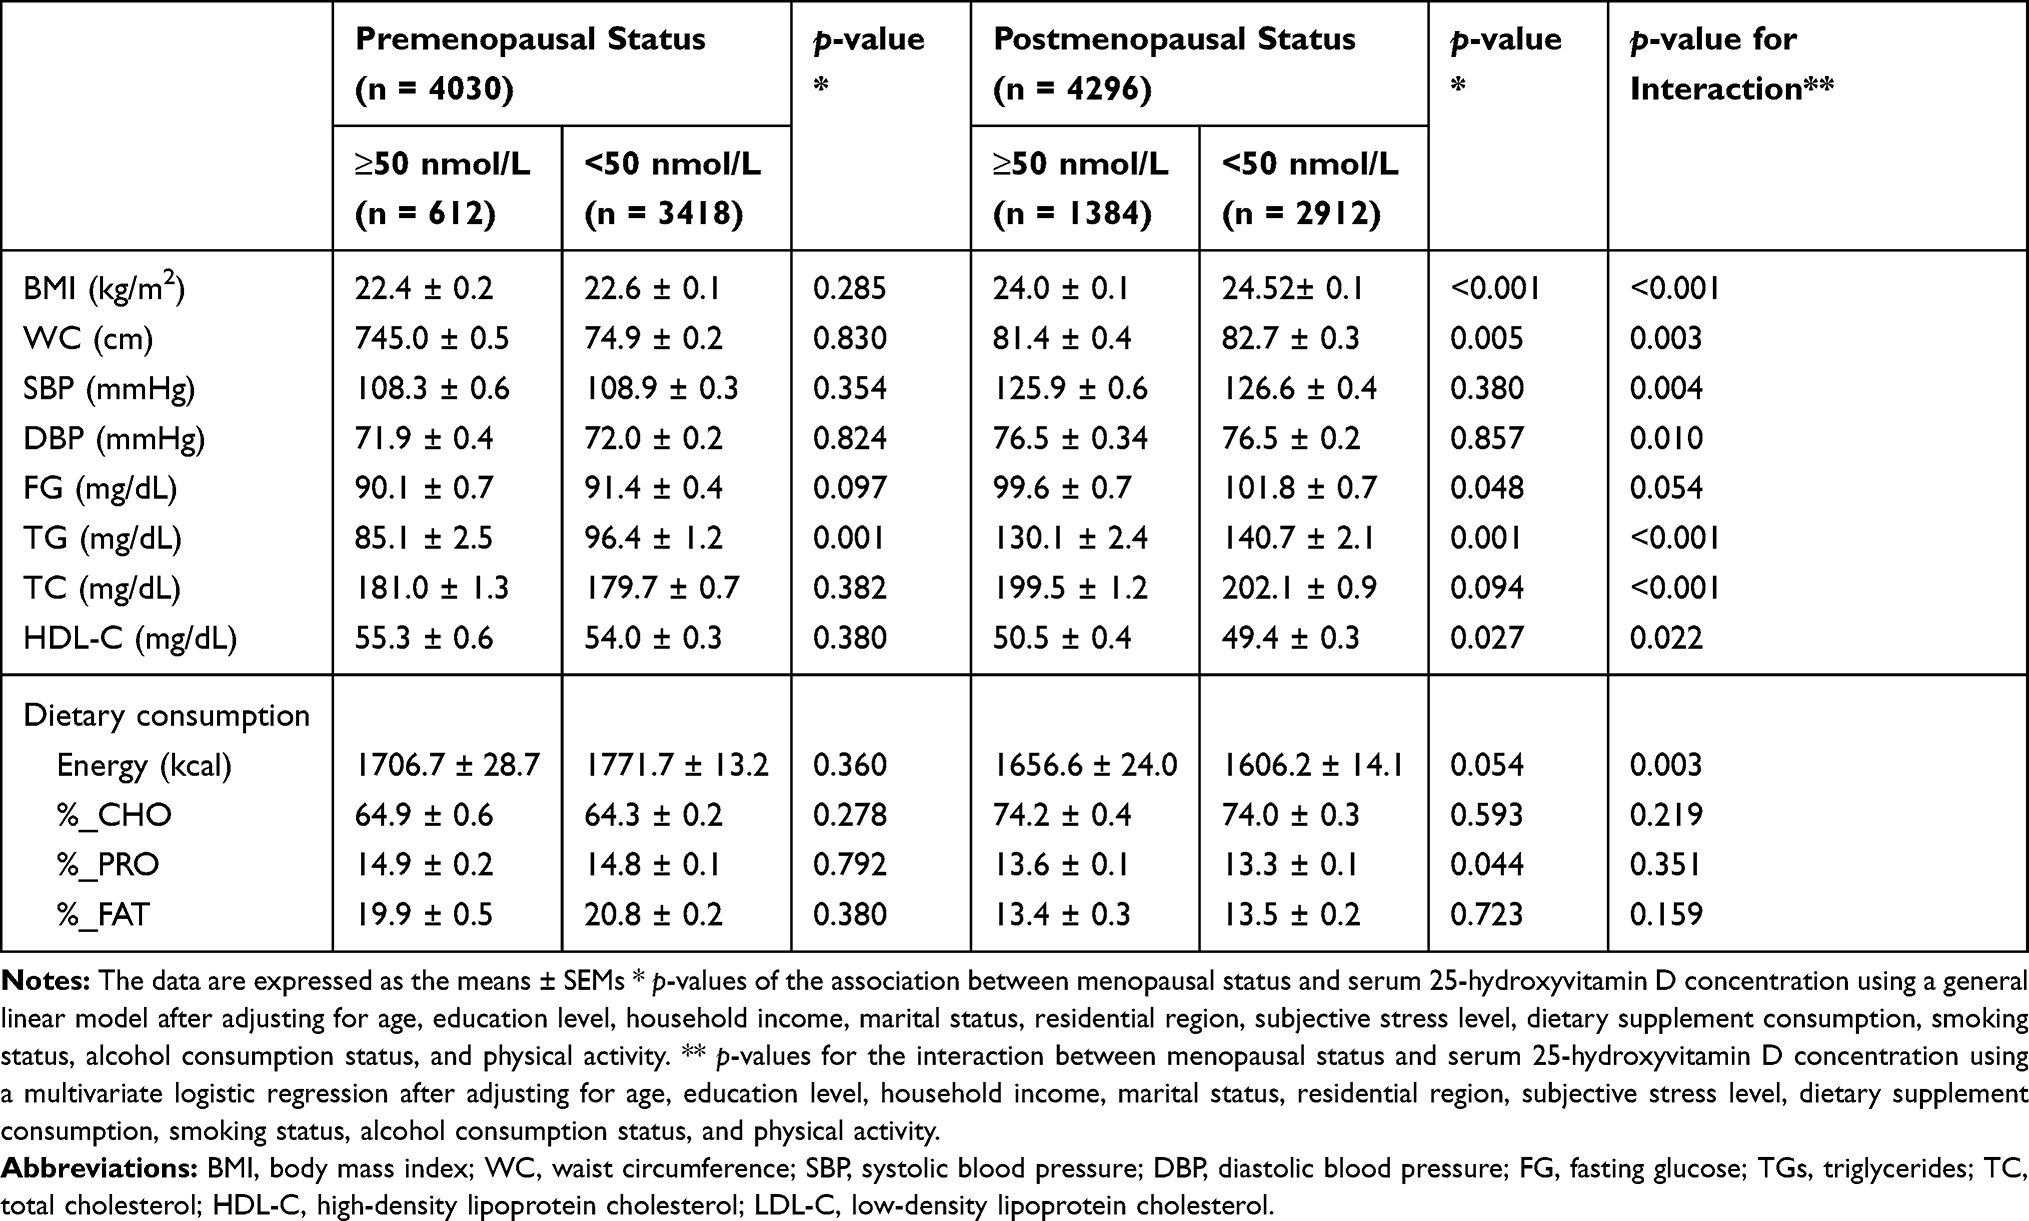 |
Table 3 Metabolic Syndrome-Related Variables and Dietary Macronutrient Consumption According to Menopausal Status and 25-Hydroxyvitamin D Concentration |
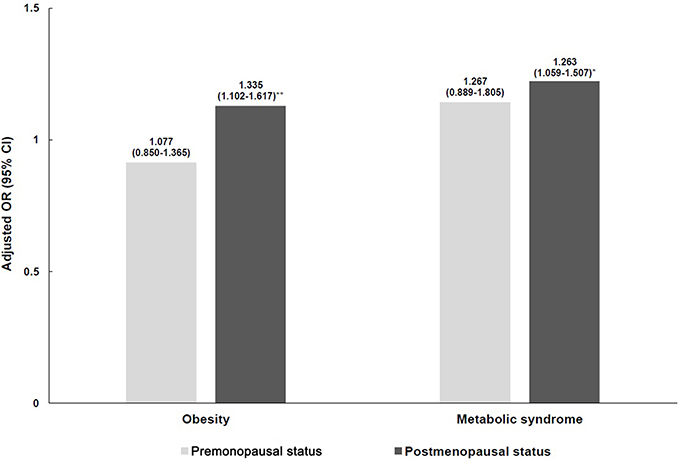 |
Figure 1 Adjusted odds ratio for obesity and metabolic syndrome according to menopausal status and 25-hydroxyvitamin D concentration. Obesity was defined as BMI ≥25.0 kg/m2 by the Korean Society for the Study of Obesity. Metabolic syndrome was defined if ≥ 3 following diagnostic criteria by the modified National Cholesterol Education Program/Adult Treatment Panel III: 1) WC ≥85 cm according to the Korean Society for the Study of Obesity, 2) TGs ≥150 mg/dL or receiving treatment for high TGs, 3) HDL-C <50 mg/dL or receiving treatment for low HDL-C, 4) BP ≥130/85 mmHg or receiving treatment for high BP, and 5) FG ≥100 mg/dL or receiving treatment for hyperglycemia. The odds ratios (95% confidence intervals) were calculated in reference to a serum vitamin D concentration ≥50 nmol/L using multivariate logistic regression adjusting for age, education level, household income, marital status, residential region, subjective stress level, dietary supplement consumption, smoking status, alcohol consumption status, and regular exercise (* p<0.05, ** p<0.01). |
To determine whether there was a difference in the combined effect of menopausal status and 25(OH)D concentration on the risk of obesity and MetS according to dietary macronutrient consumption, a multinomial logistic regression model was calculated after stratification into groups according to dietary macronutrient consumption, as shown in Table 4. A significant difference in the adjusted odds ratio for obesity in participants with 25(OH)D deficiency was observed according to dietary consumption of macronutrients only among premenopausal participants. Among the postmenopausal women with 25(OH)D insufficiency, using 25(OH)D sufficiency as a reference, the adjusted odds ratio for obesity was 1.428-times (95% CI = 1.145–1.780) higher in participants who consumed a high level of dietary CHOs, 1.385-times (95% CI = 1.091–1.756) higher in those with low dietary protein intake, and 1.434-times (95% CI = 1.150–1.788) higher in those with low dietary fat intake. However, there was no observed increase in the risk of obesity due to vitamin D deficiency among postmenopausal participants who consumed low levels of CHOs or high levels of protein and fat. Those associations were similar to the adjusted odds ratios for MetS. In other words, among the postmenopausal women who were deficient in 25 (OH) D, the adjusted odds ratio for MetS was 1.261- (95% CI = 1.013–1.570), 1.266- (95% CI = 1.008–1.590), and 1.239-times (95% CI = 1.004–1.529) higher in participants who consumed high levels of CHOs, low levels of protein and fat, respectively. The premenopausal participants exhibited no difference in the risk of obesity or MetS according to 25(OH)D concentration regardless of the consumption of dietary CHOs, protein, and fat.
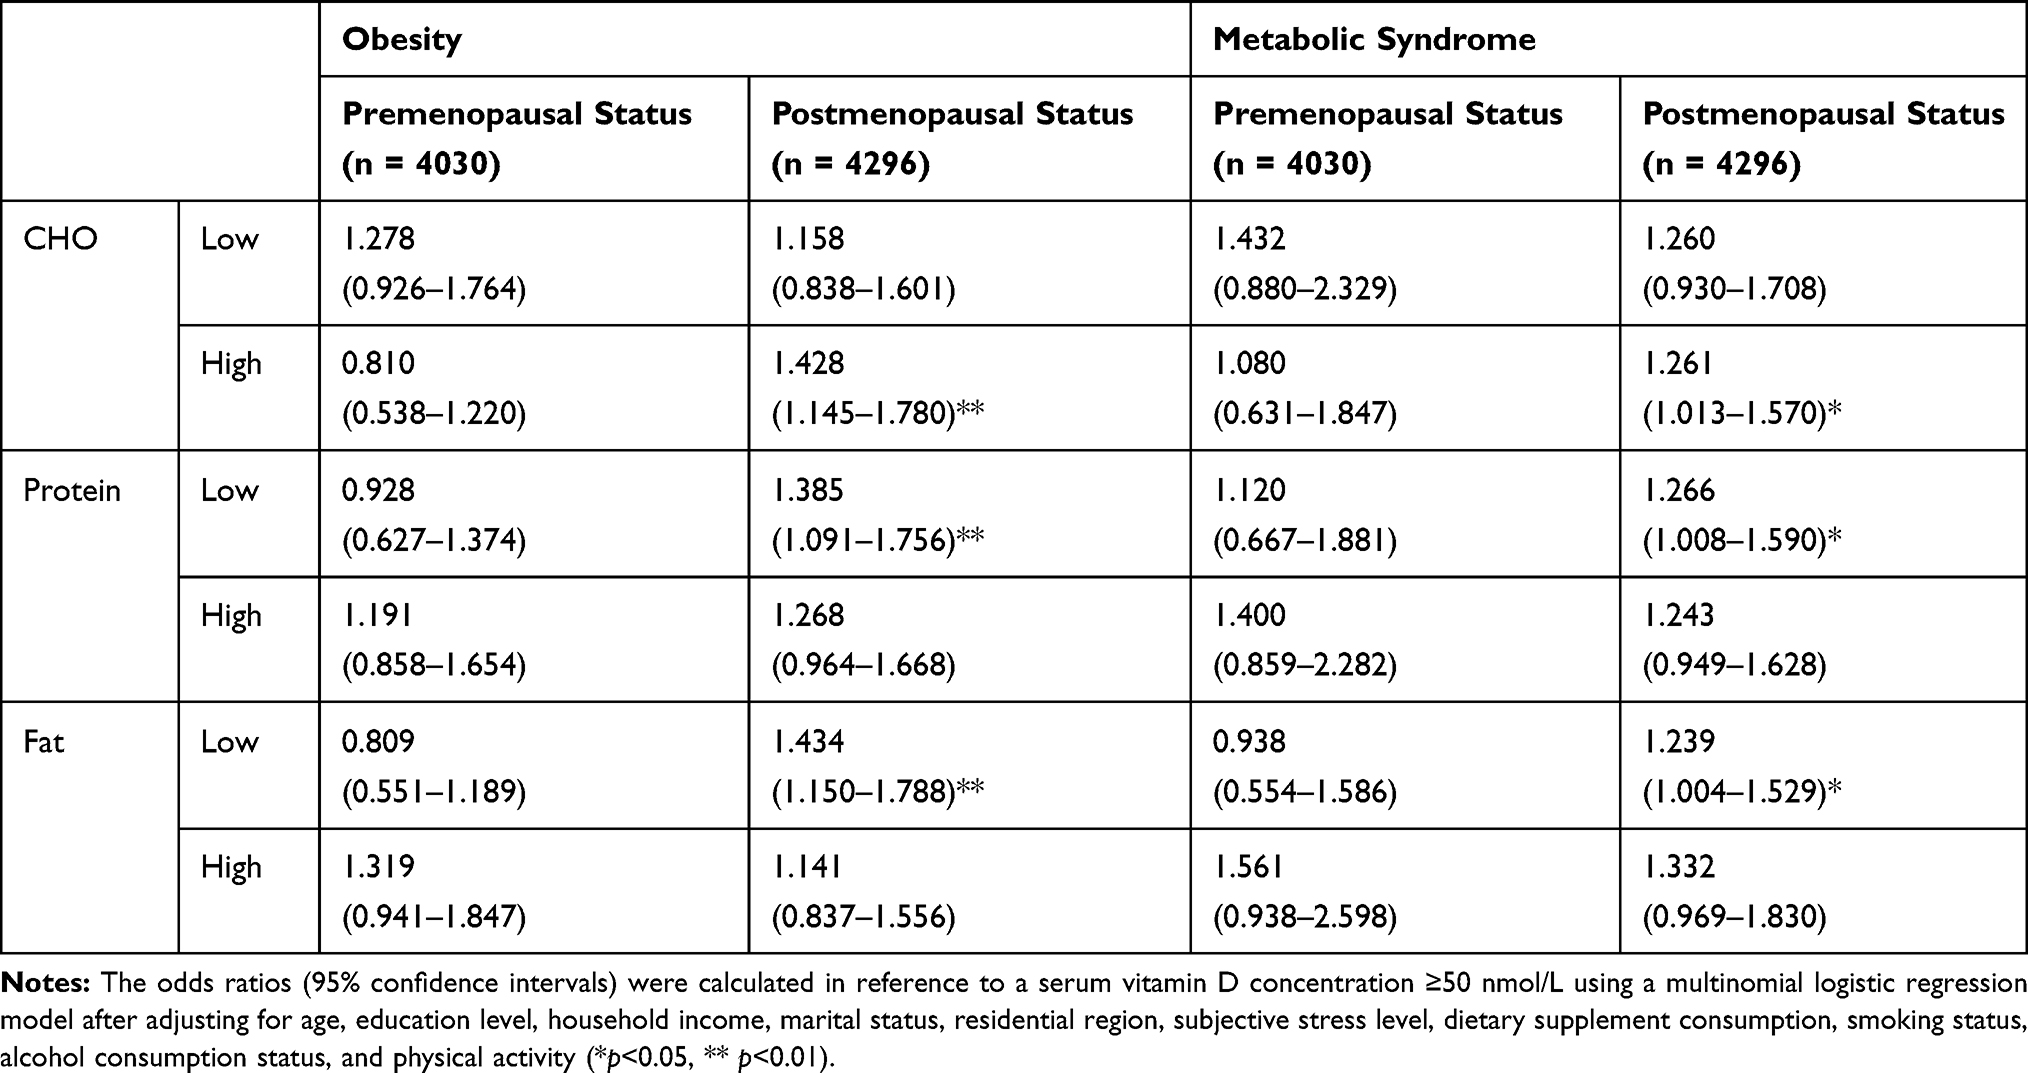 |
Table 4 Association of the Combined Effect the Menopausal Status and 25-Hydroxyvitamin D Concentration on Obesity and Metabolic Syndrome According to Dietary Macronutrient Consumption |
Discussion
This study used data from the KNHANES, a nationally representative survey of the Korean population, to identify whether the consumption of dietary macronutrients could modulate the risk of MetS related to 25(OH)D deficiency according to menopausal status. After adjustment for covariates, not only MetS-related variables, such as BMI, WC, FG, TGs, and HDL-C, but also the risk of MetS were observed to be significantly different according to 25(OH)D concentration in only the postmenopausal women but not in the premenopausal women. Interestingly, the combined effect of menopausal status and 25 (OH) D concentration on the risk of obesity and MetS varied by dietary consumption of macronutrients.
This study revealed that the 25(OH)D concentration is related to MetS-related variables, such as BMI, FG, TGs, and HDL-C, which is consistent with the results of previous studies.2,3,21 The association between vitamin D concentration and MetS is well established. Vitamin D plays roles in various pathways, including adiposity, abnormal lipidemia and glucose homeostasis as well as insulin secretion and sensitivity, which are critical risk factors for MetS.2,21 According to a meta-analysis of 28 studies, a high level of vitamin D was observed to reduce MetS risk by 51%,22 and some have suggested that maintaining a proper level of vitamin D would help cure or prevent risk factors for MetS.21
After being divided by menopausal status, postmenopausal women with vitamin D deficiency showed a significant difference in both MetS-related variables and the risk of obesity and MetS compared with the same parameters in those with sufficient vitamin D, but this difference was not found in premenopausal women. The results of our study regarding postmenopausal women were consistent with the findings of previous studies,5–7 which reported that 25(OH)D concentration is associated with MetS. However, few studies have investigated differences in MetS-related variables associated with 25(OH)D concentration depending on menopausal status. Although a causal relationship between vitamin D concentration and MetS-related variables could not be identified because this study used cross-sectional design data, a possible cause of these differences might be hormonal differences, an important factor in determining menopause status. On the other hand, the risk of MetS is recognized to increase after menopause. Changes in body composition, including an increase in body fat and a decrease in lean mass, occur with age.21 Indeed, postmenopausal women showed a decrease in physical activity and thus a change in sun exposure, which affects vitamin D synthesis.23 Furthermore, the increase in the risk of MetS in women with vitamin D deficiency might be accelerated because of the reduction in the protective effect of estrogen after menopause.24
In premenopausal women, no difference was observed in the association of the concentration of 25(OH)D with the risk of obesity or MetS, regardless of dietary macronutrient consumption. However, interestingly, postmenopausal women with vitamin D deficiency exhibited a difference in the risk of obesity or MetS according to dietary macronutrient consumption. Among the postmenopausal participants with low dietary protein consumption, 25(OH)D deficiency was associated with a significantly higher risk of obesity and MetS, but a higher risk was not observed among those who consumed high levels of dietary protein. As mentioned earlier, a high protein diet (relatively low CHO diet), per se, could help reduce obesity and metabolic syndrome by reducing body weight and fat mass and lowering TGs and BP.12,13 Although age was adjusted as a covariate, most postmenopausal women are older. Elderly individuals have shown decreased vitamin D synthesis due to decreased physical activity and sun exposure as well as reduced capacity to make vitamin D.21,23,24 Additionally, Korean elderly individuals not only consume protein mostly from rice and staple food products but also commonly have low consumption of dietary animal protein, including fatty fish, egg yolks, milk, butter, and cheese, which are major sources of vitamin.25,26 On the other hand, the overall CHO consumption of postmenopausal women in our study was higher than the upper limit of Korean Acceptable Macronutrients Distribution Ranges (Korean AMDR) for CHO (55~65% of total energy consumption). Therefore, one strategy for controlling obesity or MetS-induced vitamin D deficiency might be to maintain adequate vitamin D concentrations by increasing outdoor physical activity and high-quality protein consumption, which is consistent with the findings of our previous study on an elderly population.28 Furthermore, the consumption of CHO within AMDR could modulate the risk of obesity or MetS-induced vitamin D deficiency through relatively increased protein consumption.
These interesting results suggest that postmenopausal women with 25(OH)D deficiency are more likely to have abnormal MetS-related variables and a high risk of MetS. Additionally, those associations may be modified by dietary consumption. However, several limitations of this study exist. First, our results were obtained from data from a cross-sectional design and cannot provide causal explanations. Second, although the concentration of vitamin D in our study was adjusted for several factors, the consumption of vitamin D from food or supplements, the season of blood sampling, and usual sun exposure could not be considered. Finally, more detailed menopausal status in our study was not considered. The menopausal status was classified into two categories: “premenopausal” and “postmenopausal”. However, perimenopause, which is between the premenopausal and postmenopausal periods, could be taken into consideration due to the association of this period with other physiological and psychological changes.
Using representative data of Korean women from the KNHANES, this study demonstrated that the differences in MetS-related variables in regard to vitamin D deficiency are related to menopausal status. In addition, women with vitamin D deficiency who consumed high CHO or low protein and fat diets had an increased risk of MetS, but this association was observed among only postmenopausal women. These findings suggested that the increased risk of MetS due to vitamin D deficiency among postmenopausal women could potentially be modified by changing dietary macronutrient consumption.
Author Contributions
All authors made significant contributions to the conception, study design, acquisition of data, analysis and interpretation of data, took part in drafting, revising or critically reviewing the article, gave final approval of the version to be published, and agree to be accountable for all aspects of the work.
Funding
This paper was supported by the Basic Science Research Program through the National Research Foundation of Korea (NRF) funded by the Ministry of Science (NRF-2019R1C1C1002149), the research funds of Kunsan National University, and the Cooperative Research Program for Agricultural Science & Technology Development (Project No. PJ011253062018) of the Republic of Korea.
Disclosure
The authors have no conflicts of interest to declare for this work.
References
1. Holick MF, Chen TC. Vitamin D deficiency: a worldwide problem with health consequences. Am J Clin Nutr. 2008;87:1080S–6S. doi:10.1093/ajcn/87.4.1080S
2. Wimalawansa SJ. Associations of vitamin D with insulin resistance, obesity, type 2 diabetes, and metabolic syndrome. J Steroid Biochem Mol Biol. 2018;175:177–189. doi:10.1016/j.jsbmb.2016.09.017.
3. Mousa A, Naderpoor N, de Courten MPJ, Scragg R, de Courten B. 25-hydroxyvitamin D is associated with adiposity and cardiometabolic risk factors in a predominantly vitamin D-deficient and overweight/obese but otherwise healthy cohort. J Steroid Biochem Mol Biol. 2017;173:258–264. doi:10.1016/j.jsbmb.2016.12.008
4. Weinstein SJ, Purdue MP, Smith-Warner SA, et al. Serum 25-hydroxyvitamin D, vitamin D binding protein and risk of colorectal cancer in the prostate, lung, colorectal and ovarian cancer screening trial. Int J Cancer. 2015;136:E654–64. doi:10.1002/ijc.29157.
5. Chon SJ, Yun BH, Jung YS, et al. Association between vitamin D status and risk of metabolic syndrome among Korean postmenopausal women. PLoS One. 2014;9:e89721. doi:10.1371/journal.pone.0089721
6. Schmitt EB, Nahas-Neto J, Bueloni-Dias F, Poloni PF, Orsatti CL, Petri Nahas EA. Vitamin D deficiency is associated with metabolic syndrome in postmenopausal women. Maturitas. 2018;107:97–102. doi:10.1016/j.maturitas.2017.10.011.
7. Srimani S, Saha I, Chaudhuri D. Prevalence and association of metabolic syndrome and vitamin D deficiency among postmenopausal women in a rural block of West Bengal, India. PLoS One. 2017;12:e0188331. doi:10.1371/journal.pone.0188331.
8. Lim SK, Kung AW, Sompongse S, Soontrapa S, Tsai KS. Vitamin D inadequacy in postmenopausal women in Eastern Asia. Curr Med Res Opin. 2008;24:99–106. doi:10.1185/030079908X253429.
9. Sofer S, Stark AH, Madar Z. Nutrition targeting by food timing: time-related dietary approaches to combat obesity and metabolic syndrome. Adv Nutr. 2015;6:214–223. doi:10.3945/an.114.007518.
10. Kastorini CM, Milionis HJ, Esposito K, Giugliano D, Goudevenos JA, Panagiotakos DB. The effect of Mediterranean diet on metabolic syndrome and its components: a meta-analysis of 50 studies and 534,906 individuals. J Am Coll Cardiol. 2011;57:1299–1313. doi:10.1016/j.jacc.2010.09.073.
11. Drehmer M, Odegaard AO, Schmidt MI, et al. Brazilian dietary patterns and the dietary approaches to stop hypertension (DASH) diet-relationship with metabolic syndrome and newly diagnosed diabetes in the ELSA-Brasil study. Diabetol Metab Syndr. 2017;9:13. doi:10.1186/s13098-017-0211-7
12. Santesso N, Akl EA, Bianchi M, et al. Effects of higher- versus lower-protein diets on health outcomes: a systematic review and meta-analysis. Eur J Clin Nutr. 2012;66(7):780–788. doi:10.1038/ejcn.2012.37.
13. Clifton PM, Condo D, Keogh JB. Long term weight maintenance after advice to consume low carbohydrate, higher protein diets–a systematic review and meta analysis. Nutr Metab Cardiovasc Dis. 2014;24:224–235. doi:10.1016/j.numecd.2013.11.006
14. The Korea Centers for Disease Control and Prevention. The 5th and 6th Korean National Health and Nutrition Survey. Available from https://knhanes.cdc.go.kr.
15. Oh SW, Shin SA, Yun YH, Yoo T, Huh BY. Cut-off point of BMI and obesity-related comorbidities and mortality in middle-aged Koreans. Obes Res. 2004;12:2031–2040. doi:10.1038/oby.2004.254
16. Ross AC, Manson JE, Abrams SA, et al. The 2011 report on dietary reference intakes for calcium and vitamin D from the Institute of Medicine: what clinicians need to know. J Clin Endocrinol Metab. 2011;96(1):53–58. doi:10.1210/jc.2010-2704
17. Kim JA, Choi CJ, Yum KS. Cut-off values of visceral fat area and waist circumference: diagnostic criteria for abdominal obesity in a Korean population. J Korean Med Sci. 2006;21(6):1048–1053. doi:10.3346/jkms.2006.21.6.1048
18. Yoon YS, Oh SW. Optimal waist circumference cutoff values for the diagnosis of abdominal obesity in korean adults. Endocrinol Metab. 2014;29(4):418–426. doi:10.3803/EnM.2014.29.4.418
19. Kweon S, Kim Y, Jang MJ, et al. Data resource profile: the Korea National Health and Nutrition Examination Survey (KNHANES). Int J Epidemiol. 2014;43:69–77. doi:10.1093/ije/dyt228
20. National Rural Living Science Institute. Food Composition Table.
21. Lerchbaum E. Vitamin D and menopause–a narrative review. Maturitas. 2014;79(1):3–7. doi:10.1016/j.maturitas.2014.06.003
22. Parker J, Hashmi O, Dutton D, et al. Levels of vitamin D and cardiometabolic disorders: systematic review and meta-analysis. Maturitas. 2010;65:225–236. doi:10.1016/j.maturitas.2009.12.013
23. Pludowski P, Holick MF, Pilz S, et al. Vitamin D effects on musculoskeletal health, immunity, autoimmunity, cardiovascular disease, cancer, fertility, pregnancy, dementia and mortality-a review of recent evidence. Autoimmun Rev. 2013;12(10):976–989. doi:10.1016/j.autrev.2013.02.004
24. ESHRE Capri Workshop. Group Perimenopausal risk factors and future health. Hum Reprod Update. 17;706–717;2011. doi:10.1093/humupd/dmr020
25. Park HA. Adequacy of protein intake among korean elderly: an analysis of the 2013–2014 Korea national health and nutrition examination survey data. Korean J Fam Med. 2018;39(2):130–134. doi:10.4082/kjfm.2018.39.2.130
26. Schmid A, Walther B. Natural Vitamin D content in animal products. Adv Nutr. 2013;4(4):453–462. doi:10.3945/an.113.003780
27. The Korean Nutrition Society. Dietary Reference Intakes for Koreans. 2015
28. Doo M. The association between sleep duration and 25-Hydroxyvitamin D concentration with obesity in an elderly korean population: a cross-sectional study. Nutrients. 2018;8:10. doi:10.3390/nu10050575
 © 2020 The Author(s). This work is published and licensed by Dove Medical Press Limited. The
full terms of this license are available at https://www.dovepress.com/terms
and incorporate the Creative Commons Attribution
- Non Commercial (unported, 3.0) License.
By accessing the work you hereby accept the Terms. Non-commercial uses of the work are permitted
without any further permission from Dove Medical Press Limited, provided the work is properly
attributed. For permission for commercial use of this work, please see paragraphs 4.2 and 5 of our Terms.
© 2020 The Author(s). This work is published and licensed by Dove Medical Press Limited. The
full terms of this license are available at https://www.dovepress.com/terms
and incorporate the Creative Commons Attribution
- Non Commercial (unported, 3.0) License.
By accessing the work you hereby accept the Terms. Non-commercial uses of the work are permitted
without any further permission from Dove Medical Press Limited, provided the work is properly
attributed. For permission for commercial use of this work, please see paragraphs 4.2 and 5 of our Terms.