Back to Journals » Clinical Ophthalmology » Volume 20
Differences in Retinal Thickness and Vessel Density of the Macula and Optic Disc Across Myopic Children and Adolescents
Authors Wang WX ![]() , Wang YR, Wang SH, Lin WS, Lu YS, Ko ML
, Wang YR, Wang SH, Lin WS, Lu YS, Ko ML
Received 11 December 2025
Accepted for publication 27 February 2026
Published 4 March 2026 Volume 2026:20 583727
DOI https://doi.org/10.2147/OPTH.S583727
Checked for plagiarism Yes
Review by Single anonymous peer review
Peer reviewer comments 3
Editor who approved publication: Dr Yousef Fouad
Wei-Xiang Wang,1 Yu-Rong Wang,2 Shun-Huan Wang,3 Wei-Shen Lin,4 Yi-Shuan Lu,4 Mei-Lan Ko5,6
1Department of Education, Taipei Tzu Chi Hospital, Buddhist Tzu Chi Medical Foundation, New Taipei, Taiwan; 2Department of Electronics and Electrical Engineering, National Yang Ming Chiao Tung University, Hsinchu, Taiwan; 3Department of Biomedical Engineering and Environmental Sciences, National Tsing Hua University, Hsinchu, Taiwan; 4Department of Optometry, Chung Shan Medical University, Taichung, Taiwan; 5Department of Ophthalmology, National Taiwan University Hospital, Hsin-Chu Branch, Hsin-Chu City, 300, Taiwan; 6Department of Ophthalmology, College of Medicine, National Taiwan University, Taipei, 110, Taiwan
Correspondence: Mei-Lan Ko, Department of Ophthalmology, National Taiwan University Hospital, Hsin-Chu Branch, No. 25, Lane 442, Section 1, Jingguo Road, North District, Hsinchu City, 300, Taiwan, Tel +886 972 654 211, Email [email protected]
Purpose: To compare macular retinal thickness (RT) and superficial vessel density (SVD), as well as optic disc region retinal thickness (Disc RT) and small vessel density, among emmetropic, low myopic, and moderate myopic children (7– 11 years) and adolescents (12– 20 years).
Methods: In this cross-sectional study, participants were stratified by age group and refractive status: emmetropia (− 0.50 D to +0.50 D), low myopia (> − 3.0 D, < − 1.0 D), and moderate myopia (− 3.0 D to − 6.0 D). Macular RT (central fovea and parafoveal quadrants) and SVD were measured by optical coherence tomography (OCT). Peripapillary RT and small vessel density were also quantified.
Results: The results showed that myopic eyes had thinner retinal thickness in the macular region than emmetropic eyes, especially in parafoveal areas. The superficial capillary vessel density in the macula was significantly reduced in myopic eyes compared to emmetropic eyes. Notably, in children (7– 11y) this reduction was most pronounced in the temporal parafoveal region, whereas in adolescents (12– 20y) the nasal parafoveal region showed greater vessel density reduction. In addition, in the children group with moderate myopia, the temporal peripapillary retinal nerve fiber layer (RNFL) was thicker; however, this temporal difference disappeared in the adolescent group.
Conclusion: Pediatric myopia is associated with macular thinning, reduced perfusion, and age-related differences in RNFL parameters. Structural and microvascular alterations appear to vary across pediatric stages, underscoring the importance of careful evaluation of both parafoveal and peripapillary regions for early detection and clinical monitoring of myopia-related changes.
Plain Language Summary: Myopia is becoming more common in children and teenagers. When the eye grows longer, the retina – the light-sensing layer at the back of the eye – may slowly stretch, become thinner, and receive less blood flow. These early changes are important because they may increase the chance of eye problems later in life.
We carried out this study to understand how the retina and its tiny blood vessels change in children and adolescents with different levels of myopia. We used optical coherence tomography to measure the thickness of the retina and the density of small blood vessels in the central area of vision and around the optic nerve.
We found that children and teenagers with moderate myopia had thinner retinas and lower blood-vessel density than those with normal vision. Younger children showed the greatest changes on the outer side of the central retina, while older adolescents showed more changes on the inner side near the optic nerve. Children with moderate myopia also had a larger optic cup and a different pattern of nerve-fiber thickness compared with their peers.
These findings show that myopia affects the eye differently at different ages. Understanding these patterns may help eye-care professionals identify early signs of strain on the retina and the optic nerve. Early detection may guide better monitoring and support for young people with myopia, helping to protect their vision as they grow.
Keywords: pediatric myopia, macular retinal thickness, superficial vessel density, disc small vessel density, axial elongation
Introduction
The increasing incidence of myopia in children has become a major public health concern, as high myopia can lead to severe ocular complications such as retinal detachment, myopic macular degeneration, glaucoma, and peripheral retinal degenerations.1 Myopic eyes also demonstrate structural changes in the retina; for example, thinning of the peripapillary retinal nerve fiber layer and ganglion cell layer has been observed in association with myopia.2 As the eyeball elongates in myopia, various biometric parameters of the eye change correspondingly.3 Previous studies have documented that myopic eyes undergo not only structural thinning but also vascular alterations in the retina. Longer axial lengths have been linked to decreased retinal perfusion and altered oxygen demand in the eye.4 Correspondingly, histologic examinations of highly myopic eyes reveal stretching and thinning of retinal tissues, which may lead to attenuation of retinal capillaries.5,6 In addition, even in non-pathological myopia, more negative spherical equivalent refractive error has been associated with thinner retinal layers and reduced retinal capillary density.7,8
Most prior studies on myopic retinal vascular changes have focused on adults (often including those with pathological myopic degeneration) or broad age ranges.5 It remains to be clarified whether similar microvascular changes occur in young myopic eyes before any pathological fundus changes emerge. Therefore, this study aimed to assess differences in retinal thickness and superficial retinal vessel density across different myopic refractive levels in a pediatric population, using optical coherence tomography (OCT) and OCT angiography (OCTA). By focusing on children and adolescents without pathological myopic fundus changes, we sought to determine the extent of microstructural and microvascular alterations associated with myopia in early life.
Methods
Study Design
This study was a cross-sectional comparative analysis of children and adolescents with varying refractive statuses. Participants were recruited at National Taiwan University Hospital Hsin-Chu Branch from the ophthalmology clinic between August 2022 and August 2025, and written informed consent was obtained from both the participants and their legal guardians prior to study commencement. The study was conducted in accordance with the Declaration of Helsinki, and the approval was granted by the Institutional Review Board of National Taiwan University Hospital Hsin-Chu Branch (IRB: 111–038-F).
Patient Selection and Grouping
Inclusion criteria were age between 7 and 20 years, best-corrected visual acuity of 0.8 (20/25) or better, and no ocular diseases other than refractive error. Those with amblyopia, strabismus, previous ocular surgery, or retinal pathology (such as lattice degeneration or myopic maculopathy) were excluded. Each participant underwent cycloplegic refraction and was assigned to one of three groups based on spherical equivalent refraction (SER): emmetropia group (between +0.50 D and –0.50 D), low myopia group (SER < –0.50 D down to –3.00 D), and moderate myopia group (SER < –3.00 D down to –6.00 D).
Ocular Examination and Measurements
All subjects underwent comprehensive ophthalmic examination, including best-corrected visual acuity, cycloplegic refraction, intraocular pressure, axial length measurement, and ocular imaging with Avanti® Widefield OCT system with AngioVue® OCTA (Optovue Inc., Fremont, CA, USA). This platform provides an optical axial resolution of approximately 5 μm, with an imaging depth of 2–3 mm. Cycloplegic autorefraction was done after administering tropicamide 1% eye drops (two doses, 5 minutes apart). Macular and optic disc OCTA scans were acquired using 3×3 mm and 4.5×4.5 mm scan areas, respectively, centered on the fovea and optic disc. Macular OCT scans were performed to measure retinal thickness at the fovea (1mm diameter) and parafoveal regions (3mm diameters), including central foveal thickness and four parafoveal quadrant thicknesses as temporal, superior, nasal, and inferior. The superficial capillary plexus was defined from the inner limiting membrane to the inner plexiform layer. Peripapillary OCT scans were used to measure retinal nerve fiber layer (RNFL) thickness around the optic disc in four quadrants (temporal, superior, nasal, and inferior). Macular OCTA (3 × 3 mm) was performed to quantify superficial capillary plexus vessel density across the whole macula, foveal region, and four parafoveal quadrants. Optic disc OCTA scans were additionally obtained to calculate peripapillary capillary density in the radial peripapillary capillary (RPC) layer, defined from the inner limiting membrane to the RNFL, excluding large vessels, for the temporal, superior, nasal, and inferior quadrants around the disc. OCT scans with low signal strength, poor centration, or segmentation errors were excluded and repeated. OCTA images with inadequate quality (signal strength index < 6/10), motion artifacts, or segmentation errors were excluded and repeated. All measurements were performed in the morning to minimize diurnal variation.
Data Collection and Statistical Analyses
All statistical analyses were performed using MedCalc (MedCalc Software Ltd, Ostend, Belgium). Continuous variables were expressed as mean ± standard deviation. One-way analysis of variance (ANOVA) was used to compare mean values among the three refractive groups, followed by post hoc pairwise comparisons. Categorical data (such as sex) were compared with chi-square tests. Independent samples t-tests were used when comparing two groups (eg, superficial vessel density differences between children and adolescent groups). P-value < 0.05 was considered statistically significant for all tests.
Results
Demographic Characteristics
A total of 93 eyes were included in the 7–11 year-old cohort (19 moderate myopia, 35 low myopia, 39 emmetropia), and 82 eyes in the 12–20 year-old cohort (31 moderate myopia, 38 low myopia, 13 emmetropia) (Table 1). In the 7–11y group, the emmetropic group had significant differences in gender distribution than the moderate myopia (p=0.024) and low myopia group (p < 0.001). In the 7–11y group, the moderate myopia group had a slightly higher mean age (9.7±1.1 years) than the low myopia (8.9±0.9 years) and emmetropic groups (9.0±1.2 years), with an overall significant difference (ANOVA p=0.033). In the 12–20y group, mean ages were around 15 years across all refractive groups (15.1–15.6 years) with no significant inter-group difference (p=0.767). Axial length differed markedly by refractive status: in the 7–11y group, moderate myopes had significantly longer axial lengths (25.2±1.1 mm) than low myopes (24.2±0.7 mm) and emmetropes (23.1±0.8 mm) (p<0.001). Similarly, in the 12–20y group, axial length was longer in moderate myopia (25.3±1.1 mm) compared to low myopia (24.4±0.7 mm) and emmetropia (23.6±0.9 mm) (p<0.001). Intraocular pressure did not differ significantly among refractive groups in either age cohort. By design, spherical equivalent differed significantly across refractive groups in both age sets (Table 1): the moderate myopia groups (mean SE –4.0 D in 7–11y and –4.5 D in 12–20y) were significantly more myopic than the low myopia groups (–1.65 D and –1.84 D, respectively) and the emmetropic groups (~0 D) (all p<0.001), confirming clear separation of refractive categories.
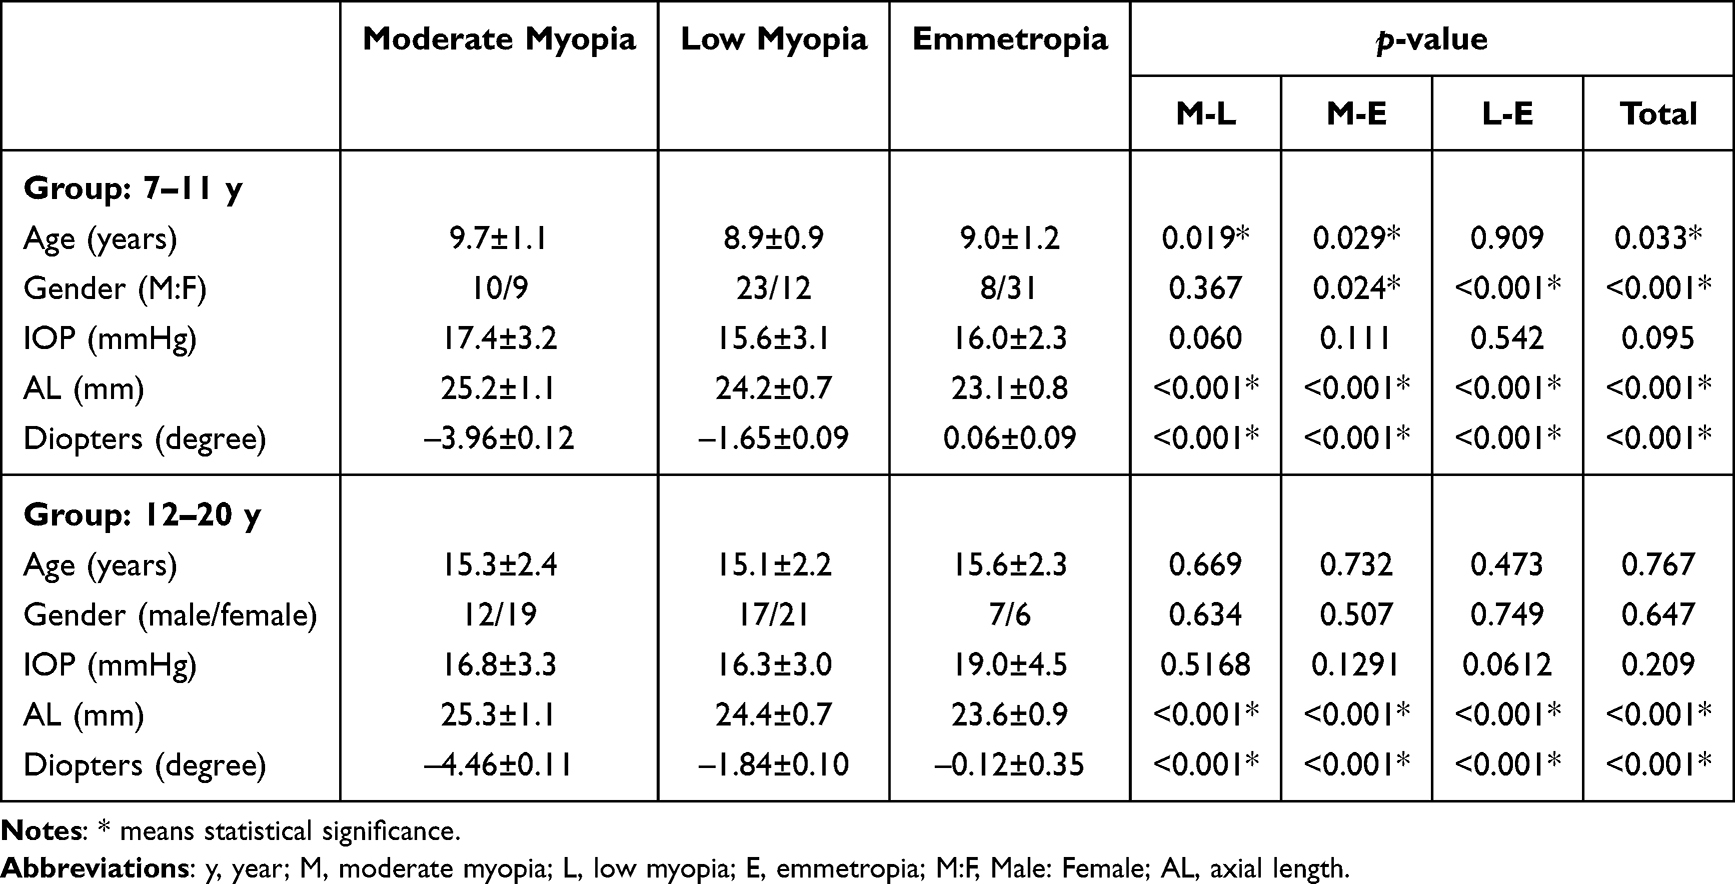 |
Table 1 Baseline Characteristics of the 7–11 y and 12–20 y Groups |
Macular Retinal Thickness
In the 7–11y group, differences in macular retinal thickness were observed among refractive groups (Table 2). Whole macula thickness: The moderate and low myopia groups had slightly lower average full macular thickness (~303 μm each) compared to the emmetropic group (308±9 μm), with an overall significant difference (ANOVA p=0.047); specifically, the moderate myopia group was significantly thinner than emmetropes (pairwise p=0.029). Central foveal thickness: did not significantly differ among the three groups (p>0.1). Parafoveal thickness: The average parafoveal retinal thickness in the moderate myopia group was significantly less than that of the emmetropic group (314±9 μm vs 322±10 μm, p=0.007), yielding a significant overall group difference (p=0.035). The same trend was significant in all four parafoveal quadrants (all p < 0.05).
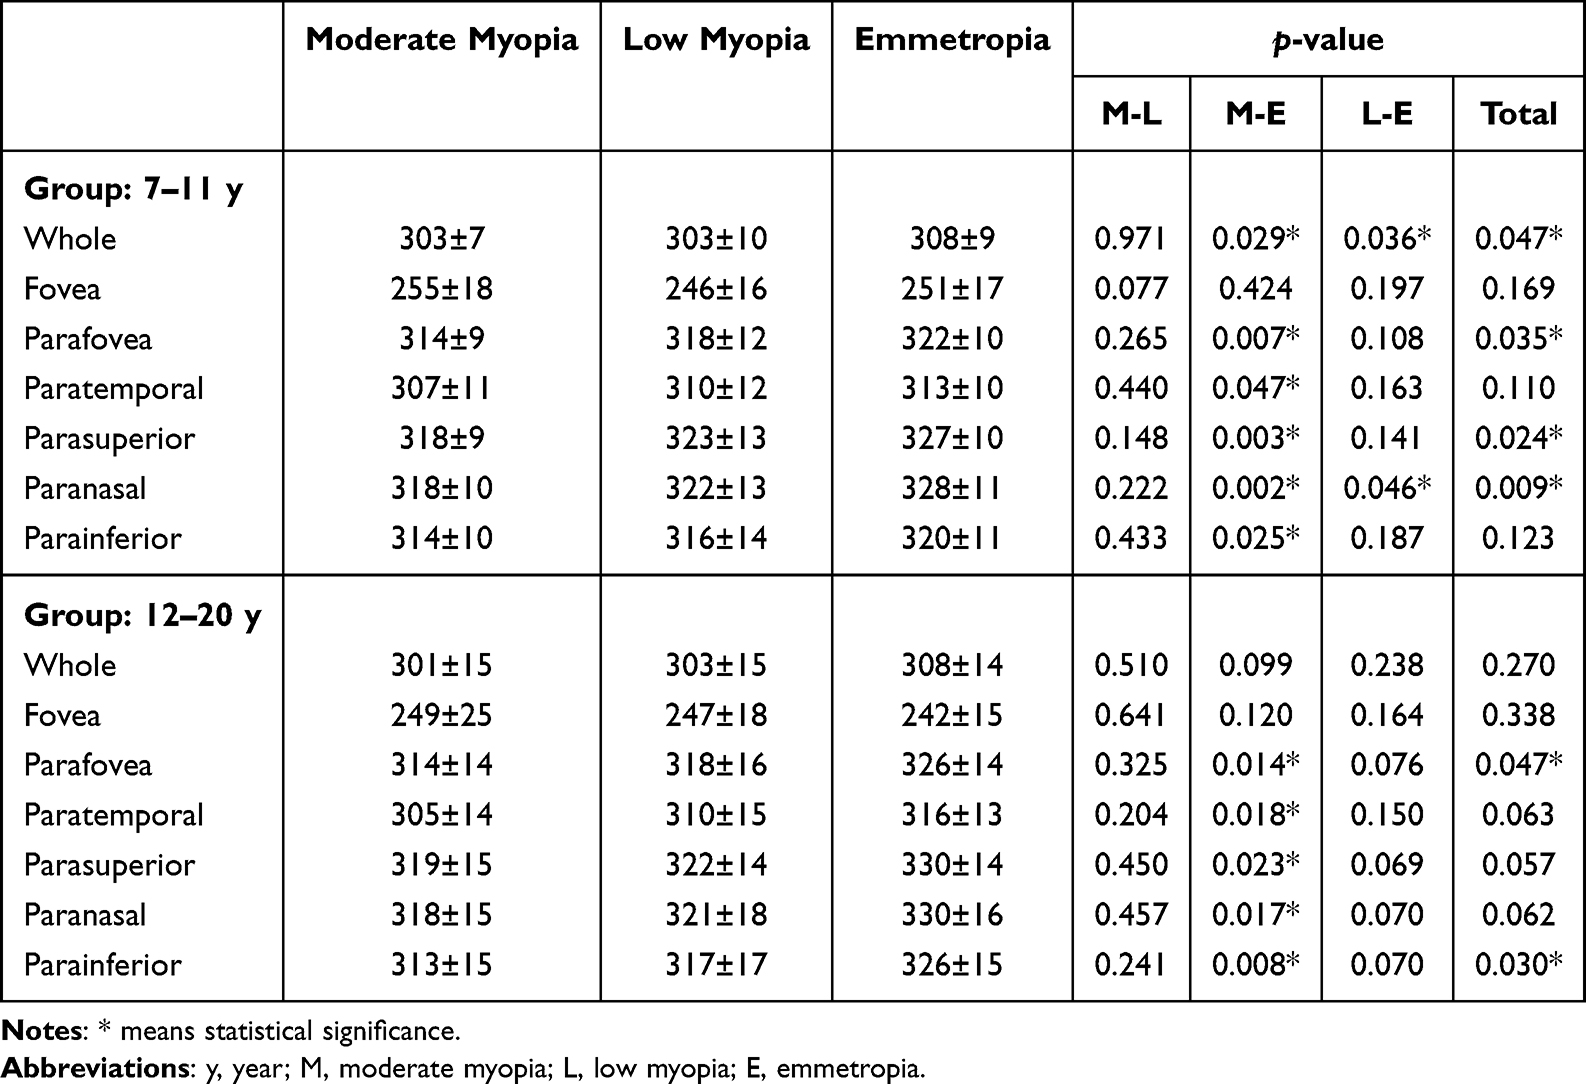 |
Table 2 Macular Retinal Thickness of the 7–11 y and 12–20 y Groups |
In the 12–20y group, a similar overall pattern was noted as myopic eyes tending toward thinner maculas than emmetropes (Table 2). Whole macula thickness: The moderate and low myopia groups had slightly lower mean thickness (around 301–303 μm) than the emmetropic group (308±14 μm), but this difference was not statistically significant (p=0.27). Parafoveal thickness: The overall group difference was marginal (p=0.047); the moderate myopia group remained significantly thinner than emmetropes (314±14 μm vs 326±14 μm, p=0.014). By four quadrants, the moderate myopia group had significantly thinner retinas than emmetropes (all p < 0.05). No significant difference was found between the two age groups at the same refractive level (p > 0.1) (Table S1). These results indicate that in the 7–11y and 12–20y group, moderate myopes have generally reduced parafoveal retinal thickness compared to emmetropes. The low myopia group’s thickness values mostly were between those of moderate myopia and emmetropia, and in most quadrants did not significantly differ from emmetropes.
Macular Superficial Vessel Density
In the 7–11y group, Whole macula and foveal vessel density showed no significant differences among the three groups (all p > 0.05) (Table 3). Parafoveal mean vessel density: The moderate myopia group had a lower average parafoveal density (47±4%) than the emmetropic group (49±3%, p=0.036). In the temporal parafoveal region, the moderate myopia group had the lowest vessel density (45±4%), significantly less than both the low myopia (48±4%, p=0.026) and emmetropic groups (48±4%, p=0.030). In the inferior parafoveal quadrant, moderate myopes also showed lower density (47±4%) compared to low myopia (49±4%, p=0.03) and emmetropic groups (49±4%, p=0.029). By contrast, in the nasal and superior parafoveal quadrants, there were no significant differences between myopic and emmetropic children.
 |
Table 3 Macular Superficial Vessel Density of the 7–11 y and 12–20 y Groups |
In the 12–20y group, differences in macular vessel density between myopes and emmetropes were still present, but the regional distribution changed (Table 3). In the nasal parafoveal quadrant, the 12–20y moderate myopia group had significantly reduced vessel density (46±5%) compared to the emmetropic group (49±3%, p=0.025). In the inferior parafoveal quadrant, moderate myopes had lower density than emmetropes (47±6% vs 51±3%, p=0.011). No significant difference was found between the two age groups at the same refractive level (p > 0.1) (Table S1). Therefore, in the adolescent group, the reduction in macular microvascular perfusion in myopic eyes was most pronounced in the nasal and inferior quadrants, whereas the temporal quadrant difference in younger children was diminished. This shift in regional patterns suggests that as age increases and axial length elongates, the primary location of parafoveal perfusion loss may move from the temporal side toward the nasal side.
Peripapillary RNFL Thickness
Average RNFL thickness: In the 7–11y group, the mean RNFL thickness ranged ~114–117 μm across groups with no significant difference (p=0.748). In the 12–20y group, average RNFL thickness tended to be lower with higher myopia (moderate 112±12 μm vs emmetropic 117±11 μm), but this was not statistically significant (p=0.179) (Table 4). Quadrant RNFL thickness (7–11y): In the temporal quadrant, somewhat unexpectedly the moderate myopia group had a thicker RNFL (87±18 μm) compared to the low myopia (75±10 μm) and emmetropic (76±6 μm) groups. This quadrant showed significant differences between the moderate myopia group and both the low myopia (p=0.009) and emmetropic groups (p=0.015). In the inferior quadrant, the trend was opposite: the moderate myopia group had the thinnest RNFL (136±17 μm), significantly thinner than the emmetropic group (146±11 μm, p=0.026), with the low myopia group in between (144±18 μm) (Table 4). The superior and nasal quadrants in the 7–11y group showed no significant differences among refractive groups. In the 12–20y group, RNFL quadrant differences were not statistically significant in any quadrant (Table 4). No significant difference was found between the two age groups at the same refractive level (p > 0.1) (Table S2).
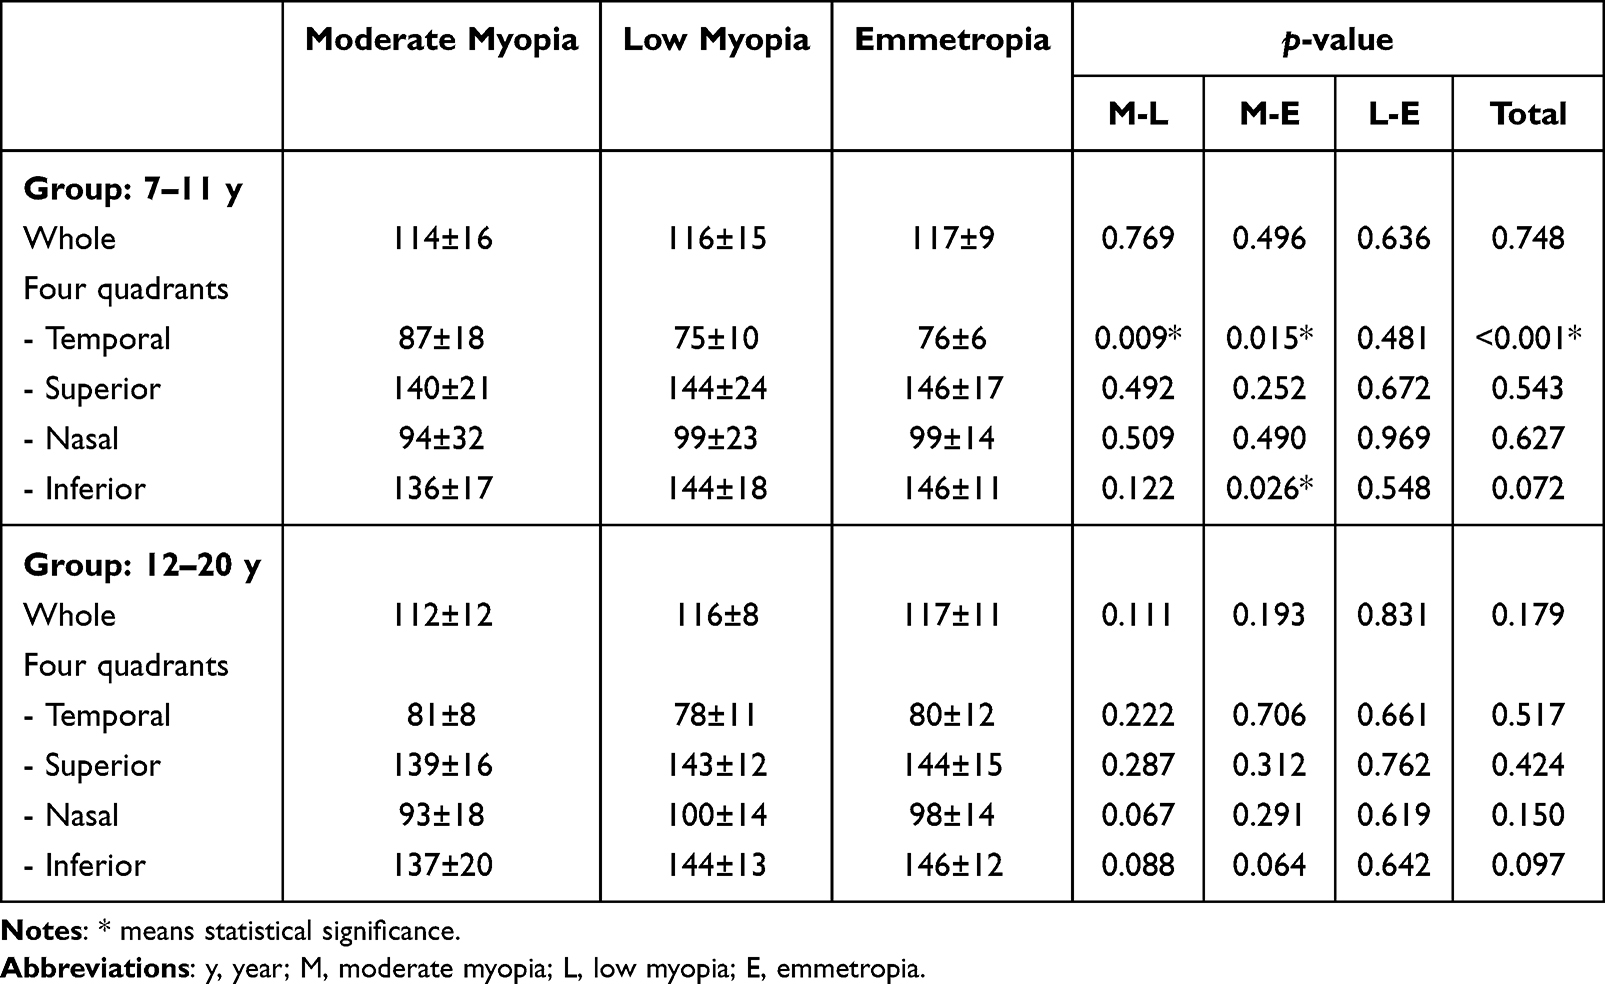 |
Table 4 Peripapillary Retinal Nerve Fiber Layer Thickness of the 7–11 y and 12–20 y Groups |
Peripapillary Small Vessel Density and Optic Disc Cupping
Using OCTA to assess the radial peripapillary capillary density (excluding large vessels) around the optic disc, we found no statistically significant differences among refractive groups in either age group. The mean peripapillary capillary density was around 52–53% in all groups for 7–11y, and 52–54% for 12–20y, with no pattern of the moderate myopia group being significantly lower than others (Table 5). On the other hand, we observed that in the 7–11y group, moderate myopic children had a significantly larger vertical cup-to-disc (C/D) ratio (0.55±0.16) compared to the low myopia (0.43±0.15, p=0.013) and emmetropic groups (0.46±0.11, p=0.045), indicating a relatively larger optic cup in young moderate myopes. However, in the 12–20y group, C/D ratios were similar across groups (0.52–0.54) with no significant differences (Table 5).
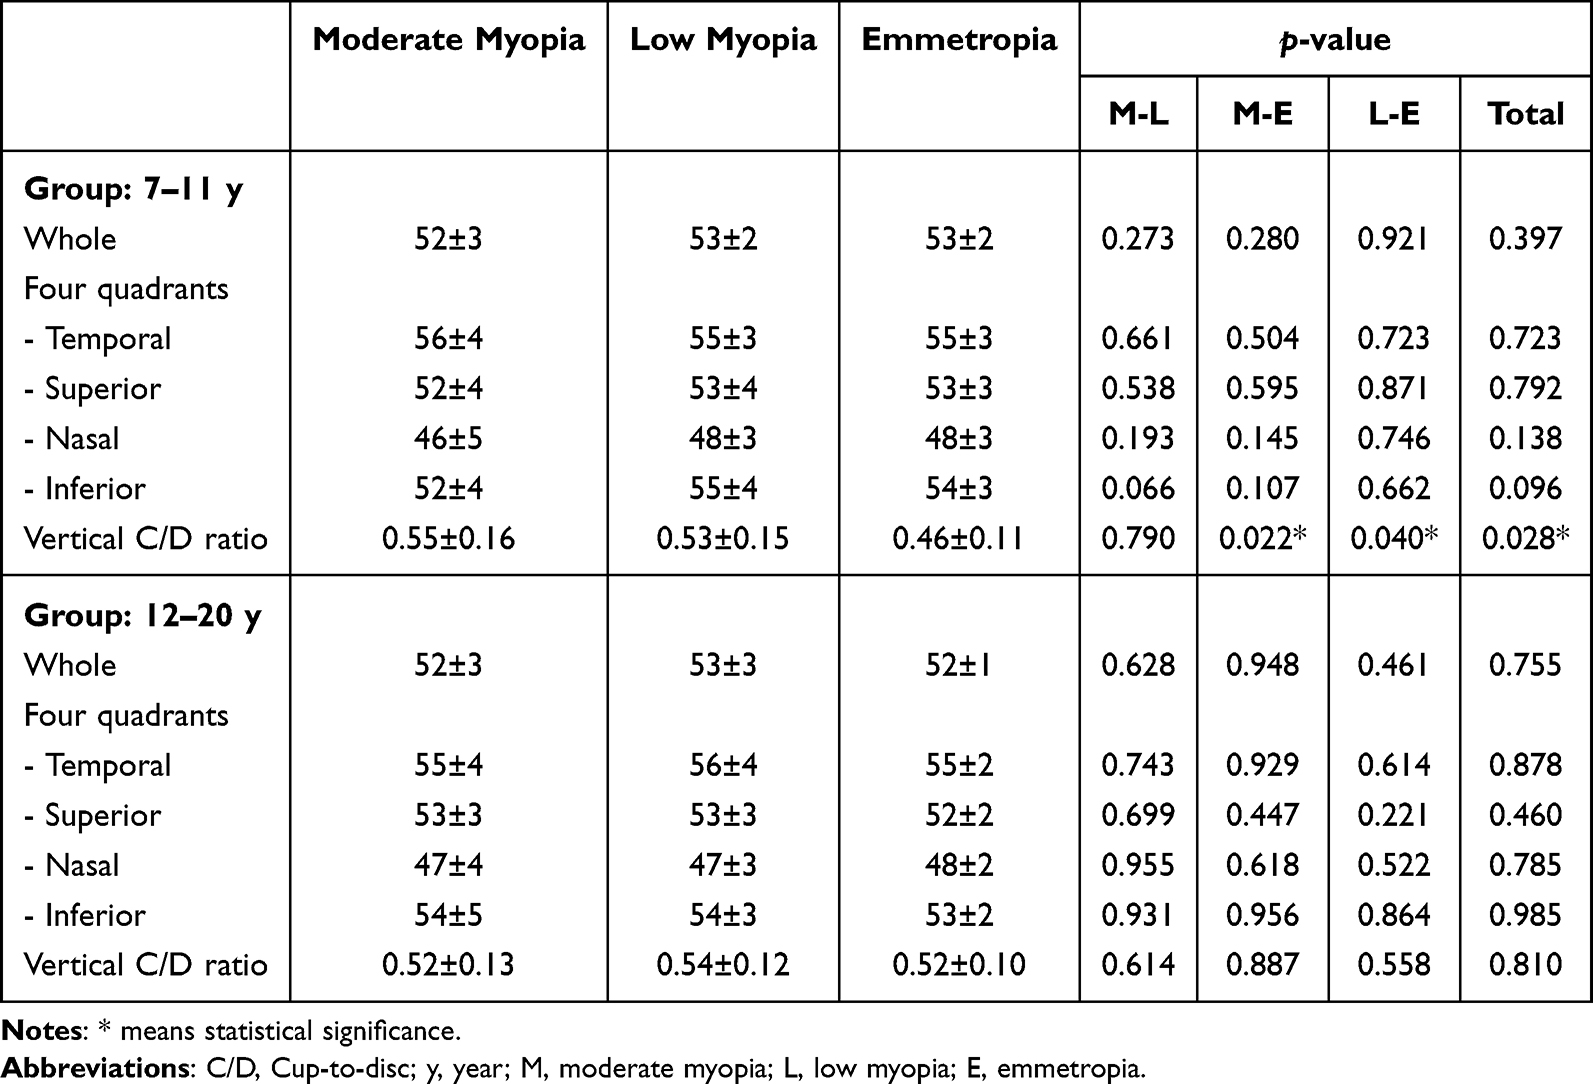 |
Table 5 Peripapillary Small Vessel Density and C/D Ratio of the 7–11 y and 12–20 y Groups |
Discussion
Macular Structure and Perfusion Changes
Our study demonstrated that myopic eyes, compared to emmetropic eyes, exhibit thinner retinas and reduced superficial vessel density in the macular region, and that the regional distribution of these changes shifts with age. In children aged 7–11, moderate myopic eyes already showed significantly thinner parafoveal retinal thickness than emmetropic eyes, especially in the superior and nasal quadrants by 8–10 μm reduction. This is consistent with trends seen in adolescent subjects and indicates that myopia begins to affect macular structure at an early stage. Even more noteworthy is the pattern of superficial microvascular changes: in younger myopic children, the reduction in macular vessel density was localized primarily to the temporal parafoveal region, with no significant change in the nasal side. However, among adolescents (12–20y), we observed the opposite pattern: the myopic group exhibited more pronounced perfusion loss in the nasal and inferior parafoveal regions, whereas the temporal side no longer showed a marked difference.
Our findings suggest a shift in the locus of microvascular compromise from the temporal parafovea in early myopia to the nasal parafovea in later stages of myopia. One possible hypothesis is that early axial elongation imposes greater mechanical stretch on the temporal macula, which lies farther from the relatively anchored optic nerve head, whereas with further myopic progression, cumulative stretch may extend toward tissue closer to the optic nerve, resulting in more prominent perfusion loss on the nasal side. Nevertheless, these regional perfusion patterns should be interpreted with caution, as OCTA-based vascular metrics are subject to known physiological fluctuations and technical variability in measurements, as emphasized in recent OCTA methodology studies.9 Although pediatric OCTA studies with quadrant-level analysis are limited, our results align with reports that myopic children and adolescents overall have lower macular superficial capillary density compared to age-matched emmetropes.10,11 Our data add nuance by examining different pediatric age ranges, suggesting that early-onset versus later-onset myopia may have stage-specific microvascular patterns – with early myopia mainly affecting temporal macular perfusion and later myopia showing prominent nasal-side perfusion loss.
Peripapillary Structure Changes
Our findings in the peripapillary region also reveal interesting age-related changes. First, the RNFL thickness distribution in myopic eyes differed significantly from emmetropic eyes in childhood: in the 7–11y cohort, moderate myopic eyes had a relatively thicker temporal RNFL and a thinner inferior RNFL compared to emmetropes. Although counterintuitive at first glance that moderate myopes showed a higher temporal RNFL value than emmetropes, this aligns with the mechanism of myopia-induced RNFL redistribution. Research indicates that with increasing myopic severity, the RNFL in the superior, inferior, and nasal quadrants becomes thinner, while the temporal RNFL can appear thicker.12 This is thought to result from axial elongation altering the orientation of nerve fibers around the optic disc, so that temporally displaced fibers present as an apparent thickening on circular scans.13 The temporal RNFL thickness difference we observed in younger eyes (myopes > emmetropes) fits this pattern. However, by the time of adolescence (12–20y), we found that the inter-group difference in temporal RNFL disappeared, likely because with further myopic progression, RNFL thinning occurs in all quadrants, so the temporal quadrant no longer stands out and differences are reduced. Meanwhile, the moderate myopia group’s inferior RNFL remained thinner than emmetropes in the older cohort, but the gap was smaller and not significant, suggesting that early myopic effects on RNFL are more region-specific, particularly temporal thickening and inferior thinning, whereas later they transition into a more global change.14
Because our cohort primarily consisted of low to moderate myopes, we did not observe significant peripapillary capillary loss. However, it has been reported that in high myopia, the nasal peripapillary region is the most affected in terms of microvascular perfusion reduction.8 The nasal retina may bear more stretching as the eye elongates, leading to reduced capillary perfusion and corresponding structural changes.15 This pattern can be explained by the anatomical effects of myopic axial elongation and disc tilt according to the prior studies.16
In our 7–11-year cohort, the moderate myopia group showed a significantly larger vertical C/D ratio compared with emmetropic children. Rather than indicating definite early optic cup enlargement, this finding may reflect myopia-related optic disc configuration changes as disc tilt, which can alter the apparent cup shape and influence C/D ratio measurements.12,17 Importantly, this pattern was not observed in the adolescent cohort, suggesting that the early C/D ratio variation may be influenced by sample variability and demographic imbalance. In particular, the emmetropic group in the younger cohort included a higher proportion of female participants, which may have confounded optic disc measurements. Therefore, these findings should be interpreted with caution.
Limitations
This study has several limitations. First, the overall sample size was relatively small, and the age and sex distributions differed across refractive groups, particularly in the 7–11-year age group. As both age and biological sex may influence RNFL thickness, macular structure, and microvascular density, the possibility of residual confounding cannot be completely excluded. Second, given the cross-sectional design, the OCT findings were primarily based on comparisons across different age groups rather than direct observation of longitudinal changes within individuals over time. Third, OCTA, though valuable as a non-invasive imaging tool, remains susceptible to segmentation errors and motion artifacts that may affect vessel density measurements. Fourth, because refractive status was defined at the eye level and spherical equivalent could differ between fellow eyes, both eyes of all participants were included and analyzed as independent observations. Although the inclusion of both eyes may introduce potential inter-eye correlation and affect variance estimates and statistical inference, this approach preserves clinically meaningful refractive classification. Future research should employ longitudinal follow-up with larger, multi-center, and multi-ethnic cohorts to confirm the age- and quadrant-specific patterns we observed.
Conclusion
In conclusion, myopia in children is associated with macular thinning, reduced perfusion, and age-related redistribution of RNFL parameters. Our data suggest that regional patterns of structural and microvascular alterations may vary across pediatric stages, with thinner temporal parafoveal RNFL and thicker temporal peripapillary retinal thickness in younger children. These findings highlight the importance of careful evaluation of both parafoveal and peripapillary regions for the early detection and longitudinal monitoring of myopia-related changes.
Clinical Trial Registration
National Taiwan University Hospital Hsin-Chu Branch IRB (111-038-F).
Abbreviations
RT, retinal thickness; SVD, superficial vessel density; RNFL, retinal nerve fiber layer; VD, vessel density; OCT, optical coherence tomography; OCTA, optical coherence tomography angiography; C/D ratio, cup-to-disc ratio.
Acknowledgments
The authors appreciated the National Taiwan University Hospital Hsin-Chu Branch for permission to use the database and publish this study.
Author Contributions
All authors made a significant contribution to the work reported, whether that is in the conception, study design, execution, acquisition of data, analysis and interpretation, or in all these areas; took part in drafting, revising or critically reviewing the article; gave final approval of the version to be published; have agreed on the journal to which the article has been submitted; and agree to be accountable for all aspects of the work.
Funding
This work was funded by the National Science and Technology Council of Taiwan (NSTC 114-2221-E-002 −096-).
Disclosure
The authors report there are no competing interests for this work.
References
1. Karlin DB, Curtin BJ. Peripheral chorioretinal lesions and axial length of the myopic eye. Am J Ophthalmol. 1976;81(5):625–9. doi:10.1016/0002-9394(76)90129-x
2. Zhao Z, Jiang C. Effect of myopia on ganglion cell complex and peripapillary retinal nerve fibre layer measurements: a Fourier-domain optical coherence tomography study of young Chinese persons. Clin Exp Ophthalmol. 2013;41(6):561–566. doi:10.1111/ceo.12045
3. Xie R, Zhou XT, Lu F, et al. Correlation between myopia and major biometric parameters of the eye: a retrospective clinical study. Optom Vis Sci. 2009;86(5):E503–8. doi:10.1097/OPX.0b013e31819f9bc5
4. Man RE, Lamoureux EL, Taouk Y, et al. Axial length, retinal function, and oxygen consumption: a potential mechanism for a lower risk of diabetic retinopathy in longer eyes. Invest Ophthalmol Vis Sci. 2013;54(12):7691–7698. doi:10.1167/iovs.13-12412
5. La Spina C, Corvi F, Bandello F, Querques G. Static characteristics and dynamic functionality of retinal vessels in longer eyes with or without pathologic myopia. Graefes Arch Clin Exp Ophthalmol. 2016;254(5):827–834. doi:10.1007/s00417-015-3122-z
6. Jonas JB, Xu L. Histological changes of high axial myopia. Eye. 2014;28(2):113–117. doi:10.1038/eye.2013.223
7. Pua TS, Hairol MI. Evaluating retinal thickness classification in children: a comparison between pediatric and adult optical coherence tomography databases. PLoS One. 2024;19(12):e0314395. doi:10.1371/journal.pone.0314395
8. Wang T, Li H, Zhang R, Yu Y, Xiao X, Wu C. Evaluation of retinal vascular density and related factors in youth myopia without maculopathy using OCTA. Sci Rep. 2021;11(1):15361. doi:10.1038/s41598-021-94909-8
9. Frisina R, De Salvo G, Tozzi L, et al. Effects of physiological fluctuations on the estimation of vascular flow in eyes with idiopathic macular pucker. Eye. 2023;37(7):1470–1478. doi:10.1038/s41433-022-02158-4
10. Abdellah MM, Amer AA, Eldaly ZH, Anber MA. Optical coherence tomography angiography of the macula of high myopia in children and adolescents. Int J Retina Vitreous. 2024;10(1):17. doi:10.1186/s40942-024-00532-w
11. Meng Y, Yi ZH, Xu YS, He L, Li L, Chen CZ. Changes in macular vascular density and retinal thickness in young myopic adults without pathological changes: an OCTA study. Eur Rev Med Pharmacol Sci. 2022;26(16):5736–5744. doi:10.26355/eurrev_202208_29510
12. Sim B, Chong RS, Htoon HM, Balakrishnan M, Brennan NA, Chia A. Associations of optic nerve head morphology and peripapillary retinal nerve fibre layer thickness with myopic severity and treatment in children. Asia-Pac J Ophthalmol. 2024;13(6):100112. doi:10.1016/j.apjo.2024.100112
13. Zhang XJ, Wang YM, Jue Z, et al. Interocular symmetry in retinal nerve fiber layer thickness in children: the Hong Kong Children Eye Study. Ophthalmol Ther. 2023;12(6):3373–3382. doi:10.1007/s40123-023-00825-7
14. Tai ELM, Ling JL, Gan EH, Adil H, Wan-Hazabbah WH. Comparison of peripapillary retinal nerve fiber layer thickness between myopia severity groups and controls. Int J Ophthalmol. 2018;11(2):274–278. doi:10.18240/ijo.2018.02.16
15. Xiao H, Zhong Y, Ling Y, Xu X, Liu X. Longitudinal changes in peripapillary retinal nerve fiber layer and macular ganglion cell inner plexiform layer in progressive myopia and glaucoma among adolescents. Front Med. 2022;9. doi:10.3389/fmed.2022.828991
16. Zhang XJ, Lau YH, Wang YM, et al. Thicker retinal nerve fiber layer with age among schoolchildren: the Hong Kong Children Eye Study. Diagnostics. 2022;12(2). doi:10.3390/diagnostics12020500
17. Chan PP, Zhang Y, Pang CP. Myopic tilted disc: mechanism, clinical significance, and public health implication. Front Med. 2023;10:1094937. doi:10.3389/fmed.2023.1094937
 © 2026 The Author(s). This work is published and licensed by Dove Medical Press Limited. The
full terms of this license are available at https://www.dovepress.com/terms
and incorporate the Creative Commons Attribution
- Non Commercial (unported, 4.0) License.
By accessing the work you hereby accept the Terms. Non-commercial uses of the work are permitted
without any further permission from Dove Medical Press Limited, provided the work is properly
attributed. For permission for commercial use of this work, please see paragraphs 4.2 and 5 of our Terms.
© 2026 The Author(s). This work is published and licensed by Dove Medical Press Limited. The
full terms of this license are available at https://www.dovepress.com/terms
and incorporate the Creative Commons Attribution
- Non Commercial (unported, 4.0) License.
By accessing the work you hereby accept the Terms. Non-commercial uses of the work are permitted
without any further permission from Dove Medical Press Limited, provided the work is properly
attributed. For permission for commercial use of this work, please see paragraphs 4.2 and 5 of our Terms.