Back to Journals » Journal of Pain Research » Volume 13
Differences in Estimates of Post-Herpetic Neuralgia Between Medical Chart Review and Self-Report
Authors Tanenbaum HC ![]() , Lawless A, Sy LS
, Lawless A, Sy LS ![]() , Hong V
, Hong V ![]() , Ackerson B
, Ackerson B ![]() , Bruxvoort K
, Bruxvoort K ![]() , Luo Y, Tseng HF
, Luo Y, Tseng HF
Received 26 March 2020
Accepted for publication 4 July 2020
Published 13 July 2020 Volume 2020:13 Pages 1757—1762
DOI https://doi.org/10.2147/JPR.S255238
Checked for plagiarism Yes
Review by Single anonymous peer review
Peer reviewer comments 3
Editor who approved publication: Dr Michael Schatman
Hilary C Tanenbaum, Anna Lawless, Lina S Sy, Vennis Hong, Bradley Ackerson, Katia Bruxvoort, Yi Luo, Hung Fu Tseng
Kaiser Permanente Southern California, Department of Research and Evaluation, Pasadena, CA, USA
Correspondence: Hung Fu Tseng Tel +1 626 564-3451
Fax +1 626 564-3409
Email [email protected]
Purpose: Post-herpetic neuralgia (PHN) is a common herpes zoster (HZ) complication, where pain persists 90 days after the initial HZ diagnosis. Evaluating PHN risk is essential for determining the burden on patients and health-care systems, but research shows variable estimates. The extent to which these differences are related to the assessment method has not been examined. The purpose of this study is to compare the proportion of PHN among HZ patients measured by medical chart review and self-report surveys.
Methods: PHN risk was assessed among a sample of Kaiser Permanente Southern California members with HZ. Chart reviews identified lingering pain 90– 180 days post-HZ diagnosis and the Zoster Brief Pain Inventory was administered 90 days post-HZ diagnosis by telephone. Frequencies of PHN identified with each approach were cross-tabulated and stratified by sex, age group, and zoster vaccine live vaccination status.
Results: Chart review and self-report were largely concordant (n=875, 89.20%); however, chart review yielded lower PHN risk overall and for the stratified subgroups. PHN from self-report was substantially higher (6.30– 8.33%) among patients who were male, ≥ 70 years, or unvaccinated. Among those who typically seek care more often (female, younger, vaccinated), the discrepancy between each method was notably lower (1.60– 2.92%).
Conclusion: Our findings suggest that chart review underestimates cases among those less likely to seek health care, including males, the elderly, and unvaccinated individuals. The agreement between the methods indicates that each can provide a reasonable approximation of PHN, but analyses should carefully control for health-care utilization.
Keywords: post-herpetic neuralgia, pain, herpes zoster
Introduction
Herpes zoster (HZ) is a viral infection caused by the reactivation of latent varicella zoster virus, typically presenting as a painful rash along a single dermatome. The most common complication of HZ is post-herpetic neuralgia (PHN), a debilitating condition of intense and often treatment-resistant pain that can persist for years after the initial HZ diagnosis.1 PHN can profoundly impact patients’ quality of life2,3 and increase health-care utilization.4 Estimates of PHN vary widely, ranging from 5% to 30%.5–8 In addition to differences in study design, patient characteristics, PHN definition, and HZ vaccination status, the approach used to assess pain likely impacts these estimates as well, although this has not been well examined.
Accurately assessing pain is important for epidemiological estimates of HZ and PHN, as well as for studies of vaccine effectiveness; however, pain can be difficult to quantify. Existing research has relied on several methods to evaluate PHN. Although there are advantages to each, there are also distinct opportunities to introduce error. Programming approaches, such as electronic algorithms using diagnosis codes and medications from electronic health records (EHR), are time-consuming to validate, and may over- or under-estimate cases that are not coded correctly.9 In addition, variation in treating chronic pain can make algorithm development difficult. Other approaches may increase sensitivity or specificity in the identification of PHN but are more labor-intensive. While manual review of EHR can provide a good estimate of health-care utilization related to pain, this approach is susceptible to human error and may underreport PHN cases among individuals who seek care less often.10 Although arguably the best assessment of an individual’s experience, self-reported pain is multi-dimensional and highly subjective and may be impacted by a variety of other factors, such as additional comorbidities, level of education, and quality of life.11–13
For PHN, variation in study designs and sample populations makes it challenging to tease out how different approaches for measuring pain impact estimates of risk. Despite the widespread use of chart review and self-report for pain assessment, little research exists comparing outcomes obtained with each method. In an effort to help clarify this issue, we compared PHN risk assessed using both manual chart review and self-report.
Methods
The study was conducted at Kaiser Permanente Southern California, an integrated health-care delivery system serving over 4 million members. We calculated the risk of PHN among patients with laboratory-confirmed incident HZ between January 2012–February 2015 using both chart review of EHR and self-reported surveys. For laboratory confirmation, trained research associates collected at least two specimens of skin lesions per the protocol from the National Varicella Zoster Virus Laboratory at the Centers for Disease Control and Prevention, where standard polymerase chain reaction tests were performed.14 Patients were identified using EHR in a previous study examining the risk of PHN in HZ patients vaccinated and not vaccinated with zoster vaccine live (ZVL). Patients age ≥60 years were included with the exception of two younger patients who were selected as part of the matching process, described in detail elsewhere.15 Demographic information was obtained from EHR and face-to-face interviews conducted at baseline.
For self-report, the Zoster Brief Pain Inventory (ZBPI), a validated survey modified from the Brief Pain Inventory specifically to evaluate HZ- and PHN-related pain,16 was administered to study participants by phone interview at 90 days post-HZ diagnosis. One question asked patients to rate their worst pain in the past 24 hours on a scale of 1 to 10, with a higher number indicating more severe pain. A score ≥3 was considered to meet the operational definition of PHN.16
For chart review, EHR of medical visits occurring 90–180 days after the initial HZ diagnosis for the same sample population were reviewed by trained research associates for evidence of pain persisting at the site of the original HZ rash. Prior studies have used a variety of cut-off points to define PHN.6,11,16-18 We opted to include visits occurring in the 90–180 day post-HZ diagnosis window in order to align with the administration of the ZBPI at day 90, as well as capture individuals who may delay in seeking care for symptoms. The following descriptors were included as pain-related symptoms: tingling, heat/burning sensation, irritation, discomfort, and paresthesia. Pain was classified as PHN if it was consistent with the HZ episode and could not be explained by other obvious causes. Because of variation in provider documentation, pain severity could not be measured. A diagnosis of PHN made by a physician or attached to a prescription medication was also included as a PHN case. Recurrent HZ cases (where HZ symptoms resolved and subsequently returned) during the 90–180-day window were not considered to be PHN.
For our analysis, we excluded any patients missing ZBPI assessments. The study was reviewed and approved by the KPSC Institutional Review Board. For the original recruitment study, all participants provided written informed consent. A waiver of informed consent was granted for this study.
Analysis
Descriptive statistics were calculated for the study population. To assess differences in PHN ascertainment with each method, we cross-tabulated frequencies of PHN identified from chart review with self-report. To further evaluate how each approach differed in subsets of the population, we also stratified these analyses by sex, age group (<70, ≥70 years), and ZVL vaccination status. Due to the age distribution of our study participants, we used 70 years as the cut-off point for our comparison of younger and older groups. Analyses were conducted using SAS 9.3 (SAS Institute, Inc, Cary, North Carolina).
Results
General Characteristics
Among the 1018 patients who were included in the study, 37 were unable to be reached to administer the ZBPI and were excluded from the study. The final sample population comprised 981 patients, including 616 females (62.79%) and 365 males (37.21%), and there were 314 participants (32.01%) age <70 years and 667 (67.99%) age ≥70 years (Table 1). Multiple racial/ethnic groups were represented, including White (n=558, 56.88%), Hispanic (n=205, 20.90%), Asian (n=99, 10.09%), and Black (n=70, 7.14%). The most common level of education attained was a bachelor’s degree or above (n=370, 37.72%). Most of the participants were retired (n=767, 78.19%). The majority of patients were married/living with partner (n=664, 67.69%).
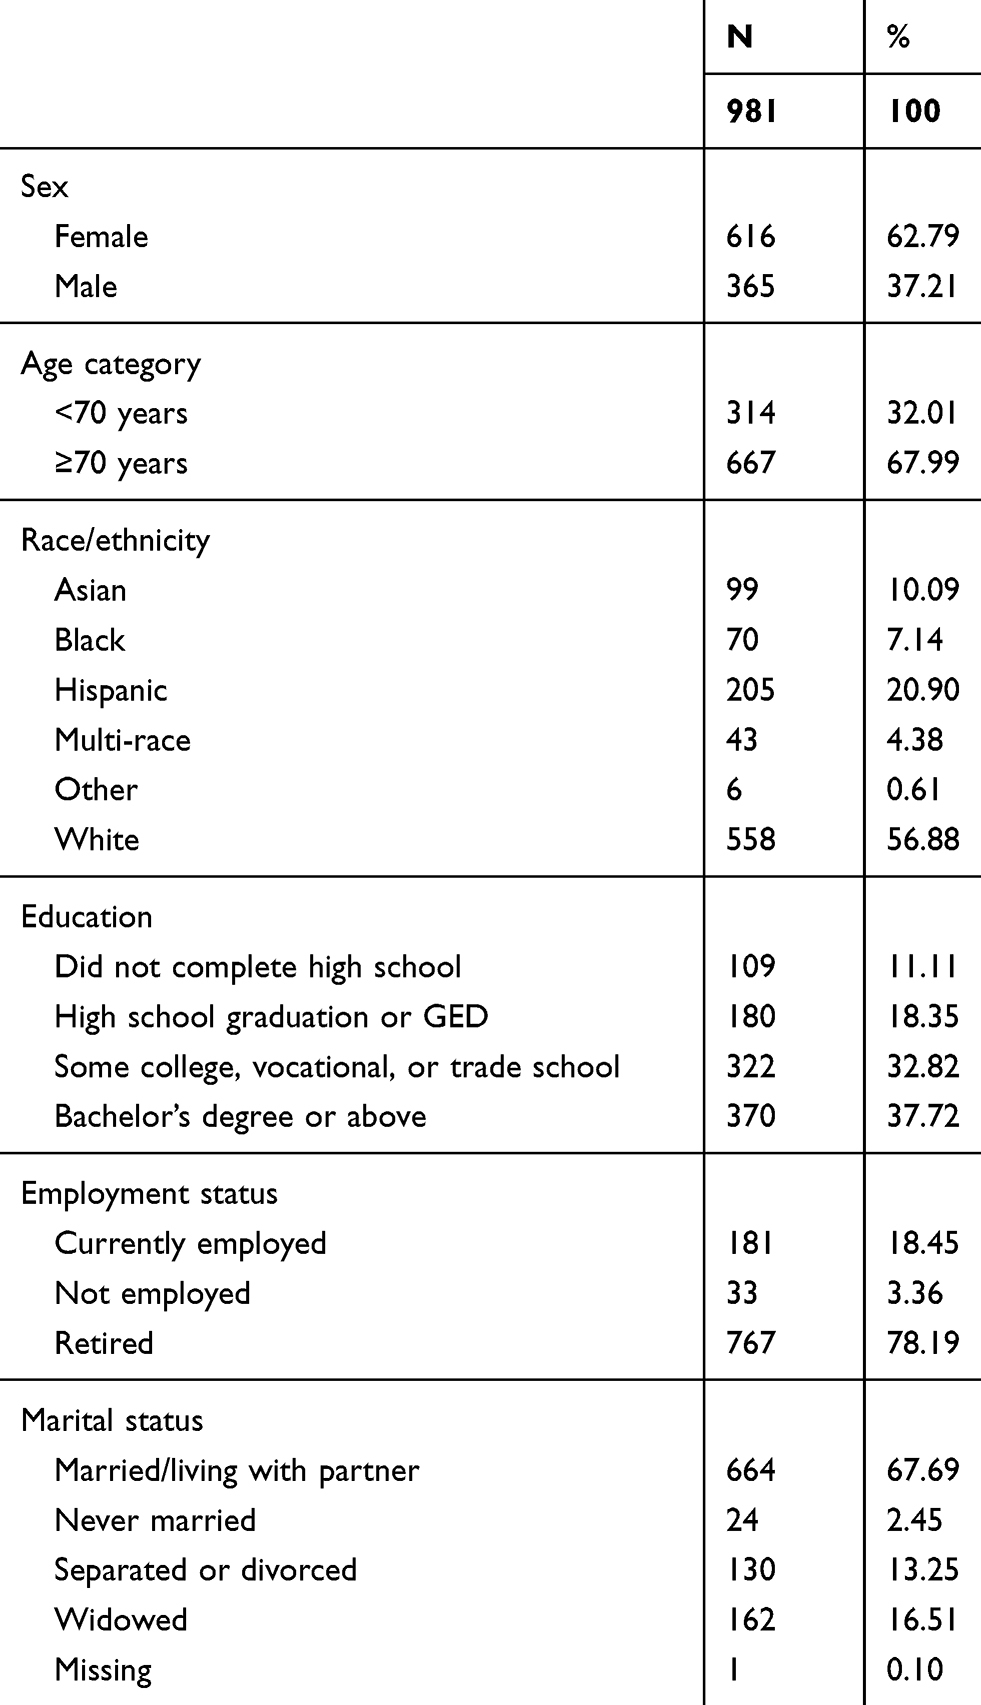 |
Table 1 General Characteristics of the Study Population |
Chart Review
Using our chart review criteria, we found a PHN risk of 7.34% (n=72) (Table 2). We identified a higher proportion of females (n=52, 8.44%) with PHN compared to males (n=20, 5.48%) (Table 3). Between the age groups, PHN varied by a small percentage (<70 years: n=19, 6.05%; ≥70 years: n=53, 7.95%), and was comparable among vaccinated (n=38, 7.58%) and unvaccinated (n=34, 7.08%) individuals.
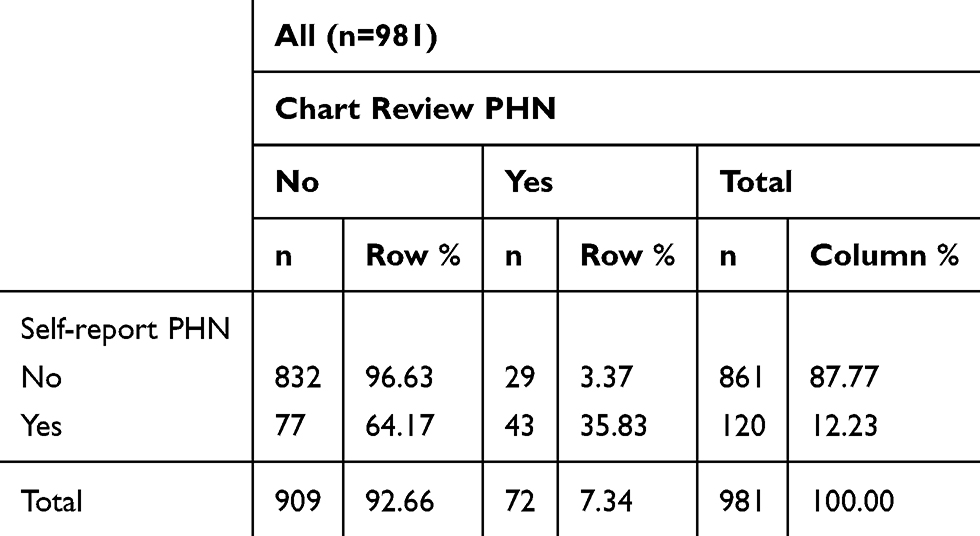 |
Table 2 Post-Herpetic Neuralgia (PHN) Identified with Chart Review and the Zoster Brief Pain Inventory |
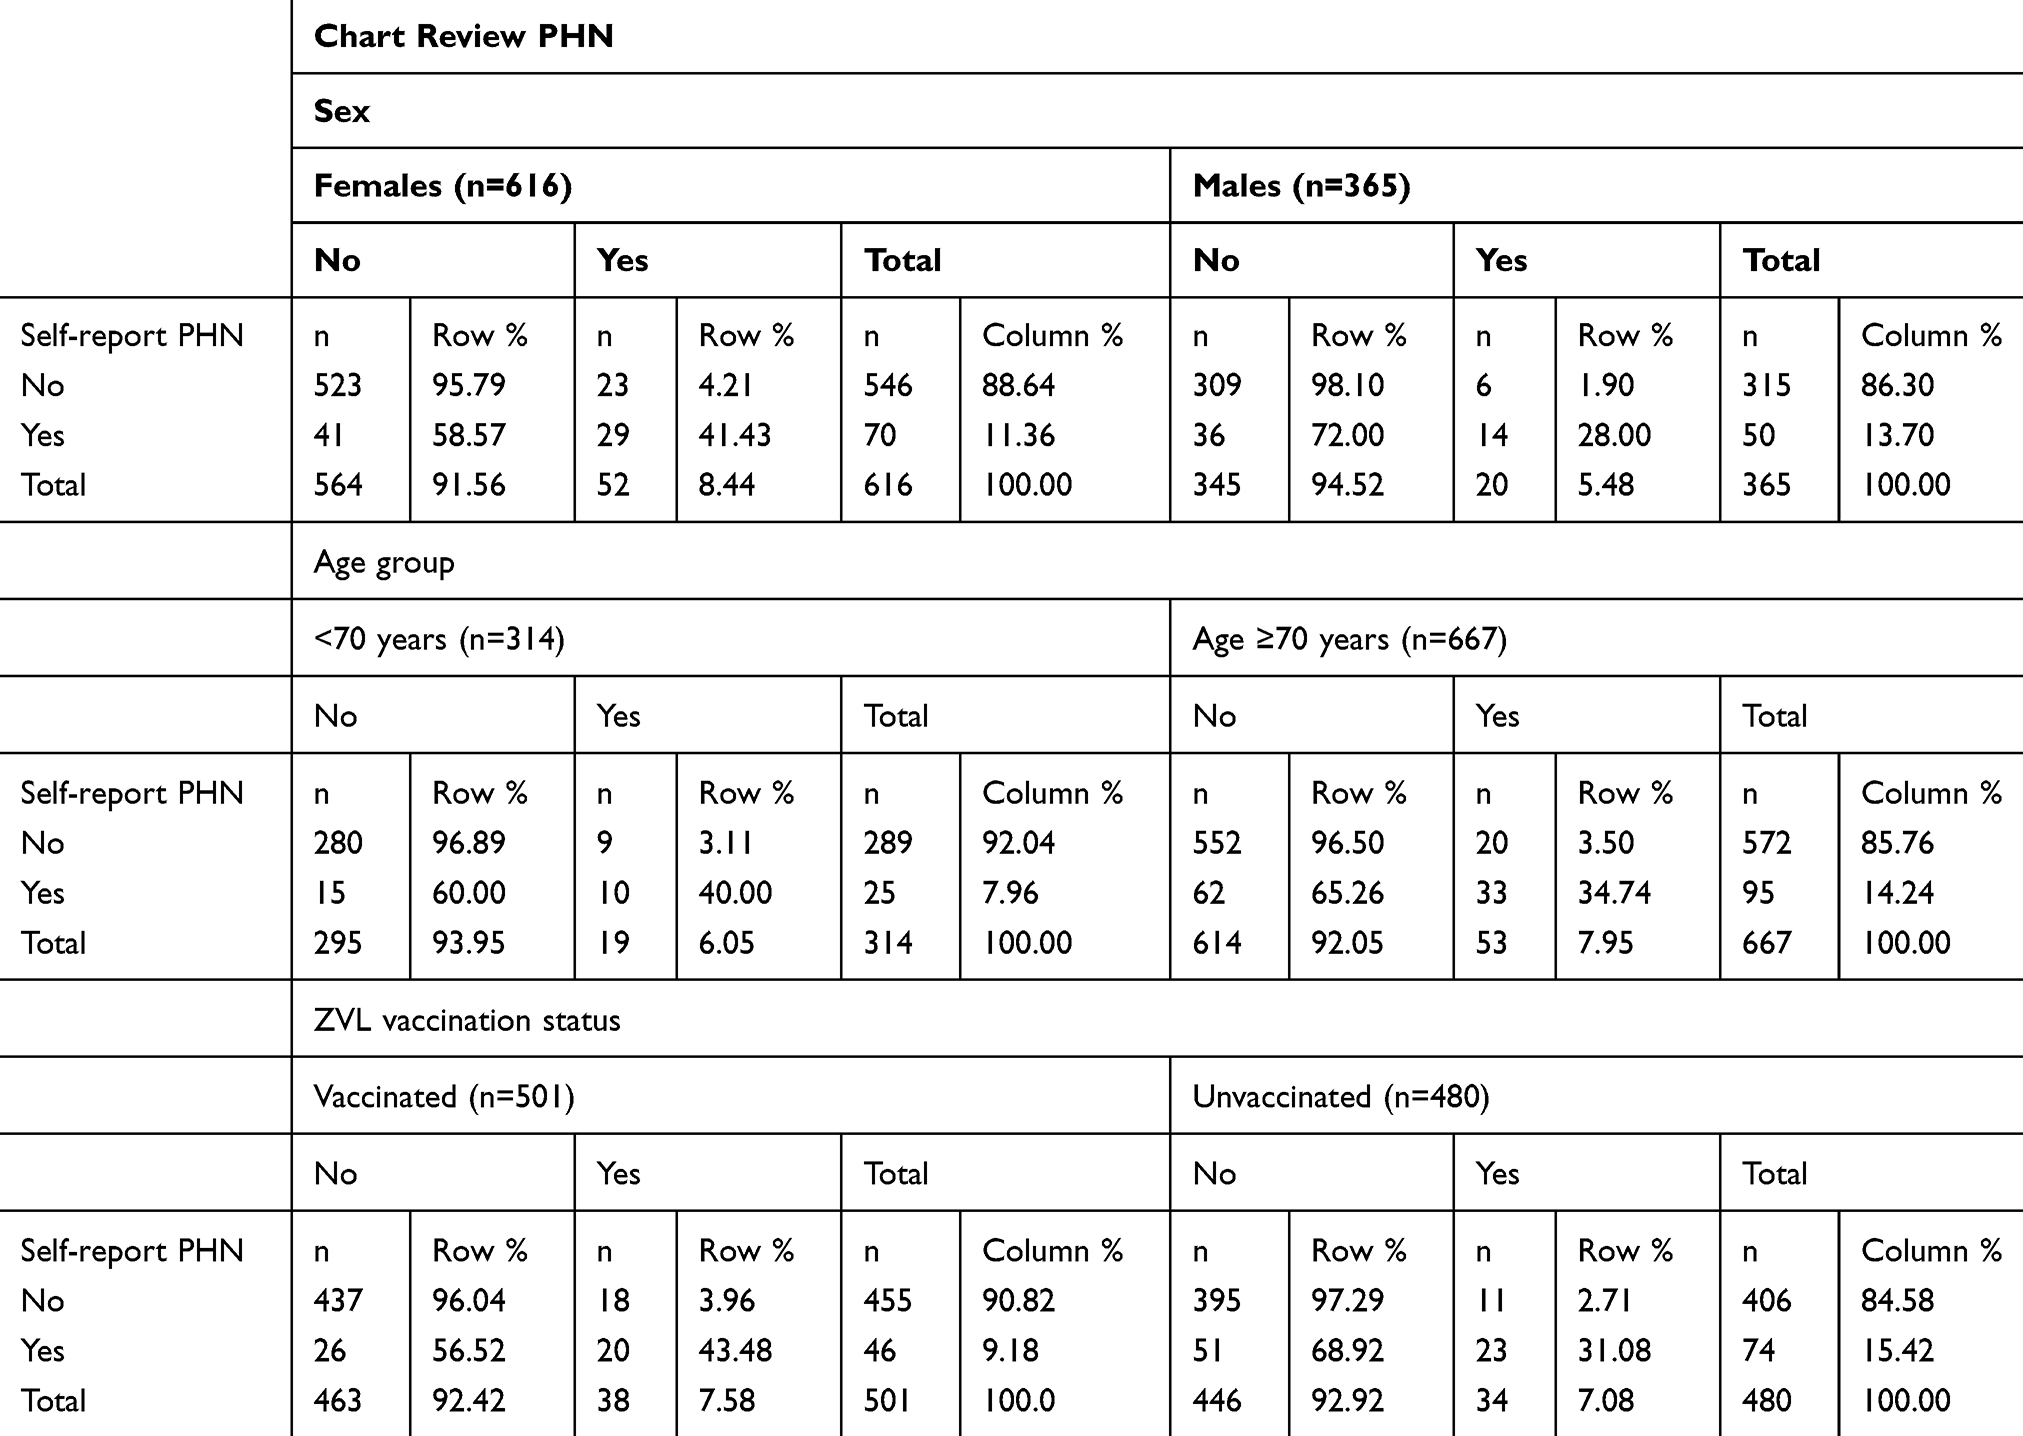 |
Table 3 Post-Herpetic Neuralgia (PHN) Identified with Chart Review and the Zoster Brief Pain Inventory, by Sex, Age Group, and Zoster Vaccine Live (ZVL) Vaccination Status |
Self-Report
At 90 days post-HZ diagnosis, 12.23% (n=120) of the study population met the operational definition for PHN (Table 2) from the self-report survey. PHN risk was relatively similar between sexes, identified among 11.36% (n=70) of females and 13.70% (n=50) of males (Table 3). The percentage of individuals with PHN from self-report was almost twice as great among those age ≥70 years (n=95, 14.24%) compared to age <70 years (n=25, 7.96%). PHN risk among those who had received ZVL vaccination (n=46, 9.18%) was also substantially lower than among unvaccinated individuals (n=74, 15.42%).
Chart Review and Self-Report
The two approaches were largely in agreement, with 89.20% (n=875) concordance. While chart review yielded lower estimates of PHN than self-report for the overall study population, as well as for the sex-, age-, and vaccination status-subsets, we also found some differences between the two approaches. Among the 981 participants, 29 (2.96%) PHN cases were identified through chart review but not self-report, and 77 (7.85%) were classified as having PHN from self-report, but evidence of PHN was not found from chart review (Table 2).
Although PHN risk from self-report was slightly higher among males than females (13.70% and 11.36%, respectively), it was lower from chart review (5.48% and 8.44%, respectively). The difference between PHN risk identified with the two methods was notably smaller among females (2.92%) than males (8.22%).
In the younger group, PHN risk identified with each method varied only by 1.91% (chart review: 6.05%, self-report: 7.96%), whereas the discrepancy was substantially greater (6.30%) in the older population (chart review: 7.95%, self-report: 14.24%).
The difference in PHN risk detected with each method was minimal (1.60%) among vaccinated individuals (chart review: 7.58%, self-report: 9.18%). In the unvaccinated group, however, the discrepancy between the two approaches was much more pronounced (8.33%; chart review: 7.08%, self-report: 15.42%).
Discussion
Our two approaches to evaluate PHN risk provide insight about the variation found in existing literature and highlights the ways in which each may capture different outcomes. This comparison is important for determining the best approach to assess PHN in future work, such as vaccine effectiveness studies, evaluating new treatment modalities for PHN, or calculating related health-care costs.
We found notable discrepancies in PHN risk estimates ascertained with self-report versus chart review, with approximately 5% greater risk identified from self-report. A previous study conducted among cancer patients also noted a substantial difference between self-reported symptoms and chart review, with the prevalence of pain obtained from patient surveys almost twice that of chart review.19
PHN detected with chart review is likely influenced by health-seeking behavior.20 Although a higher percentage of males reported pain ≥3 on the ZBPI compared to females (13.70% and 11.36%, respectively), a smaller proportion had a PHN-related visit (males: 5.48%, females: 8.44%). This is aligned with prior research indicating more frequent health-care utilization among females.21 We also found that PHN estimates obtained with each approach were much closer among the younger age group (6.05% chart review, 7.96% self-report) than the older group (7.95% chart review, 14.24% self-report), which could potentially be related to additional barriers to seeking medical attention among older individuals, such as mobility or transportation issues.22 Furthermore, previous research has reported that health-care utilization tends to be higher among vaccinated individuals.10 Our results support this as well, with marked discordance between the two methods among unvaccinated participants (chart review: 7.08%, self-report: 15.42%), and a much smaller difference among vaccinated individuals (chart review: 7.58%, self-report: 9.18%).
Several additional factors may explain the disagreement between the results detected with each approach. While the ZBPI defined PHN as pain severity ≥3, our chart review considered any mention of pain (or the related keywords) persisting at the original site of the HZ rash as PHN, irrespective of pain level,16 as this was not consistently captured in EHR. Therefore, PHN identified by the chart review would not necessarily meet the ZBPI pain score used in our operational definition of PHN. In addition, our chart review captured cases where a prescription for pain medication was attached to a PHN diagnosis, whereas pain that was well controlled by medication could have been missed by the ZBPI. It was also possible that pain that was initially manageable with medication at the time of the ZBPI administration stopped being effective at a later date or that patients who experienced no relief from prescription medication or other treatment modalities could have believed that further care was futile and opted not to see their doctor. Furthermore, while pain was solicited in the self-report approach, chart review depended on the patient mentioning pain and the provider documenting it accordingly. Variation in day-to-day pain might also explain why chart review captured certain PHN cases that the ZBPI missed, which has been previously noted in research.16 Finally, the different timeframes used for each approach might have contributed to discrepancies.
There are some limitations to consider when interpreting our results. While the ZBPI appears to capture PHN more comprehensively than chart review, there are possible sources of error which should be noted. As with all self-reported measures, the potential for non-response bias exists (ie, patients who agreed to participate in the study may have differed from non-participants). For the original study, 47.64% of eligible patients contacted declined participation (45% of vaccinated, 56% of unvaccinated).15 Among the 1018 patients included in this study, 37 (3.63%) could not be reached for the survey administration at 90 days post-HZ diagnosis. We did not investigate patterns of missingness and are unable to determine if this had any effect on our results. In addition, despite the short timeframe asked about in the ZBPI (past 24 hours), respondents may experience recall error.23
Finally, additional factors that might affect health-seeking behavior could impact the measurement from chart review and further affect the concordance between the two approaches.
Conclusion
Our findings highlight the value of each method in the assessment of specific endpoints related to long-term pain following HZ. While the ZBPI appears better suited to capture the burden of illness experienced by the patient, administering these surveys is not feasible for large, observational studies, and there is potential for non-response bias. EHR are available for chart review on all members. However, chart review can potentially underestimate PHN risk—particularly among unvaccinated individuals—which would thus affect HZ vaccine effectiveness estimates, likely due to differences in health-care utilization among certain subpopulations. Therefore, adjusting for variables indicative of health-seeking behavior, such as prior utilization, is essential.
Research Data for This Article
Due to patient confidentiality, raw data for this study cannot be made available.
Acknowledgments
The authors thank Rafael Harpaz for his helpful review of the manuscript, Harpreet Takhar for project management, and the patients who participated in the study.
Disclosure
Ackerson, Bruxvoort, Lawless, Luo, Sy, Tanenbaum and Tseng report research support from GlaxoSmithKline for studies unrelated to this paper. Ackerson, Bruxvoort and Sy report research support from Dynavax for studies unrelated to this paper. Ackerson, Bruxvoort, Luo, Sy, Tanenbaum and Tseng report research support from Seqirus for studies unrelated to this paper. Tseng, Ackerson, Luo and Sy report research support from Novavax for studies unrelated to this paper. The authors report no other possible conflicts of interest in this work.
References
1. Yawn BP. Post-shingles neuralgia by any definition is painful, but is it PHN? Mayo Clin Proc. 2011;86(12):1141–1142. doi:10.4065/mcp.2011.0724
2. Johnson RW, Bouhassira D, Kassianos G, Leplege A, Schmader KE, Weinke T. The impact of herpes zoster and post-herpetic neuralgia on quality-of-life. BMC Med. 2010;8(1):37. doi:10.1186/1741-7015-8-37
3. van Wijck AJM, Aerssens YR, Pain I. Quality of life, and costs after herpes zoster. Pain Pract. 2017;17(6):738–746. doi:10.1111/papr.12518
4. Friesen KJ, Chateau D, Falk J, Alessi-Severini S, Bugden S. Cost of shingles: population based burden of disease analysis of herpes zoster and postherpetic neuralgia. BMC Infect Dis. 2017;17(1):69. doi:10.1186/s12879-017-2185-3
5. Klein NP, Bartlett J, Fireman B, et al. Long-term effectiveness of zoster vaccine live for postherpetic neuralgia prevention. Vaccine. 2019;37(36):5422–5427. doi:10.1016/j.vaccine.2019.07.004
6. Forbes HJ, Bhaskaran K, Thomas SL, et al. Quantification of risk factors for postherpetic neuralgia in herpes zoster patients: a cohort study. Neurology. 2016;87(1):94–102. doi:10.1212/WNL.0000000000002808
7. Klompas M, Kulldorff M, Vilk Y, Bialek SR, Harpaz R. Herpes zoster and postherpetic neuralgia surveillance using structured electronic data. Mayo Clin Proc. 2011;86(12):1146–1153. doi:10.4065/mcp.2011.0305
8. Kawai K, Gebremeskel BG, Acosta CJ. Systematic review of incidence and complications of herpes zoster: towards a global perspective. BMJ Open. 2014;4(6):e004833. doi:10.1136/bmjopen-2014-004833
9. Yawn BP, Wollan P, St. Sauver J. Comparing shingles incidence and complication rates from medical record review and administrative database estimates: how close are they? Am J Epidemiol. 2011;174(9):1054–1061. doi:10.1093/aje/kwr206
10. Tseng HF, Lewin B, Hales CM, et al. Zoster vaccine and the risk of postherpetic neuralgia in patients who developed herpes zoster despite having received the zoster vaccine. J Infect Dis. 2015;212(8):1222–1231. doi:10.1093/infdis/jiv244
11. Dworkin RH, Gnann JW
12. Juhakoski R, Tenhonen S, Anttonen T, Kauppinen T, Arokoski JP. Factors affecting self-reported pain and physical function in patients with hip osteoarthritis. Arch Phys Med Rehabil. 2008;89(6):1066–1073. doi:10.1016/j.apmr.2007.10.036
13. Frampton CL, Hughes-Webb P. The measurement of pain. Clin Oncol (R Coll Radiol). 2011;23(6):381–386. doi:10.1016/j.clon.2011.04.008
14. Leung J, Harpaz R, Baughman AL, et al. Evaluation of laboratory methods for diagnosis of varicella. Clin Infect Dis. 2010;51(1):23–32. doi:10.1086/653113
15. Bruxvoort KJ, Liang AS, Harpaz R, et al. Patient report of herpes zoster pain: incremental benefits of zoster vaccine live. Vaccine. 2019;37(26):3478–3484. doi:10.1016/j.vaccine.2019.04.095
16. Coplan PM, Schmader K, Nikas A, et al. Development of a measure of the burden of pain due to herpes zoster and postherpetic neuralgia for prevention trials: adaptation of the brief pain inventory. J Pain. 2004;5(6):344–356. doi:10.1016/j.jpain.2004.06.001
17. Bowsher D. The lifetime occurrence of herpes zoster and prevalence of post-herpetic neuralgia: a retrospective survey in an elderly population. Eur J Pain. 1999;3(4):335–342. doi:10.1016/S1090-3801(99)90015-0
18. Drolet M, Brisson M, Schmader K, et al. Predictors of postherpetic neuralgia among patients with herpes zoster: a prospective study. J Pain. 2010;11(11):1211–1221. doi:10.1016/j.jpain.2010.02.020
19. Sikorskii A, Wyatt G, Tamkus D, Victorson D, Rahbar MH, Ahn S. Concordance between patient reports of cancer-related symptoms and medical records documentation. J Pain Symptom Manage. 2012;44(3):362–372. doi:10.1016/j.jpainsymman.2011.09.017
20. Hales CM, Harpaz R, Bialek SR. Self-reported herpes zoster, pain, and health care seeking in the Health and Retirement Study: implications for interpretation of health care–based studies. Ann Epidemiol. 2016;26(6):441–446. e443. doi:10.1016/j.annepidem.2016.04.006
21. Vaidya V, Partha G, Karmakar M. Gender differences in utilization of preventive care services in the United States. J Womens Health. 2012;21(2):140–145. doi:10.1089/jwh.2011.2876
22. Syed ST, Gerber BS, Sharp LK. Traveling towards disease: transportation barriers to health care access. J Community Health. 2013;38(5):976–993. doi:10.1007/s10900-013-9681-1
23. Broderick JE, Schwartz JE, Vikingstad G, Pribbernow M, Grossman S, Stone AA. The accuracy of pain and fatigue items across different reporting periods. Pain. 2008;139(1):146–157. doi:10.1016/j.pain.2008.03.024
 © 2020 The Author(s). This work is published and licensed by Dove Medical Press Limited. The
full terms of this license are available at https://www.dovepress.com/terms
and incorporate the Creative Commons Attribution
- Non Commercial (unported, 3.0) License.
By accessing the work you hereby accept the Terms. Non-commercial uses of the work are permitted
without any further permission from Dove Medical Press Limited, provided the work is properly
attributed. For permission for commercial use of this work, please see paragraphs 4.2 and 5 of our Terms.
© 2020 The Author(s). This work is published and licensed by Dove Medical Press Limited. The
full terms of this license are available at https://www.dovepress.com/terms
and incorporate the Creative Commons Attribution
- Non Commercial (unported, 3.0) License.
By accessing the work you hereby accept the Terms. Non-commercial uses of the work are permitted
without any further permission from Dove Medical Press Limited, provided the work is properly
attributed. For permission for commercial use of this work, please see paragraphs 4.2 and 5 of our Terms.