Back to Journals » International Journal of Chronic Obstructive Pulmonary Disease » Volume 15
Differences Between Central Airway Obstruction and Chronic Obstructive Pulmonary Disease Detected with the Forced Oscillation Technique
Authors Yasuo M ![]() , Kitaguchi Y
, Kitaguchi Y ![]() , Tokoro Y
, Tokoro Y ![]() , Kosaka M, Wada Y
, Kosaka M, Wada Y ![]() , Kinjo T, Ushiki A, Yamamoto H
, Kinjo T, Ushiki A, Yamamoto H ![]() , Hanaoka M
, Hanaoka M
Received 19 January 2020
Accepted for publication 24 May 2020
Published 19 June 2020 Volume 2020:15 Pages 1425—1434
DOI https://doi.org/10.2147/COPD.S246126
Checked for plagiarism Yes
Review by Single anonymous peer review
Peer reviewer comments 2
Editor who approved publication: Prof. Dr. Richard Russell
Masanori Yasuo,* Yoshiaki Kitaguchi,* Yayoi Tokoro, Makoto Kosaka, Yosuke Wada, Takumi Kinjo, Atsuhito Ushiki, Hiroshi Yamamoto, Masayuki Hanaoka
The First Department of Internal Medicine, Shinshu University School of Medicine, Matsumoto, Japan
*These authors contributed equally to this work
Correspondence: Masanori Yasuo
The First Department of Internal Medicine, Shinshu University School of Medicine, 3-1-1 Asahi, Matsumoto 390-8621, Japan
Tel +81 263 37 2631
Fax +81 263 36 3722
Email [email protected]
Background: Obstructive ventilatory disturbances occur in both chronic obstructive pulmonary disease (COPD), a typical disease representative of peripheral airway obstruction, and central airway obstruction (CAO). Pulmonary function tests (PFTs), which depend on patient effort, are traditionally used to evaluate lung function. The forced oscillation technique (FOT) is an effort-independent method for examining lung function during tidal breathing. The FOT is used universally to assess respiratory function in patients with COPD. Several studies have measured FOT to assess ventilatory disturbances in CAO. The results showed that FOT measurements in patients with CAO were similar to those reported in patients with COPD. However, no studies have compared FOT measurements directly between CAO and COPD. The aim of this study was to identify differences in ventilatory disturbances between peripheral and central airway obstructions in COPD and CAO, before patients received pharmacological therapy or bronchoscopic interventions, respectively.
Patients and Methods: We retrospectively included 16 patients with CAO (10 cases of tracheal obstruction and 6 cases of bronchial obstruction) and 75 treatment-naïve patients with COPD (60 cases in Global Initiative for Chronic Obstructive Lung Disease [GOLD] stage II and 15 cases in GOLD stage III) that were admitted from December 2013 to May 2017. Prior to treatment, patients were examined with the FOT and PFTs.
Results: All parameters measured with the FOT in the inspiratory phase were significantly worse in patients with CAO than in patients with COPD. The PFTs showed that the CAO group had a significantly lower peak expiratory flow rate. In the airway wall thickening phenotype of COPD, a difference between the inspiratory and expiratory phases of the resonance frequency (ΔFres) was the best indicator for distinguishing between peripheral and central airway obstructions.
Conclusion: This study compared differences between CAO and COPD (mainly GOLD stage II). We found that the FOT measurement, ΔFres, was the optimal indicator of the difference between the airway wall thickening COPD phenotype and CAO. Thus, the difference might be due to mechanical changes that occur in COPD with airway wall thickening.
Keywords: forced oscillation technique, pulmonary function test, quality of life, central airway obstruction, COPD
Introduction
Pulmonary function tests (PFTs) are essential for the diagnosis of chronic obstructive pulmonary disease (COPD).1 PFTs are also used to detect central airway obstruction (CAO) and assess treatment effects. However, PFTs are not suitable for patients with severe tracheobronchial CAO, due to the dependence of these tests on patient effort. The cause of tracheobronchial CAO might be benign or malignant. CAO symptoms resemble those of COPD, including cough, shortness of breath, and stridor. Both diseases also show obstructive ventilatory disturbances.
In 1956, DuBois et al first described the forced oscillation technique (FOT) for evaluating lung function;2 since then, the broadband frequency FOT has been used to evaluate pulmonary function. Recently, broadband frequency FOT was applied to measure lung function and evaluate pulmonary disease status, particularly in COPD and asthma, due to its independence from patient effort. Indeed, the FOT demanded minimal cooperation from subjects.3 The FOT is performed with a small loudspeaker mounted in series with a pneumotachograph. The loudspeaker generates random pressure pulses of 5–35 Hz, which are applied to subjects during tidal breathing. Real-time recordings of pressure-flow oscillations are superimposed on the subject’s tidal breathing to estimate the total respiratory system impedance, including resistance and reactance. The different frequencies of impedance might provide a way to differentiate between central and peripheral airway obstructions.4
Several researchers previously applied the FOT to assess CAO5–7 with the use of impulse oscillometry (MasterScreen IOS; Jaeger, Hoechberg, Germany). This procedure can be used to assess the degree4 and type7 of stenosis in tracheal or upper airway obstruction in the diagnosis stage. In addition, it can be used to estimate the therapeutic effects of treatment by assessing correlations between measurements and symptom improvements, in the therapeutic or follow-up stage.5 We previously reported the usefulness of FOT in evaluating therapeutic effects of interventional bronchoscopy on CAO. In that study, airway resistance was measured in patients with CAO; the FOT was applied with the MostGraph-01 (Chest Co., Ltd., Tokyo, Japan) before and after interventional bronchoscopy.8 We found that the resistance measured at 20 Hz (R20) with the FOT was significantly correlated with the amount of airway dilation achieved with interventional bronchoscopy.8
To date, no study has directly compared FOT measurements between patients with CAO and those with peripheral airway obstruction, such as COPD. In the current study, we applied the FOT to evaluate airway resistance in patients with CAO prior to interventional bronchoscopy and treatment-naïve patients with COPD. This retrospective study aimed to identify differences in obstructive ventilatory disturbances between these two diseases.
Patients and Methods
This study was approved by the Ethics Review Board of Shinshu University (Permission number: 3886, Date of approval: December 5, 2017) and written informed consent was obtained from all patients. The study protocols were performed in accordance with the principles outlined in the Declaration of Helsinki of the World Medical Association.
Patients with CAO
Our institute is the major medical facility in Nagano prefecture, Japan, for the treatment of patients with CAO with interventional bronchoscopy. Generally, the causes of tracheobronchial CAO include benign or malignant tumors and obstructions caused by secretions or bleeding, a foreign body, or airway collapse due to cartilaginous disorders, such as tracheobronchomalacia, etc. In this study, tracheobronchial CAO was defined as an airway obstruction in the tracheobronchial segment due to various conditions (ie, benign, malignant, iatrogenic, inflammatory, etc.). Tracheobronchial CAO was diagnosed with chest computed tomography (CT) and bronchoscopy. From December 2013 to May 2017, 30 patients with CAO were treated with interventional bronchoscopy in our institute. Among these, 16 patients (10 males, 6 females) with CAO completed a series of systematic examinations within 5 days prior to interventional bronchoscopy, including the FOT, spirometry, PFTs, and chest CT. Of these 16 patients, 11 had CAO caused by a malignant obstruction, and five had CAO caused by benign conditions. All types of obstruction were included, namely: extra-luminal, mixed, and intra-luminal. Ten patients showed airway obstruction in the tracheal segment, and six patients showed obstruction in the main bronchial segment (Supplemental Table 1). All patients complained of respiratory symptoms, including cough, dyspnea, and stridor. In this study, the central airway was defined as the segment from the trachea to the left main bronchus and to the bronchus intermedius in the right main bronchus.
Patients with COPD
Clinical data were retrospectively reviewed regarding the age, gender, body weight, body height, smoking history, and PFTs for patients treated in Shinshu University Hospital from December 2013 to May 2017. We identified 125 patients that were newly diagnosed with stable COPD. COPD was diagnosed with the following criteria: the forced expiratory volume in 1 second (FEV1) was <70% of the forced vital capacity (FVC) (ie, the FEV1/FVC) and the FEV1 was <80% of the predicted value after inhaling a short-acting β2-agonist (for moderate-to-very severe COPD), in accordance with the Global Initiative for Chronic Obstructive Lung Disease (GOLD) guidelines. Among these 125 patients, 75 completed a series of examinations, including a chest CT, PFTs, and the FOT, before the COPD was managed. All patients had a smoking history of more than 10 pack-years. No patients had a history of asthma.
Forced Oscillation Technique
Measurements were performed with a commercially available multi-frequency FOT device (MostGraph-01, Chest Co., Ltd., Tokyo, Japan), according to standard recommendations,9 as described previously.10 The FOT measurements were performed before the PFTs. Briefly, the patient sat in an upright position with a neutral head position. During the examination, the patient wore a nose clip and a support, which stabilized the cheek, tongue position, and chin, to minimize upper airway shunting. We connected an anti-bacterial/viral filter (Spirofilter 999S®) just behind the mouthpiece, with a filter resistance of 0.93 hPa/L/s at an airflow of 0–14 L/s, and dead space of 63 mL (CHEST M.I. Inc., Tokyo, Japan). Before the FOT measurement, the frequency responses to the transducer and pneumotachograph were automatically calibrated. Additionally, a quick visual check was performed to detect any leaks around the mouthpiece during a stable period of tidal breathing (with a functional level of residual capacity). The volume history of the subject was monitored for at least 30 s. The measurements were repeated at least 3 times. When artifacts (swallowing, irregular breathing, glottis closure, leaking around the mouthpiece, etc.) were found during the tests, the results were discarded. Results were acceptable when the coefficient of variation was less than 10% in at least two data sets. The essential information is shown in Supplemental Table 2. We recorded five measurements: the resistance at 5 Hz (R5), the resistance at 20 Hz (R20), the reactance at 5 Hz (X5), the resonant frequency (Fres), and the low-frequency reactance area (ALX). These oscillatory parameters were measured during the whole breath cycle, during the inspiratory phase, and during the expiratory phase. We also calculated the difference between the inspiratory and expiratory phases (Δ) for each oscillatory parameter.
Pulmonary Function Tests
The PFTs were performed by two technicians, according to American Thoracic Society criteria. As described previously,11 a PFT system (Chestac-8800; Chest Co., Ltd.) was applied for measuring spirometry, the capacity of the lung for diffusing carbon monoxide (DLco), the closing volume, and a global measurement of ventilation heterogeneity (the slope of Phase III in the single breath nitrogen washout test [ΔN2]). The percent of the predicted values for the forced expiratory volume in 1 second (%FEV1) and vital capacity (%VC) were derived, according to standard data published by the Japanese Respiratory Society.12 The percent of predicted values for DLco (%DLco), the DLco/alveolar volume (VA), and the percent of the predicted value for the total lung volumes (ie, the residual volume [%RV] and total lung capacity [%TLC]) were determined with the formulas described by Nishida et al13 and Boren et al.14 These measurements were performed in duplicate or triplicate to evaluate the repeatability.
Phenotypes of COPD
In this study, COPD was divided into two phenotypes, according to the presence or absence of airway wall thickening. Wall thickness was expressed in terms of a standardized measurement (AWT-Pi10), as previously reported.15 Briefly, the chest CT images were analyzed with image-analyzing software (ZioCube®; Ziosoft, Inc., Tokyo, Japan). The AWT-Pi10 is the standardized airway wall thickness at an internal perimeter of 10 mm. It is calculated with a linear regression analysis, in which the square root of the wall area of each measured segment is plotted against its internal perimeter. This standardized parameter obviates potential biasing issues due to the different distributions of airway sizes among subjects.15,16 The cross-sections (short to long axis >2:3) of all bronchial images up to the sixth generation bronchi (the segmental, subsegmental, and subsubsegmental) that could be detected on an inspiratory CT were identified in whole lung fields for each patient. Only the segments with an internal perimeter of 6–20 mm were selected to estimate the AWT-Pi10.15,16 We defined a threshold for the AWT-Pi10 that served as the cutoff for determining the thickened airway wall phenotype, as described in our previous study.15 The COPD phenotype with airway wall thickening was defined as an AWT-Pi10 >4.30. The COPD phenotype without airway wall thickening was defined as an AWT-Pi10 ≤4.30.
Statistical Analysis
Statistical analyses were performed with SPSS for Windows software (version 14.0, SPSS Inc., Chicago, IL, USA). Quantitative values are presented as the mean ± standard error of the mean (SEM). The distribution of the data for variables in the two groups was first assessed with Bartlett’s test. Data with a normal distribution were compared with a one-way analysis of variance, followed by the multiple comparisons correction, according to the Tukey–Kramer method. Data that did not show a normal distribution were compared with the Kruskal–Wallis test, followed by a multiple comparisons correction, according to the nonparametric Tukey–Kramer method. Correlations between variables were examined by calculating Pearson correlation coefficients for parametric data or Spearman correlation coefficients for nonparametric data. We performed a receiver operating characteristic (ROC) curve analysis and calculated the area under the curve (AUC) to determine the importance of each parameter in distinguishing between the two groups. P-values <0.05 were considered significant in all statistical analyses.
Results
Clinical Characteristics, Symptoms, and Health-Related Quality of Life
The characteristics of patients are shown in Table 1. Briefly, patients with COPD were significantly older, predominantly male, and had a heavier smoking history than patients with CAO. The causes, locations, and therapeutic choices for CAO are shown in Supplemental Table 1.
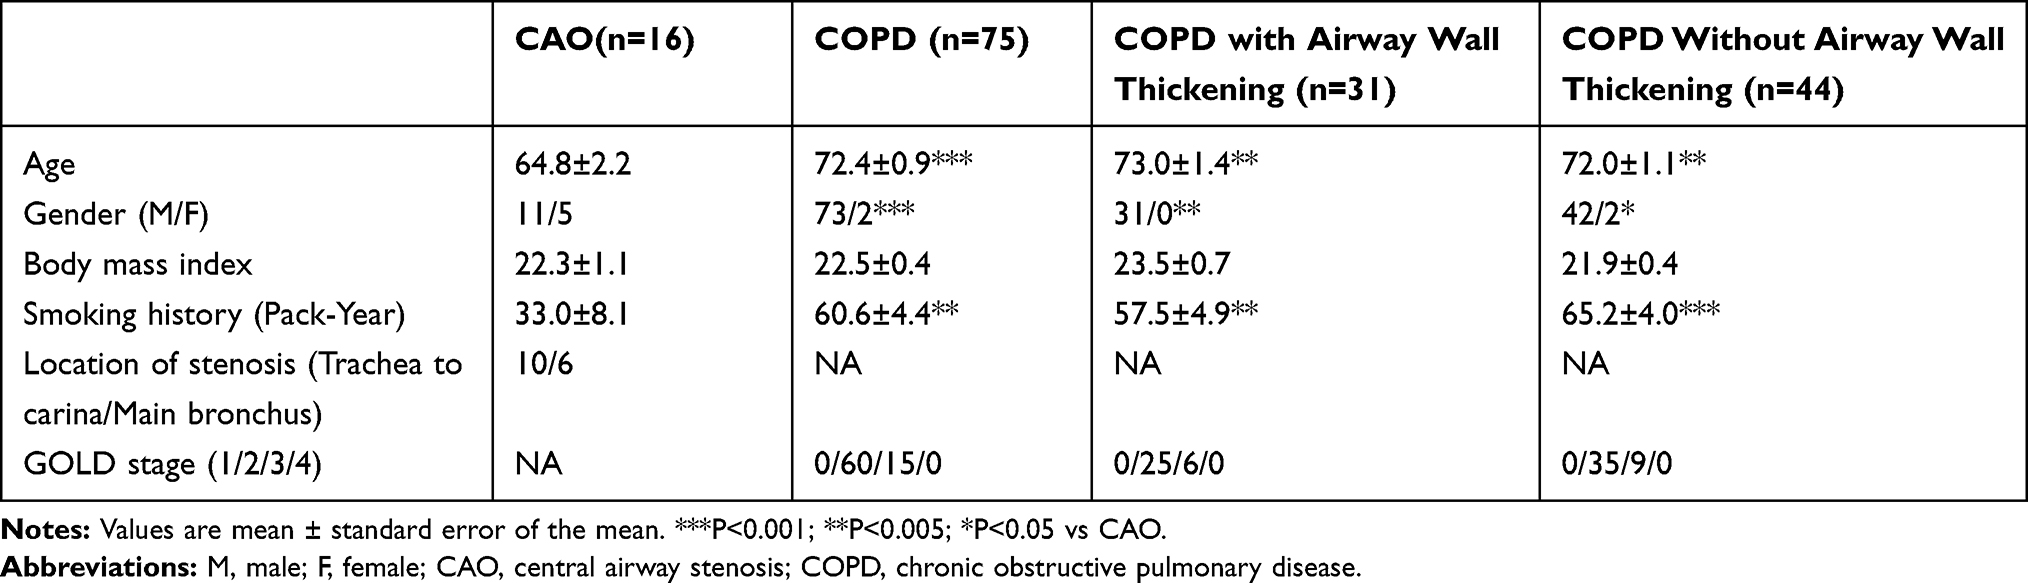 |
Table 1 Information of the Patients |
Pulmonary Function Tests
The PFT results for the CAO and COPD groups are shown in Table 2. Only the peak expiratory flow rate (PEFR) was significantly worse in the CAO group than in the COPD group. The forced expiratory flow rate at 25% of vital capacity (%V25) was significantly worse in the COPD group than the CAO group. Because some patients with CAO could not complete some PFT measurements, due to disease severity, the measurements of RV, TLC, DLco, and ΔN2 in the PFTs could only be obtained for 12 patients with CAO. The %RV, %DLco/VA, and %ΔN2 were significantly worse in patients with COPD (n=75) than in patients with CAO (n=12; Supplemental Table 3).
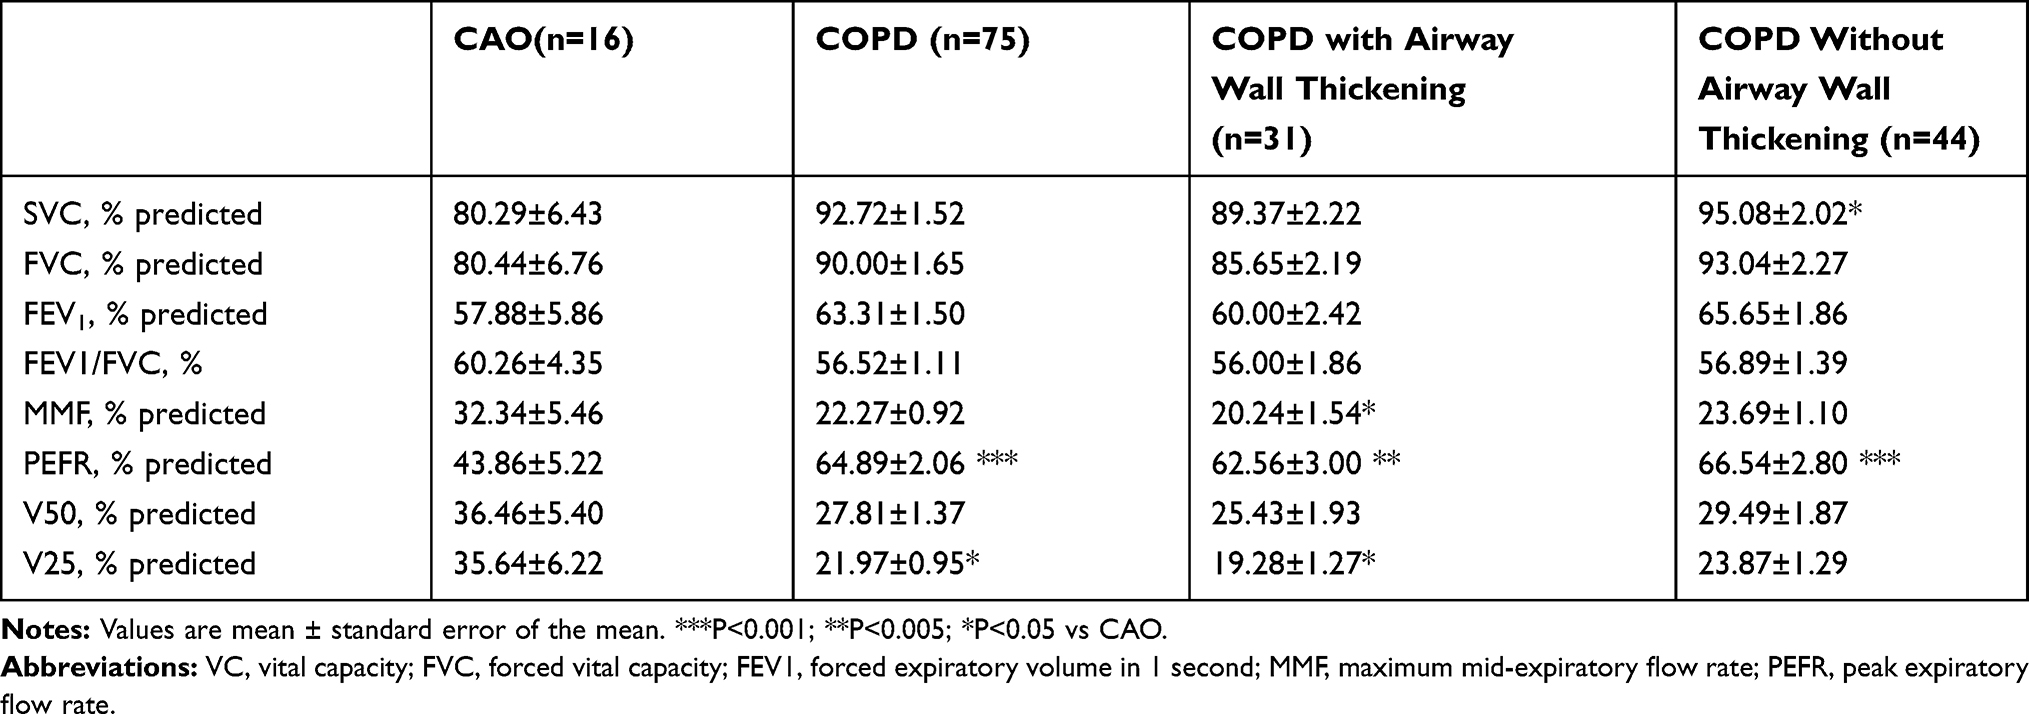 |
Table 2 Difference of the Pulmonary Function Tests |
Forced Oscillation Technique
As shown in Table 3, the FOT measurements (R5, R20, R5-R20, X5, Fres, and ALX), particularly in the inspiratory phase, were significantly higher in patients with CAO (n=16) than in patients with COPD (n=75).
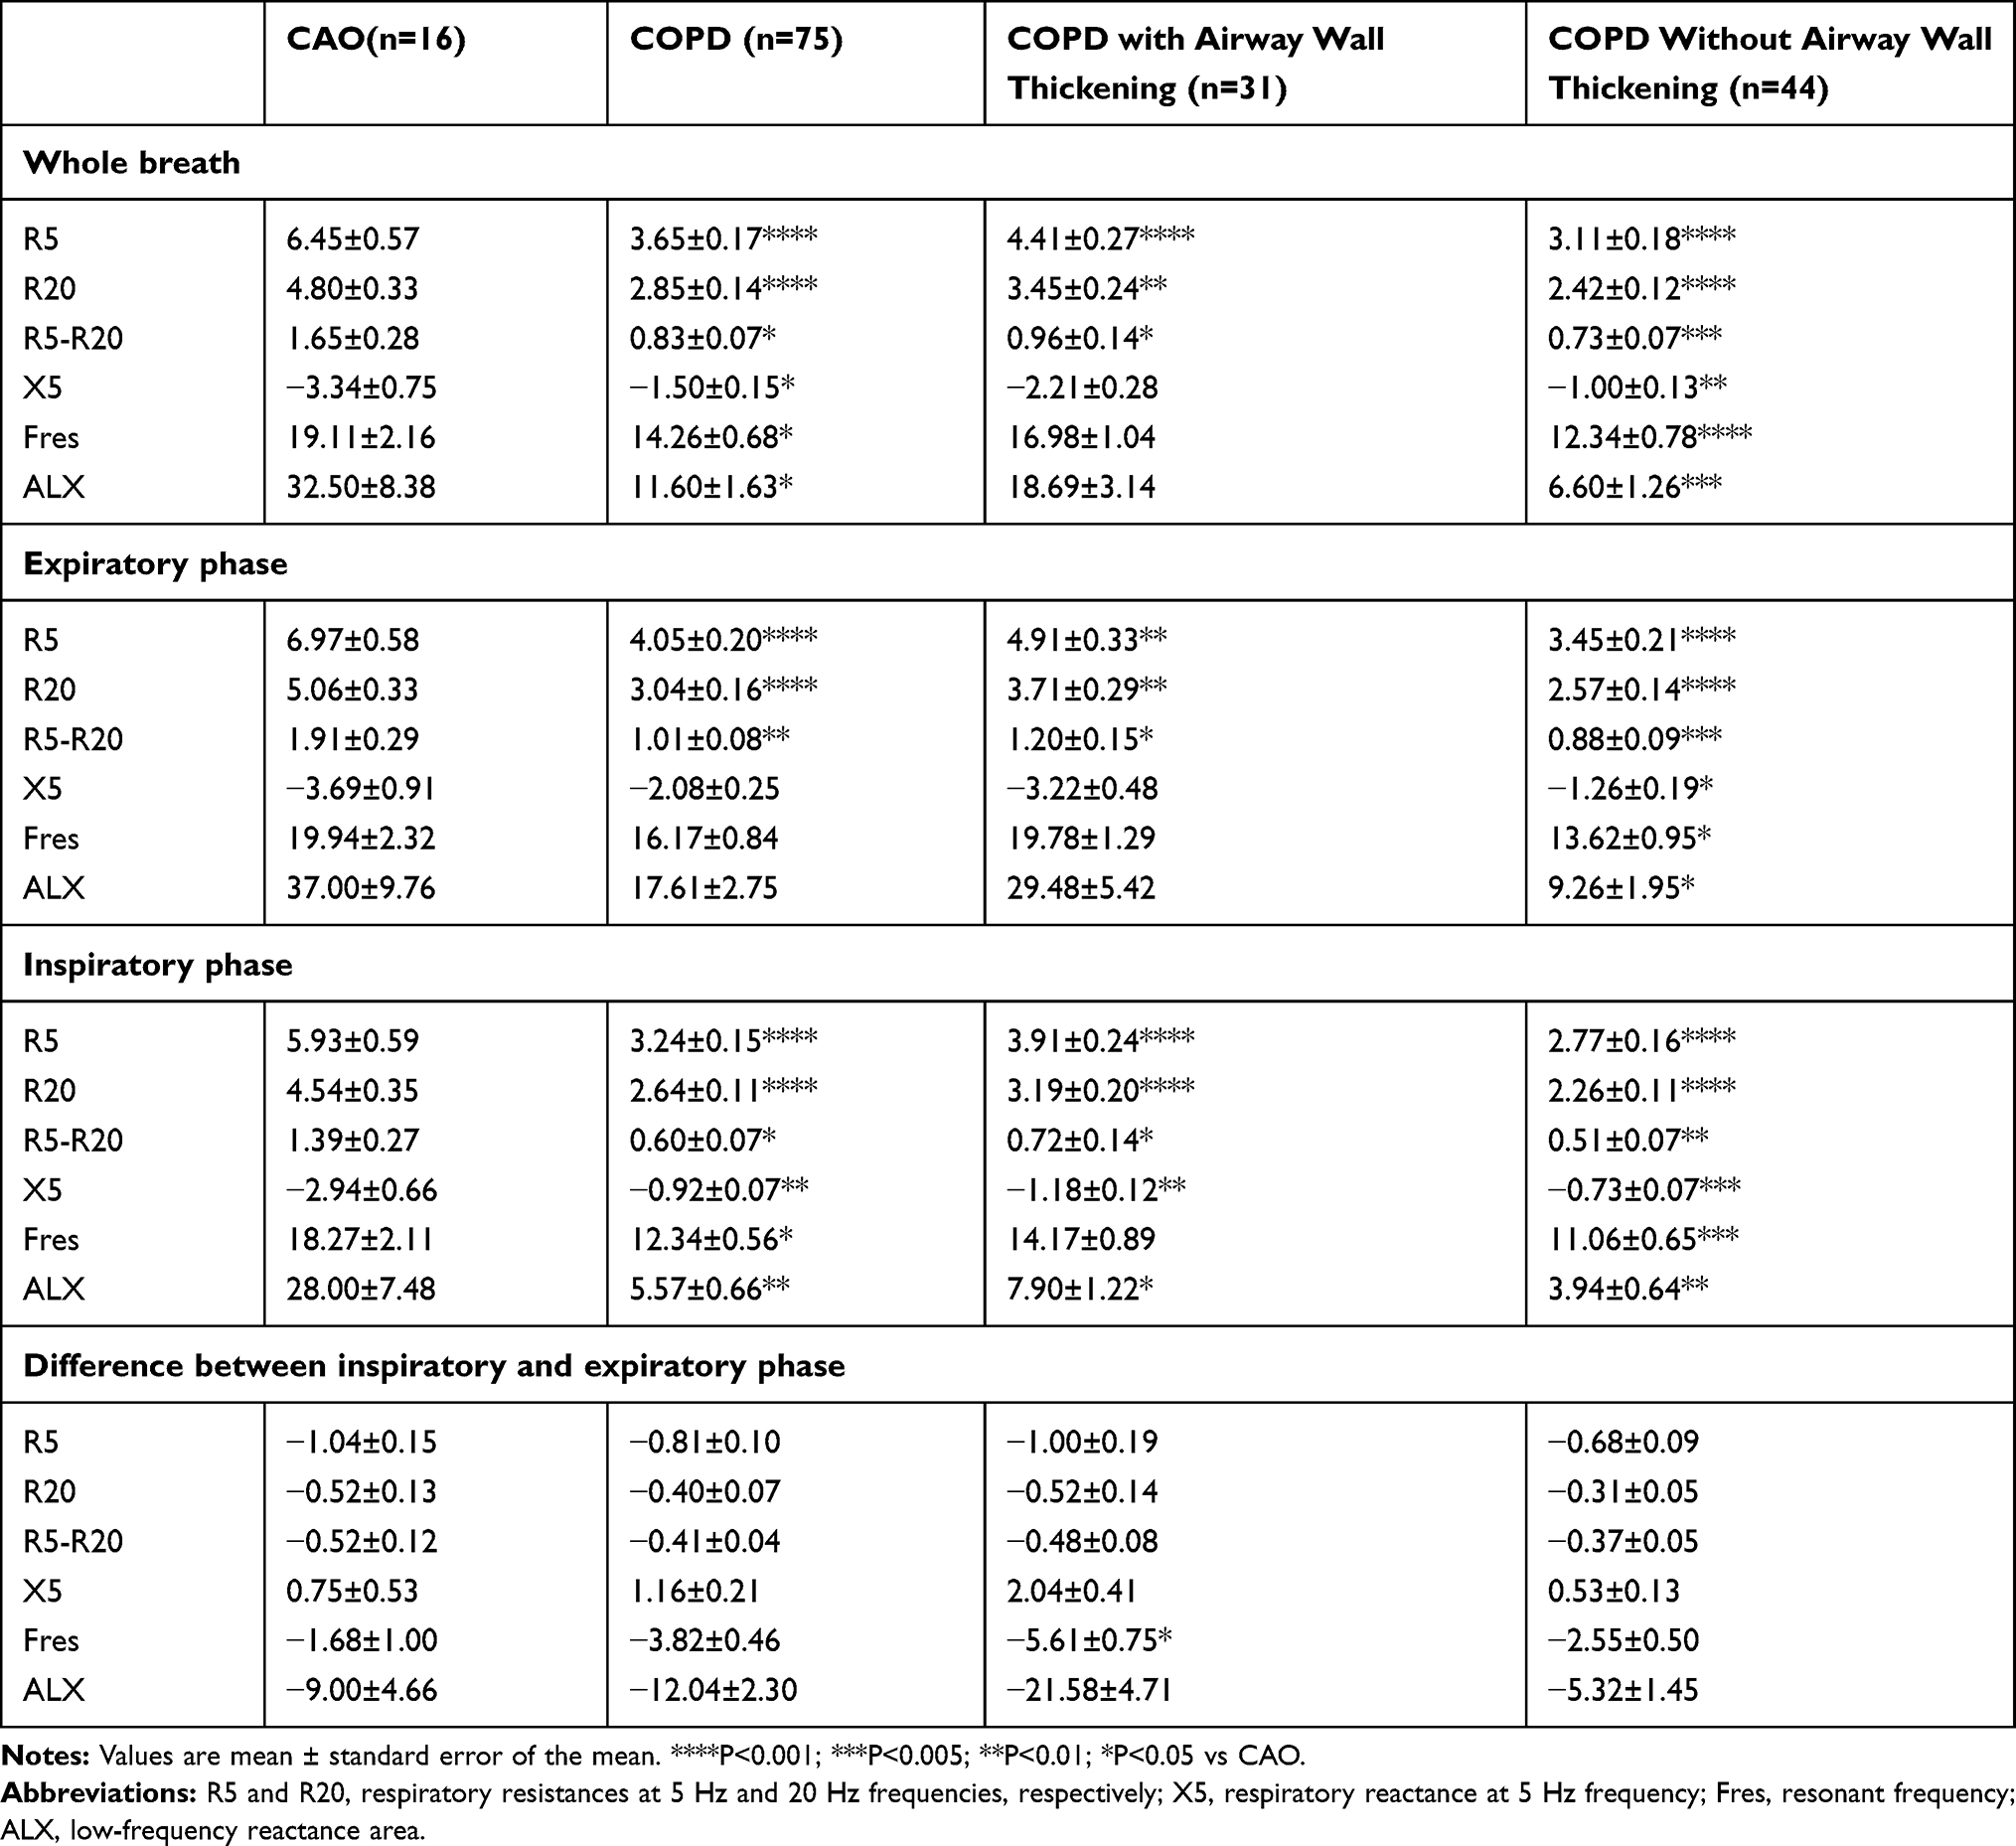 |
Table 3 Difference of the Forced Oscillation Technique |
CAO and COPD Phenotypes Based on PFTs and FOT
To focus on airway resistance, in the present study, we divided the COPD group into patients with and patients without airway wall thickening. These two phenotypes were defined previously. We found no significant differences in the PFT results between the CAO group and the COPD group with airway wall thickening (Table 2). However, in the FOT results, the difference between the inspiratory and expiratory phases of the Fres (ΔFres) was significantly greater in the COPD with airway wall thickening group than in the CAO group (Table 3). In addition, the differences between the inspiratory and expiratory phases of the X5 (ΔX5) and ALX (ΔALX) tended to be greater in the COPD with airway wall thickening group than in the CAO group (Table 3).
Relationship Between PFTs and FOT
The patients with CAO showed a significant reduction in the PEFR (%) and an increase in most FOT measurements, particularly the R5, R20, and R5-R20, compared to the COPD group. The regression analyses revealed that, in the CAO group, the PEFR (%) was significantly correlated with most of the FOT parameters (Table 4).
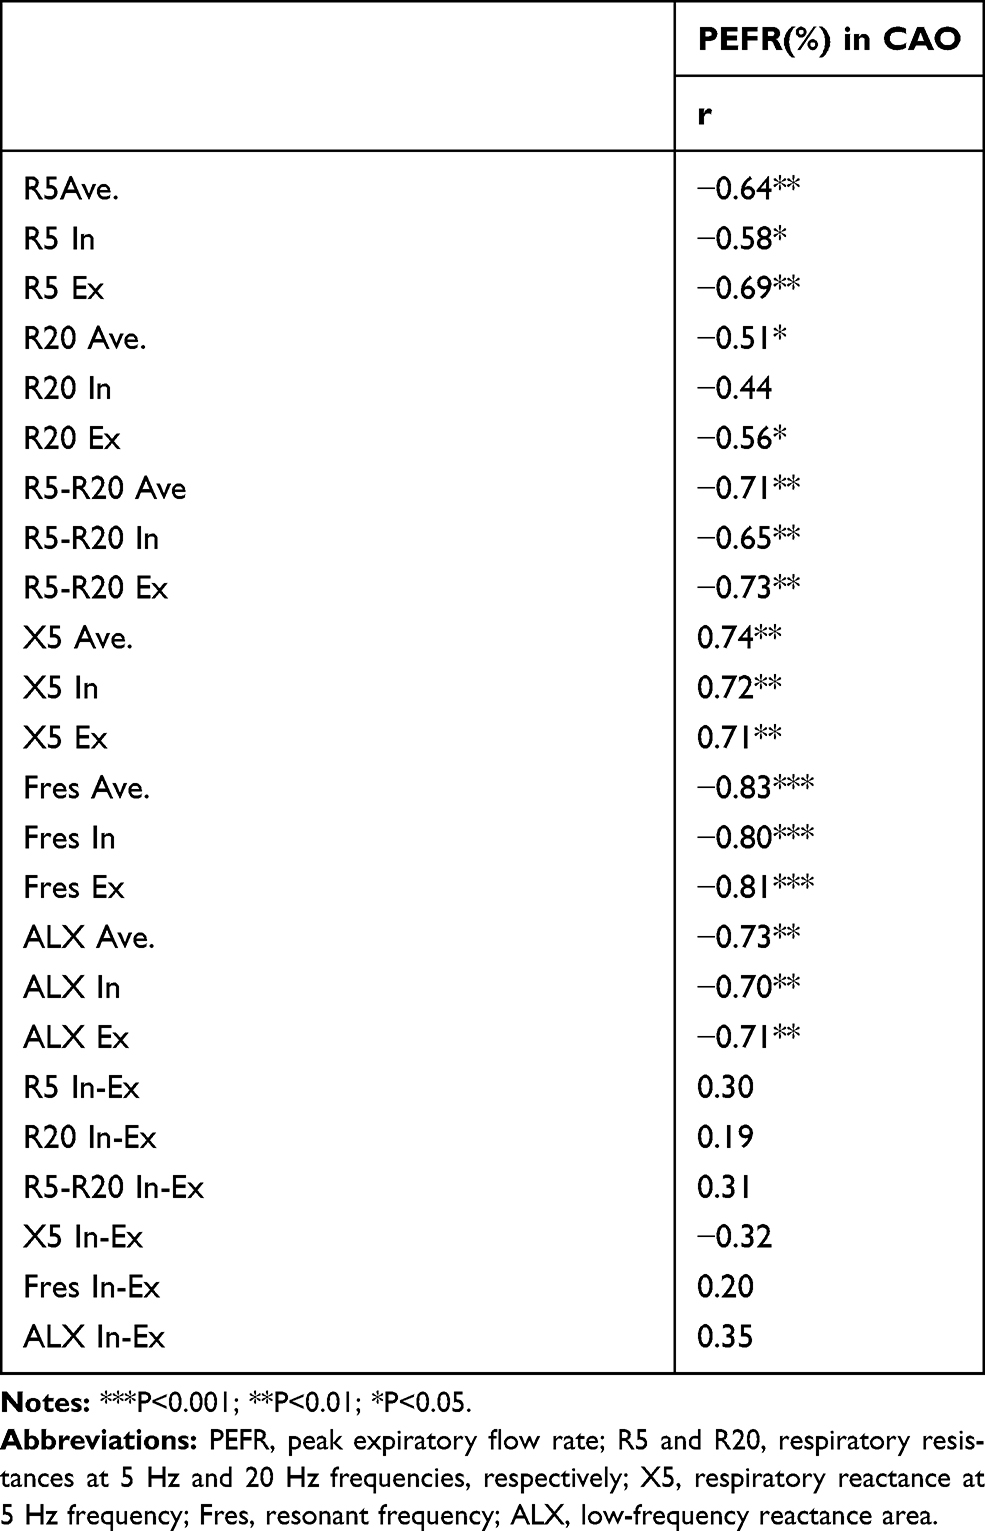 |
Table 4 Regression Analyses Between PEFR and FOT Parameters |
The patients with COPD showed a significant reduction in the %V25 compared to the CAO group in the PFTs. The regression analysis revealed that, in the COPD group, the %V25 in the PFTs was significantly correlated with most of the FOT parameters, despite the low correlation coefficient values (<0.40, data not shown). Patients in the COPD with airway wall thickening group (n=31) showed a significant increase in the %RV and reductions in the percent of the predicted value for maximal mid-expiratory flow (%MMF) and %V25 of the PFTs compared to patients in the CAO group (Supplemental Table 3). Additionally, a large amount of the difference in FOT results between the COPD and CAO groups could be attributed to the COPD with wall thickening phenotype (ie, the ΔFres, the ΔX5, and the ΔALX; Table 3). To determine the accuracy of FOT measurements in distinguishing the differences between CAO and COPD, we performed a binomial logistic regression analysis and calculated the area under the curve (AUC) for the parameters: ΔFres, ΔX5, and ΔALX. The results showed that the AUCs of ΔFres, ΔX5, and ΔALX were 0.78, 0.71, and 0.68, respectively. The analysis of relationships between the PFT parameters (%RV, %MMF, %V25) and the FOT parameters (ΔX5, ΔFres, and ΔALX) showed that the ΔX5 and ΔALX were significantly correlated with the %RV, and the ΔALX was significantly correlated with the %MMF, in the COPD with airway wall thickening group (Supplemental Table 4).
Discussion
The present study described and compared the features of PFTs and the FOT for the two airway obstructive diseases, CAO and COPD. The comparison between these two diseases showed the differences between central and peripheral airway obstructions in terms of PFTs and FOT parameters. Several previous studies have suggested that the FOT results in patients with CAO were similar to those reported in patients with COPD.6,7,17 Previous studies2,8 also showed and discussed the notion that CAO was associated with increases in the R5, a marked frequency dependence in the resistance, more negative reactance at 5 Hz, and increased Fres, compared to COPD. The features of FOT measurements in lung function tests for COPD have been studied for decades. In 1975, Michaelson et al demonstrated that patients with COPD exhibited frequency-dependent resistance and higher Fres values than healthy subjects.18 Later, Di Mango et al revealed alterations in FOT measurements for different degrees of airway obstruction in COPD.19 For example, the FOT could detect changes in respiratory mechanics with increasing degrees of airway obstruction in COPD.19,20 Moreover, the FOT was applied to evaluate the therapeutic effects of bronchodilator treatment21 and pulmonary rehabilitation22 in patients with COPD. To date, the FOT has been well documented regarding evaluations of disease severity and therapeutic effects in patients with COPD. On the other hand, the present study aimed to identify features of FOT measurements in both COPD and CAO that could distinguish the sites of obstruction along the airway.
The current findings on applying FOT to evaluate CAO status are less thorough than the collection of findings on applying the FOT to evaluate COPD. In 2000, Beraldo et al evaluated a case of CAO due to spinal cord injury. They compared FOT measurements taken before and after dilation treatment for postintubation tracheal stenosis.23 Then, in 2001, Horan and collogues reported the application of FOT for evaluating tracheostenosis in patients with neurologic injuries.5 Verbanck et al demonstrated that the FOT showed high resistance values in 10 patients with CAO.6 They also investigated 10 healthy individuals and 10 patients with COPD; however, they did not directly compare FOT measurements between the CAO, COPD, and healthy groups in that study.6 Recently, our previous study revealed that patients with CAO exhibited relatively high values of R5 and R20, Fres, and ALX, and a negative reactance at 5 Hz.8 In the present study, we first demonstrated the similarities and differences between CAO and COPD, in terms of FOT and PFT parameters. These groups were analyzed with the FOT and PFTs in parallel at one respiratory institute.
Typically, the PFT features for CAO showed that the obstructive respiratory disturbances, particularly in the top and bottom of the loop, were flattened. Thus, the flow-volume loop configuration approached the shape of a rectangle.24 Consequently, the shape of the flow-volume loop observed in CAO can be readily distinguished from that observed in COPD. On the other hand, previous studies showed that the FOT parameters were similar between CAO and COPD.6,7,17
Clinically, the typical flow-volume loop cannot always be observed in PFTs for patients with CAO, particularly when stenosis is in the main bronchus. Moreover, patients with serious airway symptoms in CAO were not able to complete the PFTs. However, in the present study, we could precisely determine significant differences in several PFT parameters between the CAO and COPD groups. The %PEFR in the PFTs was significantly worse in the CAO group than in the COPD group. Conversely, the percent of predicted values for the PFT parameters, V25, RV, DLco/VA, and ΔN2, were significantly worse in the COPD group than in the CAO group. However, the FOT results for the COPD group were not worse than those for the CAO group.
Despite the fact that, generally, the R5-R20 measured with the FOT indicates a small airway caliper, it remains uncertain whether the R5-R20 reflects a physiological condition.25 In addition, bronchodilation reduces hyperinflation, which could potentially result in an increase in resistance with a decrease in reactance. Thus, the resistance and reactance measurements do not provide a straightforward interpretation, and they might lead to a disparate spirometry response.25 Moreover, our results unexpectedly showed that the R5-R20 was not higher in COPD than in CAO, rather it was correlated with the PEFR in the CAO group. Nevertheless, our results revealed that the difference between FOT expiratory and inspiratory parameters was an optimal indicator of peripheral airway physiology in the COPD phenotype with airway thickening. We divided the COPD group into two major phenotypes: the chronic bronchitic phenotype (with airway wall thickening) and the emphysematic phenotype (without airway wall thickening). Our results showed that the magnitude of the FOT-determined ΔFres was significantly higher in the COPD with airway wall thickening group than in the CAO group. In addition, we observed a trend of higher ΔX5 and ΔALX values in the COPD with airway wall thickening group compared to the CAO group (Table 3). The binomial logistic regression analysis showed that the ΔFres had the best AUC value for distinguishing CAO from COPD with the airway wall thickening phenotype (AUC = 0.78). Patients with the airway wall thickening COPD phenotype showed significantly worse PFT results for the MMF, V25, and RV, compared to patients with CAO (Table 2 and Supplemental Table 3). These features associated with the COPD with airway wall thickening phenotype were also observed in our previous study, which compared FOT results between patients with bronchitic and patients with emphysema COPD phenotypes.15
The FOT parameters, R5, R20, and R5-R20, measured in all breath phases (average, inspiratory, and expiratory) were significantly higher in patients with CAO than in those with COPD. The regression analyses revealed that the R5 and R5-R20 measured in all breath phases were significantly negatively correlated with the PEFR of the PFTs in the CAO group (Table 4). The R20 measurements (except during the inspiratory phase) were also significantly negatively correlated with the PEFR of the PFTs (Table 4) in the CAO group. These results suggested that, in patients with CAO, an increase in the respiratory resistance measured with the FOT indicated a reduction in the PEFR measured with the PFTs.
In patients of COPD phenotype with airway wall thickening, the regression analysis showed significant relationships between the FOT-determined ΔX5 and the PFT-determined RV (R=0.53, P<0.01) and between the FOT-determined ΔALX and the PFT-determined RV (R=−0.59, P<0.001; Supplemental Table 4). We also detected a significant correlation between the FOT-determined ΔALX and the PFT-determined MMF (R=0.38, P<0.05; Supplemental Table 4). No significant relationship was detected between the FOT-determined ΔFres, ΔX5, or ΔALX and the PFT-determined V25 (Supplemental Table 4). These results indicated that, among patients with the COPD phenotype of airway wall thickening, a higher FOT-determined ΔALX reflected a higher PFT-determined RV and a lower PFT-determined MMF. In addition, a higher FOT-determined ΔX5 reflected a higher PFT-determined RV.
In patients with CAO, our previous study revealed that an alteration in the R20 was a useful parameter in estimating airway dilation in CAO after interventional bronchoscopy.8 Thus, the R20 appeared to be the optimal parameter for evaluating mechanical changes in CAO. On the other hand, in patients with COPD, our group previously found that the R20 was weakly correlated with airway reversibility.15 From the viewpoint of a technical standard,25 despite the high R20 value in COPD, it was not recommended for estimating the bronchodilation effect, compared to an alteration in the FEV1 response.15,25 Moreover, we previously demonstrated that the R5, R20, ΔX5, ΔALX, and ΔFres were significantly higher in the COPD phenotype with airway wall thickening than in other COPD phenotypes, including emphysema-dominant COPD and COPD with normal chest CT findings.15 In addition, the X5 was significantly lower in the COPD phenotype with airway wall thickening than in the other COPD phenotypes.15 The present results showed that the ΔFres had the highest AUC among the FOT measurements, consistent with results in a previous study.15,25 This finding suggested that the ΔFres was most likely the optimal indicator of mechanical changes in the COPD phenotype with airway wall thickening, rather than the FOT parameters important in identifying mechanical changes in CAO.
This study had several limitations. First, the size of the CAO group was small. CAO is a relatively rare disease in the clinical sitting, and it is difficult to find data on CAO among the available data on FOT measurements and PFTs. Moreover, before disease management (for example, airway dilation) with interventional bronchoscopy, only a proportion of patients in the CAO group could complete all the examinations included in both the FOT and PFT, due to the effort-dependency of these tests. Our current sample of 16 patients with CAO was the largest reported to date, and it represented patients admitted over a 4-year period. Past data on CAO were insufficient to support a power analysis for calculating an appropriate sample size for the present study. However, we performed strict and frequent calibrations of the equipment to ensure precise measurements and reliable data. Future studies should include a larger sample size to confirm the results and conclusions found in the present study. Second, some patients with CAO had relatively heavy smoking histories, which suggested that some patients with CAO might have co-existing COPD. This might have affected the interpretation of PFT results. Lastly, our study design included clinical data for patients with treatment-naïve COPD. The majority of patients with COPD were in GOLD stage II, consistent with the mostly moderate COPD treated in clinical settings. Thus, the present results might not be representative of other stages of COPD, for example, GOLD stage IV, which showed considerably worse FOT findings.21
Despite these limitations, the FOT findings showed similar, but different features for CAO and COPD, including the airway wall thickening COPD phenotype. Based on our findings, we highly recommend performing the FOT to evaluate lung function in patients with CAO prior to an interventional bronchoscopy, because the FOT examination is easier to complete than the PFTs for patients with CAO.
Conclusions
This study showed that significantly high or low FOT parameters could differentiate between the characteristics of ventilatory disturbances associated with CAO from those associated with moderate COPD in GOLD stage II. From the point of view of the airway obstruction site, we found that the ΔFres was the best indicator for distinguishing between the airway wall thickening phenotype of COPD and CAO.
Abbreviations
ALX, the low-frequency reactance area; AUC, area under the curve; CAO, central airway obstruction; COPD, chronic obstructive pulmonary disease; CT, computed tomography; ΔN2, the single breath nitrogen washout test; DLco, capacity of the lung for diffusing carbon monoxide; FEV1, forced expiratory volume in 1 second; FOT, forced oscillation technique; Fres, resonance frequency; FVC, forced vital capacity; GOLD, Global Initiative for Chronic Obstructive Lung Disease; PEFR, peak expiratory flow rate; PFTs, pulmonary function tests; R5, resistance at 5 Hz; R20, resistance measured at 20 Hz; ROC, receiver operating characteristic; RV, residual volume; TLC, total lung capacity; X5, the reactance at 5 Hz.
Acknowledgments
The authors would like to thank Dr. Yunden Droma for her valuable advice and for kindly checking the English usage in our manuscript. The authors also thank Prof. Masayoshi Koinuma for his valuable advice in the statistical analysis.
Disclosure
The authors have no conflicts of interest to disclose.
References
1. Global Initiative for Chronic Obstructive Lung Disease [homepage on the Internet]. Global strategy for the diagnosis, management, and prevention of chronic obstructive pulmonary disease. NHLBI/WHO workshop report. bethesda: national heart, lung and blood institute; 2001 [
2. Dubois AB, Brody AW, Lewis DH, Burgess BF
3. Shirai T, Kurosawa H. Clinical application of the forced oscillation technique. Intern Med. 2016;55(6):559–566. doi:10.2169/internalmedicine.55.5876
4. Smith HJ, Reinhold P, Goldman MD. Forced oscillation technique and impulse oscillometry. Eur Respir Mon. 2005;31:72–105.
5. Horan T, Mateus S, Beraldo P, et al. Forced oscillation technique to evaluate tracheostenosis in patients with neurologic injury. Chest. 2001;120(1):69–73. doi:10.1378/chest.120.1.69
6. Verbanck S, de Keukeleire T, Schuermans D, Meysman M, Vincken W, Thompson B. Detecting upper airway obstruction in patients with tracheal stenosis. J Appl Physiol. 2010;109(1):47–52. doi:10.1152/japplphysiol.01103.2009
7. Handa H, Huang J, Murgu SD, et al. Assessment of central airway obstruction using impulse oscillometry before and after interventional bronchoscopy. Respir Care. 2014;59(2):231–240. doi:10.4187/respcare.02094
8. Yasuo M, Kitaguchi Y, Kinota F, et al. Usefulness of the forced oscillation technique in assessing the therapeutic result of tracheobronchial central airway obstruction. Respir Investig. 2018;56(3):222–229. doi:10.1016/j.resinv.2018.01.005
9. Oostveen E, MacLeod D, Lorino H, et al. ERS task force on respiratory impedance measurements. The forced oscillation technique in clinical practice: methodology, recommendations and future developments. Eur Respir J. 2003;22(6):1026–1041. doi:10.1183/09031936.03.00089403
10. Shirai T, Mori K, Mikamo M, et al. Usefulness of colored 3D imaging of respiratory impedance in asthma. Allergy Asthma Immunol Res. 2013;5(5):322–328. doi:10.4168/aair.2013.5.5.322
11. Kitaguchi Y, Yasuo M, Hanaoka M. Comparison of pulmonary function in patients with COPD, asthma-COPD overlap syndrome, and asthma with airflow limitation. Int J Chron Obstruct Pulmon Dis. 2016;11:991–997. doi:10.2147/COPD.S105988
12. Japanese Society of Chest Disease. Standards of pulmonary function tests for Japanese. Jpn J Respir Dis. 1993;31:421–427.
13. Nishida O, Kambe M, Sewake N, Takano M, Kawane H. Pulmonary function in healthy subjects and its prediction: 5. Pulmonary diffusing capacity in adults. Jpn J Clin Pathol. 1976;24:941–947.
14. Boren HG, Kory RC, Syner JC, Callahan R. The veterans administration-army cooperative study of pulmonary function. 2. The lung volume and its subdivisions in normal men. Am J Med. 1966;41(1):96–101. doi:10.1016/0002-9343(66)90008-8
15. Wada Y, Kitaguchi Y, Yasuo M, et al. Diversity of respiratory impedance based on quantitative computed tomography in patients with COPD. Int J Chron Obstruct Pulmon Dis. 2018;13:1841–1849. doi:10.2147/COPD.S163129
16. Nakano Y, Wong JC, de Jong PA, et al. The prediction of small airway dimensions using computed tomography. Am J Respir Crit Care Med. 2005;171(2):142–146. doi:10.1164/rccm.200407-874OC
17. Handa H, Miyazawa T, Murgu SD, et al. Novel multimodality imaging and physiologic assessments clarify choke-point physiology and airway wall structure in expiratory central airway collapse. Respir Care. 2012;57(4):634–641. doi:10.4187/respcare.01363
18. Michaelson ED, Grassman ED, Peters WR. Pulmonary mechanics by spectral analysis of forced random noise. J Clin Invest. 1975;56(5):1210–1230. doi:10.1172/JCI108198
19. Di Mango AM, Lopes AJ, Jansen JM, Melo PL. Changes in respiratory mechanics with increasing degrees of airway obstruction in COPD: detection by forced oscillation technique. Respir Med. 2006;100(3):399–410. doi:10.1016/j.rmed.2005.07.005
20. Ionescu C, Derom E, De Keyser R. Assessment of respiratory mechanical properties with constant-phase models in healthy and COPD lungs. Comput Methods Programs Biomed. 2010;97(1):78–85. doi:10.1016/j.cmpb.2009.06.006
21. da Costa GM, Faria AC, Di Mango AM, Lopes AJ, Lopes de Melo P. Respiratory impedance and response to salbutamol in healthy individuals and patients with COPD. Respiration. 2014;88(2):101–111. doi:10.1159/000362691
22. Zimmermann SC, Thamrin C, Chan AS, Bertolin A, Chapman DG, King GG. Relationships between forced oscillatory impedance and 6-minute walk distance after pulmonary rehabilitation in COPD. Int J Chron Obstruct Pulmon Dis. 2020;15:157–166. doi:10.2147/COPD.S225543
23. Beraldo PS, Mateus SR, Araújo LM, Horan TA. Forced oscillation technique to detect and monitor tracheal stenosis in a tetraplegic patient. Spinal Cord. 2000;38(7):445–447. doi:10.1038/sj.sc.3101005
24. MSD. Kenilworth, NJ, USA: Manual professional version. Merck & Co., Inc.. Available from: https://www.msdmanuals.com/professional/pulmonary-disorders/tests-of-pulmonary-function-pft/airflow,-lung-volumes,-and-flow-volume-loop.
25. King GG, Bates J, Berger KI, et al. Technical standards for respiratory oscillometry. Eur Respir J. 2020;55(2):1900753. doi:10.1183/13993003.00753-2019
 © 2020 The Author(s). This work is published and licensed by Dove Medical Press Limited. The
full terms of this license are available at https://www.dovepress.com/terms
and incorporate the Creative Commons Attribution
- Non Commercial (unported, 3.0) License.
By accessing the work you hereby accept the Terms. Non-commercial uses of the work are permitted
without any further permission from Dove Medical Press Limited, provided the work is properly
attributed. For permission for commercial use of this work, please see paragraphs 4.2 and 5 of our Terms.
© 2020 The Author(s). This work is published and licensed by Dove Medical Press Limited. The
full terms of this license are available at https://www.dovepress.com/terms
and incorporate the Creative Commons Attribution
- Non Commercial (unported, 3.0) License.
By accessing the work you hereby accept the Terms. Non-commercial uses of the work are permitted
without any further permission from Dove Medical Press Limited, provided the work is properly
attributed. For permission for commercial use of this work, please see paragraphs 4.2 and 5 of our Terms.