Back to Journals » International Journal of Chronic Obstructive Pulmonary Disease » Volume 13
Difference in systemic inflammation and predictors of acute exacerbation between smoking-associated COPD and tuberculosis-associated COPD
Authors Oh JY ![]() , Lee YS
, Lee YS ![]() , Min KH
, Min KH ![]() , Hur GY
, Hur GY ![]() , Lee SY
, Lee SY ![]() , Kang KH
, Kang KH ![]() , Rhee CK, Park SJ
, Rhee CK, Park SJ ![]() , Shim JJ
, Shim JJ ![]()
Received 15 June 2018
Accepted for publication 3 September 2018
Published 18 October 2018 Volume 2018:13 Pages 3381—3387
DOI https://doi.org/10.2147/COPD.S177371
Checked for plagiarism Yes
Review by Single anonymous peer review
Peer reviewer comments 3
Editor who approved publication: Prof. Dr. Richard Russell
Jee Youn Oh,1 Young Seok Lee,1 Kyung Hoon Min,1 Gyu Young Hur,1 Sung Yong Lee,1 Kyung Ho Kang,1 Chin Kook Rhee,2 Seoung Ju Park,3 Jae Jeong Shim1
1Division of Pulmonary, Allergy and Critical Care Medicine, Department of Internal Medicine, Korea University Guro Hospital, Seoul, Republic of Korea; 2Division of Pulmonary Medicine, Department of Internal Medicine, Catholic University Seoul Hospital, Seoul, Republic of Korea; 3Division of Pulmonary Medicine, Department of Internal Medicine, Chonbuk National University Hospital, Jeonju, Republic of Korea
Purpose: Tuberculosis-associated COPD (T-COPD) has clinical characteristics similar to those of smoking-associated COPD (S-COPD), such as dyspnea, sputum production, and acute exacerbation (AE). However, the degree of systemic inflammation and prognosis might be different because of difference in the pathophysiology. The aim of this study was to compare the lung function, systemic inflammatory markers, and their impacts on AE in patients with S-COPD and T-COPD.
Patients and methods: We performed a multicenter cross-sectional cohort study. We evaluated clinical characteristics, pulmonary function tests, levels of inflammatory markers, including C-reactive protein (CRP), erythrocyte sedimentation rate (ESR), and IL-6, and the association of these markers with AE in patients with S-COPD and T-COPD.
Results: Patients with T-COPD included more women and had lesser smoking history and higher St George Respiratory Questionnaire score than did patients with S-COPD. Although the FEV1 of both groups was similar, FVC, vital capacity, total lung capacity, and functional residual capacity were lower in patients with T-COPD than in those with S-COPD. CRP, ESR, and IL-6 levels were significantly higher in patients with T-COPD compared to patients with S-COPD. According to a multivariate logistic regression analysis, FEV1 was a significant factor predicting AE in S-COPD, and IL-6 was a significant factor predicting AE in T-COPD. IL-6 level greater than 2.04 pg/mL was a cutoff for predicting exacerbation of T-COPD (sensitivity 84.8%, specificity 59.3%, P<0.001).
Conclusion: Patients with T-COPD have higher levels of inflammatory markers, and IL-6 has a predictive value for AE in T-COPD.
Keywords: COPD, tobacco smoke, tuberculosis, biomarker, inflammation, exacerbation
Introduction
COPD is a progressive disease with persistent airflow obstruction and chronic systemic inflammation caused by noxious particles and gases.1 The accumulation of inflammatory cells in the airway caused by chronic irritants present in tobacco smoke may induce respiratory histopathologic changes. These include elastolytic destruction of the alveolar wall, loss of elastic recoil, hypertrophy of bronchiolar wall muscles, fibrosis of small airways, and hyperplasia of the goblet cells, which may lead to irreversible obstruction.2 Moreover, activated inflammatory cells and proinflammatory cytokines lead to systemic inflammation, which is associated with extra-respiratory manifestations of COPD, such as atherosclerosis, osteoporosis, and cardiovascular diseases.3 Levels of systemic inflammatory markers such as C-reactive protein (CRP) and IL-6 are increased in patients with COPD.4–6
Tobacco smoking is a well-known causative agent implicated in the pathogenesis of COPD; however, it is not the sole risk factor. Positive history of pulmonary tuberculosis has recently emerged as a risk factor in the development of COPD.7 Tuberculosis-associated COPD (T-COPD)8 is a condition in which pulmonary tuberculosis has caused destructive changes in the pulmonary parenchyma over the years, leading to chronic respiratory obstruction.9 The probable pathophysiologic mechanisms include parenchymal destruction by bronchiectasis, emphysema, bronchiolitis, and persistent inflammation caused by sequelae of tuberculosis. Although the causative agents may be different, T-COPD shares pathogenic manifestations such as chronic respiratory obstruction due to emphysema and bronchiolitis with smoking-associated COPD (S-COPD). Moreover, patients with T-COPD have clinical characteristics similar to those of patients with S-COPD, such as dyspnea, sputum, and acute exacerbation (AE).10,11 T-COPD may be associated with systemic inflammation and could be described as a distinct phenotype among the other forms of COPD. However, there is limited knowledge about systemic inflammatory markers and risk factors for AE in T-COPD, which are key factors in understanding the pathogenesis and treatment planning of COPD. Therefore, this study aimed to compare the systemic inflammatory markers and their impacts on AE in patients with S-COPD and T-COPD.
Materials and methods
Study design
The present cross-sectional cohort study was undertaken to develop clinically useful biologic markers for diagnosis and assessment of response to treatment in patients with chronic airway disease. This multicenter study was conducted at three hospitals: Korea University Guro Hospital, Seoul St Mary’s Hospital, and Chonbuk National University Hospital. Patients who consented to participate in the study were consecutively enrolled from June 2015 to May 2016 using the airway disease registry. The study protocol was approved by the institutional review boards (Korea University Guro Hospital: KUGH 13246; Seoul St Mary’s Hospital: KC15OIMI0553; and Chonbuk National University Hospital: 2015-01-018-005). The present study fulfilled the tenets of the Declaration of Helsinki and the patients provided written informed consent. A diagnosis of T-COPD was made on the basis of the following enrollment criteria: 1) patients with a history of tuberculosis and no change in chest imaging over the past 1 year; 2) patients with at least one finding of destructed pulmonary parenchyma on the chest image (lung volume loss, bronchovascular distortion, fibrosis, or secondary bronchiectasis) and the sum of volume of all lesions equivalent to over one-third of one lung confirmed by a radiologist or pulmonology specialist; 3) patients with airflow limitation (post-bronchodilator spirometry with FEV1/FVC <70%) and without any history of asthma or COPD before the diagnosis of tuberculosis; and 4) patients without respiratory infection within the previous 6 weeks.12
A diagnosis of S-COPD was made according to the American Thoracic Society and Global Initiative for Chronic Obstructive Lung Disease guidelines. Patients with smoking history of over 10 packs per year were enrolled, and patients with bronchiectasis, sequela from prior tuberculosis infection, interstitial lung disease, and other diseases that could lead to airflow obstruction were excluded.
At baseline, the following variables were collected: smoking history and amount, past medical history, body mass index (BMI), symptom scores (modified Medical Research Council dyspnea score, St George Respiratory Questionnaire [SGRQ] score, COPD assessment test [CAT] score), pulmonary function tests (spirometry, lung volume, and diffusing capacity of the lung for carbon monoxide), and chest imaging.
Blood tests, including tests for CRP and erythrocyte sedimentation rate (ESR), were done routinely on the day of enrollment in the overnight-fasted and medication-free state. Peripheral whole-venous blood was collected into ethylenediaminetetraacetic acid tubes, and serum was prepared by centrifugation for 10–15 minutes at 4,500 rpm and stored at −80°C until it was analyzed. IL-6 level was measured using ELISA kits (IL-6: R&D Systems, Oxford, UK).
FEV1 decline rate and AE history at 1 year from enrolment were determined. FEV1 decline rate was calculated at stable status by change of FEV1 after 1 year of enrollment from baseline. Exacerbation was defined as a sustained deterioration of acute respiratory symptoms, beyond stable state and day-to-day variations, which necessitated a change in regular medication and an unscheduled visit to the hospital.
Statistical analysis
Clinical data were presented as the median and IQR and was compared using Mann–Whitney U-test for continuous variables. For categorical variables, data were presented as percentage and number and were compared using Pearson’s chi-squared test or Fisher’s exact test. Correlations between variables were analyzed using Spearman’s correlation analysis. For the risk factors of AE, a multivariate logistic regression analysis was carried out by adjusting factors that were significant (P<0.1) in the univariate model. Significance was defined as P<0.05. All statistical analyses were performed using SPSS Statistics for Windows, Ver 20.0 (IBM Corp., Armonk, NY, USA).
Results
Characteristics of patients with S-COPD and T-COPD
A total of 170 patients were enrolled (T-COPD, n=92; S-COPD, n=78). Their baseline characteristics are described in Table 1. Patients with S-COPD included more men than women. Patients with S-COPD had a greater smoking history than did patients with T-COPD (P<0.002). Comorbidities were similar in both groups. No significant difference was observed between the previous treatment modalities of S-COPD and T-COPD.
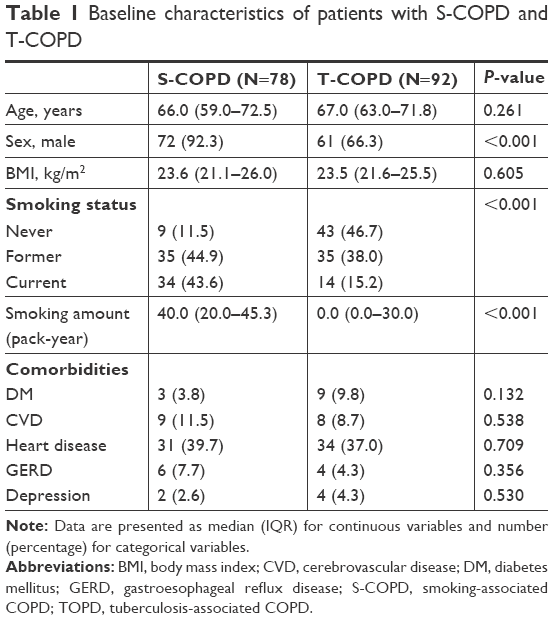 | Table 1 Baseline characteristics of patients with S-COPD and T-COPD |
Pulmonary function tests and outcomes of patients with S-COPD and T-COPD
Although FEV1 was similar, FVC, total lung capacity (TLC), functional residual capacity, and vital capacity were significantly lower in the T-COPD group than in the S-COPD group (Table 2). Patient-reported scores of symptom and quality of life were similar in both groups, except for SGRQ, which was higher in the T-COPD group. The FEV1 decline rates and percentage of AE did not show significant differences.
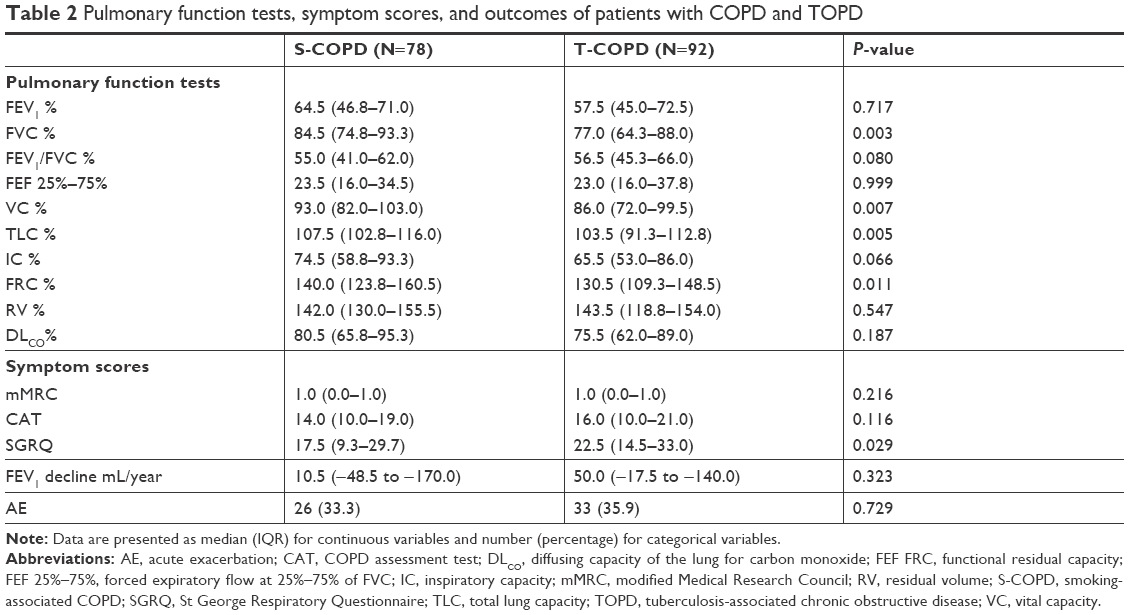 | Table 2 Pulmonary function tests, symptom scores, and outcomes of patients with COPD and TOPD |
Comparison of systemic inflammatory markers in S-COPD and T-COPD
CRP, ESR, and IL-6 levels were significantly higher in patients with T-COPD than in those with S-COPD (CRP: 1.25 [0.62–2.50] mg/dL in S-COPD, 2.92 [0.99–5.52] mg/dL in T-COPD, P<0.001; ESR: 10.50 [6.00–17.00] mm/h in S-COPD, 16.0 [8.25–22.0] mm/h in T-COPD, P=0.002; IL-6: 1.45 [0.43–2.35] pg/mL in S-COPD, 2.17 [1.11–5.86] pg/mL in T-COPD, P<0.001; Figure 1).
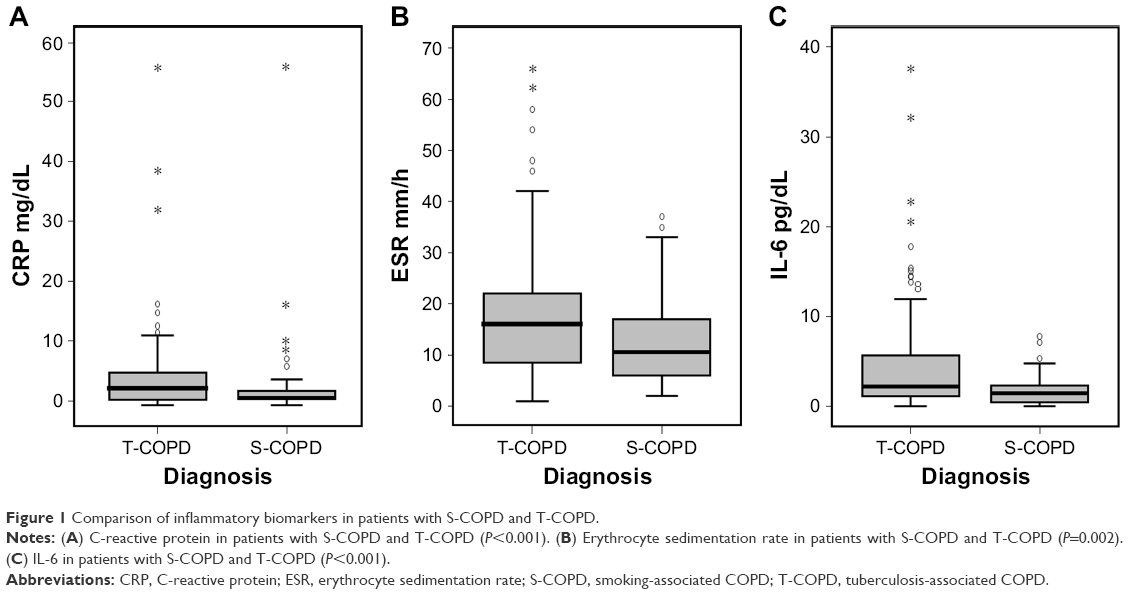 | Figure 1 Comparison of inflammatory biomarkers in patients with S-COPD and T-COPD. |
Multivariate logistic analysis for risk factors of AE in S-COPD and T-COPD
Multivariate logistic analysis was done to compare the factors affecting AE in patients with S-COPD (Table 3) and T-COPD (Table 4). In S-COPD, FEV1, SGRQ, and IL-6 were the factors associated with AE in univariate analysis. After adjusting factors significant in univariate models, only FEV1 was significantly associated with AE (adjusted odds ratio [aOR] 0.941 [0.901–0.983], P=0.006). In T-COPD, FEV1, CAT, SGRQ, CRP, and IL-6 were the factors associated with AE in univariate analysis (P<0.1). After adjusting factors significant in univariate models, only IL-6 was significantly associated with AE (aOR 1.109 [1.004–1.225], P=0.023).
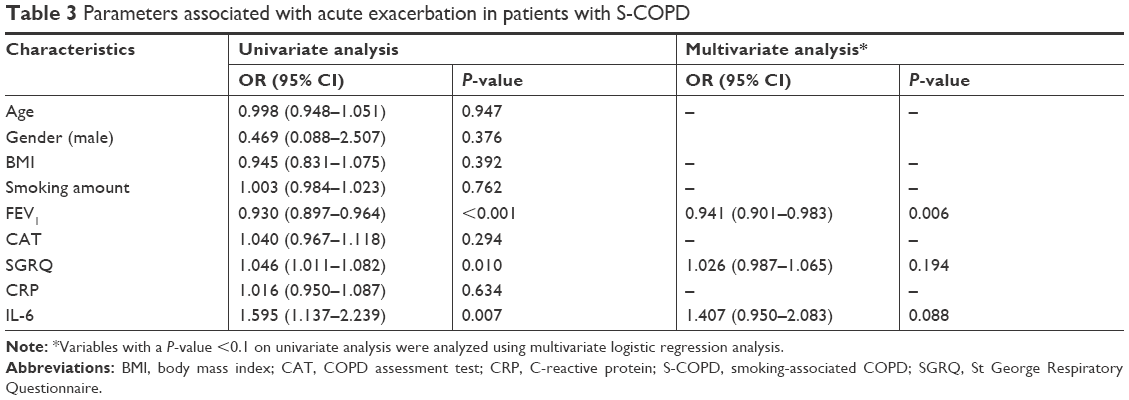 | Table 3 Parameters associated with acute exacerbation in patients with S-COPD |
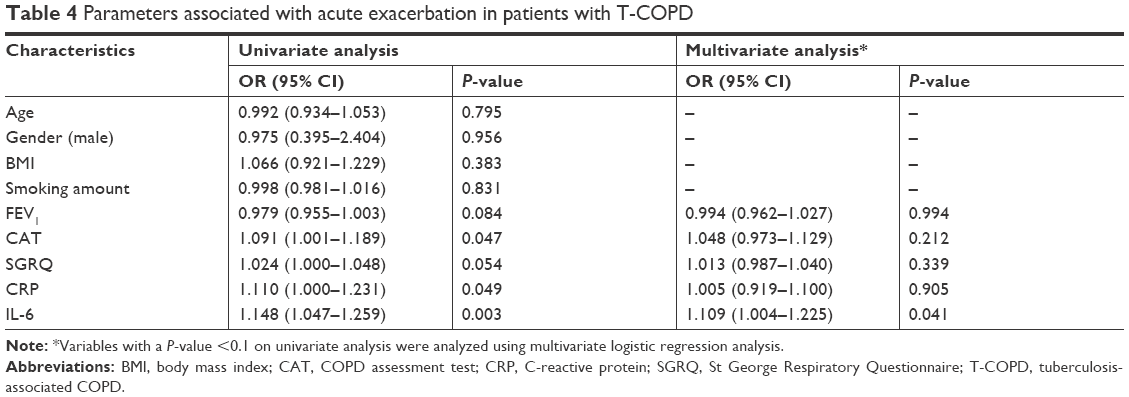 | Table 4 Parameters associated with acute exacerbation in patients with T-COPD |
Correlations between IL-6 and parameters in S-COPD and T-COPD
The level of IL-6 was positively correlated with residual volume (R=0.326, P=0.004) and the number of exacerbations (R=0.397, P<0.001) and negatively correlated with BMI (R=−0.390, P=0.001) and FEV1 (R=−0.308, P=0.006) in S-COPD. However, there was no correlation with IL-6 level and lung function in patients with T-COPD. Only the number of exacerbations was positively correlated with IL-6 level in patients with T-COPD (R=0.412, P<0.001).
ROC curve of IL-6 as a predictor of AE in T-COPD
IL-6 level >2.04 pg/mL was a cutoff for predicting exacerbation of T-COPD (sensitivity 84.8%, specificity 59.3%, P<0.001; Figure 2).
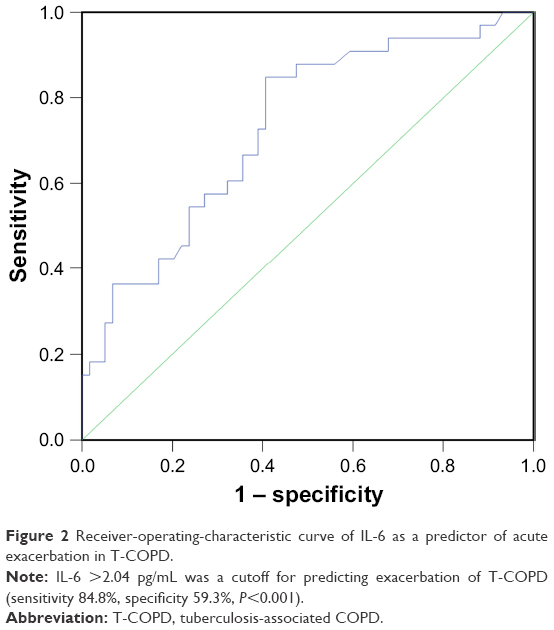 | Figure 2 Receiver-operating-characteristic curve of IL-6 as a predictor of acute exacerbation in T-COPD. |
Discussion
In this study, we found that patients with T-COPD have higher levels of systemic inflammatory markers than do those with S-COPD. Moreover, unlike S-COPD, IL-6 level was not correlated with lung function, and AE was associated with IL-6 level rather than lung function in T-COPD. IL-6 level >2.04 pg/mL was a cutoff for predicting exacerbation of TOPD.
This study revealed that T-COPD was associated with higher levels of inflammatory markers compared to S-COPD, and T-COPD may be a dynamic inflammatory disease like S-COPD. A previous study also reported that the concentrations of soluble IL-2 receptor, IL-6, tumor necrosis factor-α, and interferon-γ in T-COPD patients were significantly higher than those in S-COPD patients.13 Systemic inflammation is associated with mortality and comorbidities of S-COPD such as cardiovascular disease.3 Patients with T-COPD have high levels of systemic inflammatory biomarkers; this implies that these patients are at high risk of systemic morbidities.14 The T-COPD group had a similar prevalence of comorbidities, lung function decline rate, and AE as the S-COPD group, which suggests that T-COPD might be a progressive disease like S-COPD.
The development of T-COPD might be mediated by mechanisms of chronic inflammation.15 A recent study demonstrated development of new inflammatory lesions in tuberculosis patients after 1 year of completion of treatment.16 The levels of inflammatory cytokines remained high,17,18 and lung remodeling and chronic inflammatory response may persist after cure of tuberculosis.19 Immunologic mechanisms may also be involved in subsequent systemic inflammation after treatment of tuberculosis and cause progressive respiratory symptoms. Moreover, secondary bronchiectasis and microbial colonization in T-COPD may cause repetitive infection and inflammation that may lead to frequent AE.20–22 Therefore, we need to focus more on how to treat and control the systemic inflammatory response of T-COPD, and we may use inflammatory markers for predicting AE in T-COPD.
Prediction of AE, which is a key factor for disease progression, is important for controlling chronic inflammatory airway disease.23–25 In COPD studies, FEV1 is a key biomarker of severity and predictor of prognosis.26–28 Moreover, reduced lung function is known to be associated with increased levels of systemic inflammatory markers in S-COPD.29 However, lung function did not reflect the severity of inflammation or future AE risk in T-COPD in the present study. Airflow obstruction in T-COPD is probably due to cavitation, bronchiectasis, and inflammation-induced narrowing of airways.30 However, lung function of T-COPD is usually accompanied by restrictive changes resulting from extensive fibrosis, pleural thickening, and stiffening of the lung parenchyma.31 In this study, patients with T-COPD showed more mixed restrictive pathology (reduced FVC and TLC) than those with S-COPD, which was consistent with previous studies.32,33 Mixed pathophysiology of remodeling of lung destruction leads to a mixed pattern of pulmonary function tests and makes FEV1 unsuitable as a marker of T-COPD. This result is in line with previous study, which described that IL-6 was negatively correlated with FEV1 in S-COPD but not in T-COPD.13 Given that FEV1 correlated poorly with symptoms, impaired quality of life, and exacerbations,13 other biomarkers should be validated to evaluate and predict outcomes for T-COPD.
IL-6 is a proinflammatory cytokine that plays an important role in the systemic inflammatory response in COPD.34 It has been reported that elevated serum IL-6 levels are associated with decreased lung function, a faster decline in lung function, dyspnea, muscle weakness, and AE in COPD.35,36 Similarly, IL-6 was negatively correlated with BMI and FEV1 in S-COPD in this study. In S-COPD patients, IL-6 was associated with AE in the univariate model, but after adjustment of significant parameters, only FEV1, which was a more important factor in S-COPD, was correlated with AE. In contrast, activated inflammatory responses might be a more important predictor of poor outcomes in T-COPD patients in whom FEV1 is not a reliable parameter.
Our study had some limitations. First, the study was not a randomized controlled trial, and the cross-sectional cohort design may be associated with selection bias. Therefore, adjustment for variable confounding factors was attempted. Second, comparison of markers of inflammation in a healthy control group was not possible. However, it is well known that patients with stable COPD have higher inflammatory markers compared to the control groups (in the ECLIPSE cohort study, which included comparison of cytokine levels in nonsmokers with COPD, median [IQR] level of IL-6 in 1,755 COPD subjects was 1.5 [0.8–3.1] pg/mL, which was similar to that in the present study, and the level was 0.4 [0.2–0.9] pg/mL in 202 nonsmoker controls).37 Thus, it could be inferred that patients with T-COPD have higher levels of inflammatory markers than control groups. Third, other inflammatory cytokines shown to be elevated in COPD such as IL-8, tumor necrosis factor-α, or fibrinogen were not evaluated in the present study. Fourth, details of diagnosis and treatment of tuberculosis were not described. No change in chest imaging of patients included in the study was observed over the past year, which signified healed lesions and inactive state of tuberculosis. Despite this limitation, this study has strength in that we compared the systemic inflammatory markers between T-COPD and S-COPD and evaluated inflammatory markers as predictors of AE in T-COPD. To overcome the limitation of selection bias, further randomized clinical trials should be conducted on larger cohorts to validate the results of the present study.
Conclusion
In T-COPD, levels of inflammatory markers were higher and AE was associated with IL-6 rather than lung function, when compared to S-COPD. T-COPD may be a systemic inflammatory disease, and patients with T-COPD should be treated and monitored for systemic inflammation to prevent AE.
Acknowledgment
We would like to thank SY Hwang for the statistical support.
Authors contribution
All authors made substantial contributions to conception and design, acquisition of data, or analysis and interpretation of data; took part in drafting the article or revising it critically for important intellectual content; gave final approval of the version to be published; and agree to be accountable for all aspects of the work.
Disclosure
The authors report no conflicts of interest in this work.
References
Vestbo J, Hurd SS, Agustí AG, et al. Global strategy for the diagnosis, management, and prevention of chronic obstructive pulmonary disease: GOLD executive summary. Am J Respir Crit Care Med. 2013;187(4):347–365. | ||
Fischer BM, Pavlisko E, Voynow JA. Pathogenic triad in COPD: oxidative stress, protease-antiprotease imbalance, and inflammation. Int J Chron Obstruct Pulmon Dis. 2011;6:413. | ||
Barnes PJ. Chronic obstructive pulmonary disease: effects beyond the lungs. PLoS Med. 2010;7(3):e1000220. | ||
Sin DD, Man SF. Why are patients with chronic obstructive pulmonary disease at increased risk of cardiovascular diseases? The potential role of systemic inflammation in chronic obstructive pulmonary disease. Circulation. 2003;107(11):1514–1519. | ||
Vaguliene N, Zemaitis M, Lavinskiene S, Miliauskas S, Sakalauskas R. Local and systemic neutrophilic inflammation in patients with lung cancer and chronic obstructive pulmonary disease. BMC Immunol. 2013;14:36. | ||
Yasuda N, Gotoh K, Minatoguchi S, et al. An increase of soluble Fas, an inhibitor of apoptosis, associated with progression of COPD. Respir Med. 1998;92(8):993–999. | ||
Allwood BW, Gillespie R, Galperin-Aizenberg M, et al. Mechanism of airflow obstruction in tuberculosis-associated obstructive pulmonary disease (TOPD). D39. Connecting the dots: drawing lines between COPD and comorbid conditions: Proceeding of ATS Conferences, San Diego, CA, 21 May 2014. Am Thorac Soc. 2014;189:A5832. | ||
Sarkar M, Srinivasa, Madabhavi I, Kumar K. Tuberculosis associated chronic obstructive pulmonary disease. Clin Respir J. 2017;11(3):285–295. | ||
Pasipanodya JG, Miller TL, Vecino M, et al. Pulmonary impairment after tuberculosis. Chest. 2007;131(6):1817–1824. | ||
Ryu YJ, Lee JH, Chun EM, Chang JH, Shim SS. Clinical outcomes and prognostic factors in patients with tuberculous destroyed lung. Int J Tuberc Lung Dis. 2011;15(2):246–250. | ||
Yakar HI, Gunen H, Pehlivan E, Aydogan S. The role of tuberculosis in COPD. Int J Chron Obstruct Pulmon Dis. 2017;12:323–329. | ||
Kim CJ, Yoon HK, Park MJ, et al. Inhaled indacaterol for the treatment of COPD patients with destroyed lung by tuberculosis and moderate-to-severe airflow limitation: results from the randomized INFINITY study. Int J Chron Obstruct Pulmon Dis. 2017;12:1589. | ||
Tang S, Cui H, Yao L, et al. Increased cytokines response in patients with tuberculosis complicated with chronic obstructive pulmonary disease. PLoS One. 2013;8(4):e62385. | ||
de La Mora IL, Martínez-Oceguera D, Laniado-Laborín R. Chronic airway obstruction after successful treatment of tuberculosis and its impact on quality of life. Int J Tuberc Lung Dis. 2015;19(7):808–810. | ||
Hwang YI, Kim JH, Lee CY, et al. The association between airflow obstruction and radiologic change by tuberculosis. J Thorac Dis. 2014;6(5):471–476. | ||
Malherbe ST, Shenai S, Ronacher K, et al. Persisting positron emission tomography lesion activity and Mycobacterium tuberculosis mRNA after tuberculosis cure. Nat Med. 2016;22(10):1094–1100. | ||
Ugarte-Gil CA, Elkington P, Gilman RH, et al. Induced sputum MMP-1, -3 & -8 concentrations during treatment of tuberculosis. PLoS One. 2013;8(4):e61333. | ||
Radovic M, Ristic L, Ciric Z, et al. Changes in respiratory function impairment following the treatment of severe pulmonary tuberculosis – limitations for the underlying COPD detection. Int J Chron Obstruct Pulmon Dis. 2016;11:1307–1316. | ||
Byrne AL, Marais BJ, Mitnick CD, Lecca L, Marks GB. Tuberculosis and chronic respiratory disease: a systematic review. Int J Infect Dis. 2015;32:138–146. | ||
Jordan TS, Spencer EM, Davies P. Tuberculosis, bronchiectasis and chronic airflow obstruction. Respirology. 2010;15(4):623–628. | ||
Gatheral T, Kumar N, Sansom B, et al. COPD-related bronchiectasis; independent impact on disease course and outcomes. COPD. 2014;11(6):605–614. | ||
Mao B, Lu HW, Li MH, et al. The existence of bronchiectasis predicts worse prognosis in patients with COPD. Sci Rep. 2015;5:10961. | ||
Groenewegen KH, Schols AM, Wouters EF. Mortality and mortality-related factors after hospitalization for acute exacerbation of COPD. Chest. 2003;124(2):459–467. | ||
Connors Jr AF, Dawson NV, Thomas C, et al. Outcomes following acute exacerbation of severe chronic obstructive lung disease. The SUPPORT investigators (Study to Understand Prognoses and Preferences for Outcomes and Risks of Treatments). Am J Respir Crit Care Med. 1996;154:959–967. | ||
Wedzicha JA, Donaldson GC. Exacerbations of chronic obstructive pulmonary disease. Resp Care. 2003;48:1204–1213. | ||
Garcia-Aymerich J, Monsó E, Marrades RM, et al. Risk factors for hospitalization for a chronic obstructive pulmonary disease exacerbation. EFRAM study. Am J Respir Crit Care Med. 2001;164(6):1002–1007. | ||
Kerkhof M, Freeman D, Jones R, et al. Predicting frequent COPD exacerbations using primary care data. Int J Chron Obstruct Pulmon Dis. 2015;10:2439–2450. | ||
Hurst JR, Vestbo J, Anzueto A, et al. Susceptibility to exacerbation in chronic obstructive pulmonary disease. N Engl J Med. 2010;363(12):1128–1138. | ||
Gan WQ, Man SF, Senthilselvan A, Sin DD. Association between chronic obstructive pulmonary disease and systemic inflammation: a systematic review and a meta-analysis. Thorax. 2004;59(7):574–580. | ||
Ravimohan S, Kornfeld H, Weissman D, Bisson GP. Tuberculosis and lung damage: from epidemiology to pathophysiology. Eur Respir Rev. 2018;27(147):170077. | ||
Manji M, Shayo G, Mamuya S, Mpembeni R, Jusabani A, Mugusi F. Lung functions among patients with pulmonary tuberculosis in Dar es Salaam – a cross-sectional study. BMC Pulm Med. 2016;16(1):58. | ||
Rhee CK, Yoo KH, Lee JH, et al. Clinical characteristics of patients with tuberculosis-destroyed lung. Int J Tuberc Lung Dis. 2013;17(1):67–75. | ||
Santra A, Dutta P, Manjhi R, Pothal S. Clinico-radiologic and spirometric profile of an Indian population with post-tuberculous obstructive airway disease. J Clin Diagn Res. 2017;11(3):OC35–OC38. | ||
Chung KF. Cytokines in chronic obstructive pulmonary disease. Eur Respir J Suppl. 2001;34:S50–S59. | ||
Donaldson GC, Seemungal TA, Patel IS, et al. Airway and systemic inflammation and decline in lung function in patients with COPD. Chest. 2005;128(4):1995–2004. | ||
Yende S, Waterer GW, Tolley EA, et al. Inflammatory markers are associated with ventilatory limitation and muscle dysfunction in obstructive lung disease in well functioning elderly subjects. Thorax. 2006;61(1):10–16. | ||
Agustí A, Edwards LD, Rennard SI, et al. Persistent systemic inflammation is associated with poor clinical outcomes in COPD: a novel phenotype. PLoS One. 2012;7(5):e37483. |
 © 2018 The Author(s). This work is published and licensed by Dove Medical Press Limited. The
full terms of this license are available at https://www.dovepress.com/terms
and incorporate the Creative Commons Attribution
- Non Commercial (unported, 3.0) License.
By accessing the work you hereby accept the Terms. Non-commercial uses of the work are permitted
without any further permission from Dove Medical Press Limited, provided the work is properly
attributed. For permission for commercial use of this work, please see paragraphs 4.2 and 5 of our Terms.
© 2018 The Author(s). This work is published and licensed by Dove Medical Press Limited. The
full terms of this license are available at https://www.dovepress.com/terms
and incorporate the Creative Commons Attribution
- Non Commercial (unported, 3.0) License.
By accessing the work you hereby accept the Terms. Non-commercial uses of the work are permitted
without any further permission from Dove Medical Press Limited, provided the work is properly
attributed. For permission for commercial use of this work, please see paragraphs 4.2 and 5 of our Terms.