Back to Journals » Clinical Interventions in Aging » Volume 11
Dietary protein intake in sarcopenic obese older women
Authors Muscariello E, Nasti G, Siervo M, Di Maro M, Lapi D, D'Addio G, Colantuoni A
Received 9 September 2015
Accepted for publication 29 October 2015
Published 5 February 2016 Volume 2016:11 Pages 133—140
DOI https://doi.org/10.2147/CIA.S96017
Checked for plagiarism Yes
Review by Single anonymous peer review
Peer reviewer comments 3
Editor who approved publication: Dr Richard Walker
Espedita Muscariello,1 Gilda Nasti,1 Mario Siervo,2 Martina Di Maro,1 Dominga Lapi,1 Gianni D’Addio,3 Antonio Colantuoni1
1Department of Clinical Medicine and Surgery, Federico II University of Naples, Naples, Italy; 2Human Nutrition Research Centre, Institute for Ageing and Health, Newcastle University, Newcastle upon Tyne, UK; 3IRCCS Salvatore Maugeri Foundation, Telese, Italy
Objective: To determine the prevalence of sarcopenia in a population of obese older women and to assess the effect of a diet moderately rich in proteins on lean mass in sarcopenic obese older women.
Materials and methods: A total of 1,030 females, >65 years old, body mass index >30 kg/m2, were investigated about their nutritional status. Muscle mass (MM) was estimated according to the Janssen equation (MM =0.401× height2/resistance measured at 50 kHz +3.825× sex -0.071× age +5.102). Sarcopenia was defined according to the MM index, MM/height2 (kg/m2), as two standard deviations lower than the obesity-derived cutoff score (7.3 kg/m2). A food-frequency questionnaire was used to measure participants’ usual food intake during the previous 3 months. Moreover, a group of sarcopenic obese older women (n=104) was divided in two subgroups: the first (normal protein intake [NPI], n=50) administered with a hypocaloric diet (0.8 g/kg desirable body weight/day of proteins), and the second treated with a hypocaloric diet containing 1.2 g/kg desirable body weight/day of proteins (high protein intake [HPI], n=54), for 3 months. Dietary ingestion was estimated according to a daily food diary, self-administered, and three reports of nonconsecutive 24-hour recall every month during the follow-up.
Results: The 104 women were classified as sarcopenic. After dieting, significant reductions in body mass index were detected (NPI 30.7±1.3 vs 32.0±2.3 kg/m2, HPI 30.26±0.90 vs 31.05±2.90 kg/m2; P<0.01 vs baseline). The MM index presented significant variations in the NPI as well as in the HPI sarcopenic group (NPI 6.98±0.1 vs 7.10±0.2 kg/m2, HPI 7.13±0.4 vs 6.96±0.1 kg/m2; P<0.01 vs baseline).
Conclusion: A diet moderately rich in proteins was able to preserve MM in sarcopenic women. Therefore, adequate protein intake could contribute to the prevention of lean-mass loss associated with weight reduction in obese older people.
Keywords: lean body mass, aging, obesity, protein intake, sarcopenia
Introduction
In recent years, the prevalence of obesity in elderly persons has dramatically increased, with a consequent reduction in life expectancy and increased health problems.1 Obesity is characterized by excessive body-fat accumulation, resulting in increased cerebral vascular disease risk; this increase in fat mass (FM) is usually accompanied by a decrease in fat-free mass (FFM) in elderly people.2–4 Rosenberg defined this age-related decrease in muscle mass (MM) as sarcopenia.5
The presence of both conditions (obesity and sarcopenia) has been defined as sarcopenic obesity, characterized by reduced physical strength, a condition associated with increased disease risks.6 Recent predictions indicate an increase in geriatric obesity; therefore, both aging and obesity may have a heavy impact on public health, increasing the cost of the health care system of Western countries.7–13 The question we addressed in the present study was the nutritional management of obesity and sarcopenic obesity in aging. Bales and Bhur examined 16 randomized controlled trials of weight-loss interventions in people aged over 60 years, with baseline body mass index (BMI) >27 kg/m2, who lost >3% in weight over 6–12 months. The results indicated that weight-loss interventions caused significant benefits for those with osteoarthritis, cardiovascular disease, and type 2 diabetes, while negative effects were observed on bone mineral density and lean body mass.14
Weight-loss management programs should be targeted at decreased FM and preservation of MM. Several studies have suggested that reduction in MM and consequent sarcopenia are facilitated by physical inactivity and decreased dietary protein intake.15,16 The recommended protein dietary allowance has been 0.8 g/kg/day, at least in Italy.17,18 However, several studies on protein balance in people who are aging have been carried out using nitrogen-balance techniques.19–24 In a meta-analysis, Rand et al observed that young subjects tended to have a lower median requirement than older ones; however, the difference was not statistically significant. According to the authors, the median protein requirement was estimated as 0.65 g/kg/day good-quality protein. Consequently, the recommended dietary allowance was evaluated as 0.83 g/kg/day.24
Therefore, the main problem in older people is inadequate protein intake, compared to overall protein requirements. On the other hand, Campbell et al pointed out that 0.8 g protein/kg/day might be inadequate for elderly people, thus recommending protein intake of 1–1.25 g high-quality protein/kg/day for older persons.20–22
The aim of our study was to assess the prevalence of sarcopenia in a population of obese older women. Moreover, the main purpose was to examine the effects of a diet moderately rich in protein (1.2 g/kg desirable body weight [DBW]/day) on MM and strength during weight-loss management for 3 months in sarcopenic obese older females.
Materials and methods
Study participants
A total of 1,030 females, >65 years old, BMI >30 kg/m2, attending the Outpatient Clinic of Clinical Medicine and Surgery Department, Federico II University of Naples, Naples, Italy, were enrolled to determine the prevalence of sarcopenia. Nutritional assessment was carried out by anthropometric measurements and bioelectrical impedance analysis at the beginning and after 3 months’ dieting. Subjects were informed about the aim of the study, and they gave their written consent for the utilization of personal and health information for research purposes. The study was approved by the Research and Ethics Committee of the Medical School of the Federico II University of Naples, Italy. The exclusion criteria for the study were specific pathological conditions, such as kidney failure, systemic inflammatory disorders, cancer, neurodegenerative disorders, pharmacological treatment with steroids, antiretroviral drugs, weight-loss medications or insulin, and endocrine disorders. Sarcopenic subjects (n=104) were randomized in two groups using a block-randomization procedure (RandList for Windows). The first group (50 females, normal protein intake [NPI]) was administered with 0.8 g/kg DBW/day of proteins, while the second group (54 females, high protein intake [HPI]) was treated with 1.2 g/kg DBW/day of proteins. Figure 1 shows how the study population was derived.
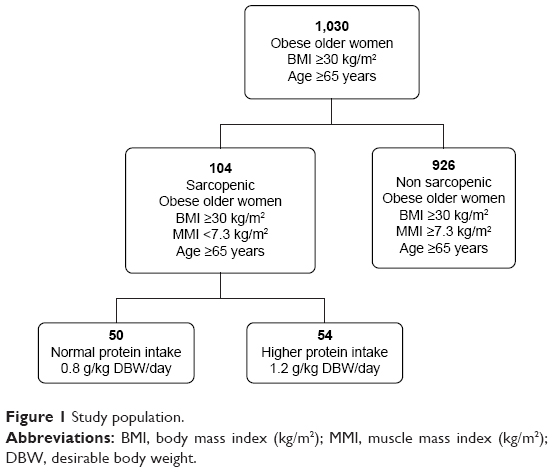 | Figure 1 Study population. |
Anthropometric measurements
Weight was measured to the nearest 1 g using a standard beam scale (Seca GmbH & Co KG, Hamburg, Germany). Height was measured using a wall-mounted stadiometer to the nearest 0.1 cm. Waist circumference (WC) was measured at the midpoint between the last rib and the iliac crest on the midaxillary line.25 Mid-upper-arm circumference was measured on the nondominant side at the midpoint between the tip of the acromial process of the scapula and the olecranon process of the ulna. Triceps skin-fold thickness was used to estimate MM according to the algorithm: (arm-muscle area [AMA] = [AC − {π × triceps skin fold}])2/4π. All measurements were performed at baseline and after 3 months’ dieting, using standardized protocols. In particular, staff performing measurements was blinded for the type of diet at baseline and after 3 months.
Bioelectrical impedance analysis
To analyze fat and lean body mass, bioelectrical impedance analysis (BIA) was undertaken by tetrapolar BI (RJL 101; Akern SRL, Florence, Italy). BIA was performed with a single-frequency measurement (50 kHz). BIA with a single frequency provides the best information at a body level, because it minimizes frequency-dependent errors and variability of electric flow paths.26 For the analysis, Biatrodes (Akern), high-sensitivity tab electrodes, were used. FM and FFM were obtained from measures of resistance and reactance, using the algorithm provided by the manufacturer. We compared the individual vector with the reference 50%, 75%, and 95% tolerance ellipses, as suggested.26 For our study, only vectors falling in the 50% tolerance ellipse were selected, to minimize tissue-impedance errors.
Muscle mass and obesity evaluation
MM was assessed using MM index (MMI) cutoff scores, defined as two MMI standard deviations below the mean of the young female reference group, derived from our obese adult population (n=361, age 30.9±7.9 years, BMI =35.4±6.0 kg/m2, MMI =9.3±1.0 kg/m2). We further evaluated the MMI in normal-weight adult women (n=313, age 28.5±7.6 years; BMI =24.1±2.5 kg/m2; MMI =8.1±0.6 kg/m2) (Figure 2, Table 1). In particular, MM was estimated from the resistance measured at 50 kHz (R50), according to the equation: MM =0.401× height2/R50 +3.825× sex −0.071× age +5.102.15 Height was in centimeters, R50 in ohms, age in years, and sex was coded 0 for women and 1 for men. The MMI was then calculated as: MM/height2 (kg/m2). FM and FFM were adjusted for height squared to account for age-related differences in height, and called FM index (FMI) and FFM index, respectively.25–29 Obesity was evaluated using established clinical and research cutoff scores for BMI, WC, FM%, and FMI. The cutoff scores for the classification of obesity included 1) BMI ≥30.0 kg/m2, 2) WC >88.0 cm, 3) FM% ≥35.0%, and 4) FMI ≥9.5 kg/m2.29
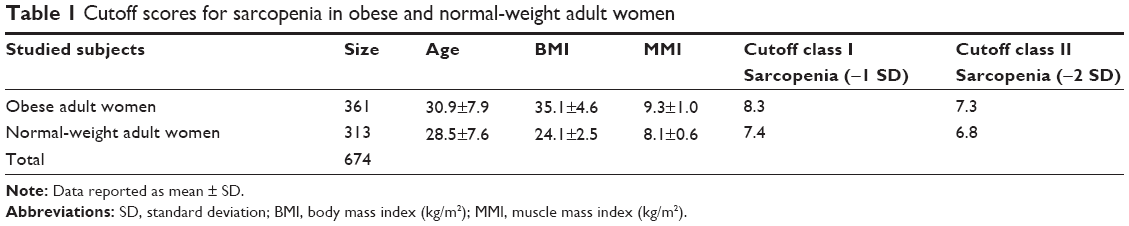 | Table 1 Cutoff scores for sarcopenia in obese and normal-weight adult women |
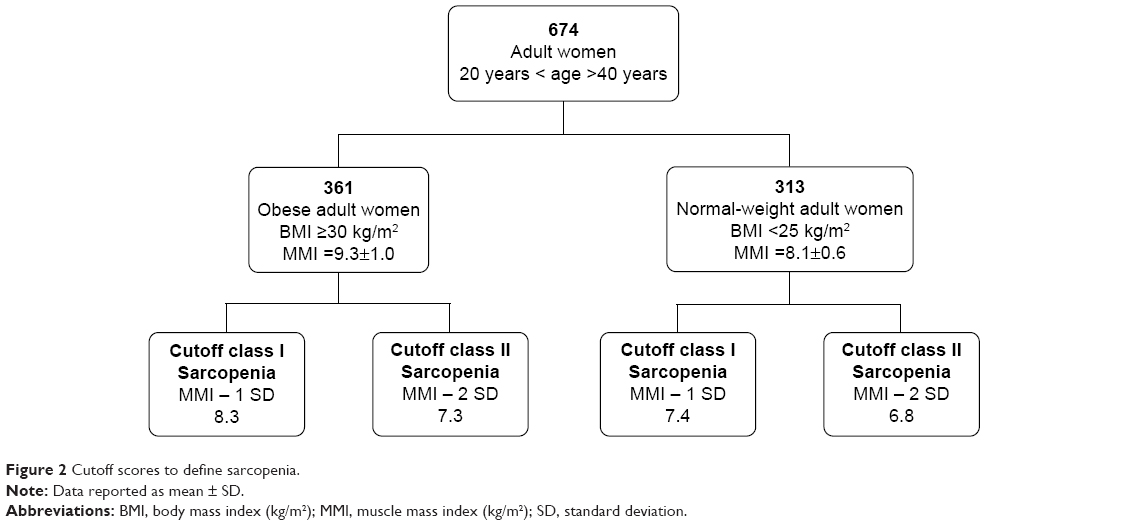 | Figure 2 Cutoff scores to define sarcopenia. |
Handgrip-strength measurement
To define sarcopenia, the European Working Group on Sarcopenia in Older People proposed the use of the presence of both low MM and low muscle function (strength or performance). Several techniques were validated to measure muscle strength. Although the legs are more relevant than upper limbs for physical function, handgrip strength has been widely used, and is strongly related with lower-extremity muscle power, knee-extension torque, and calf cross-sectional muscle area.30 Handgrip was measured on the dominant and nondominant hands to the nearest kilogram using a hand dynamometer (78010; Lafayette Instrument Company, Lafayette, IN, USA). During measurement, the participant was in an upright position and the arm of the measured hand was unsupported and parallel to the body. The researchers followed a specific protocol for measurement of handgrip strength: in particular, the width of the dynamometer’s handle was adjusted to participants’ hand size, and then participants were instructed to exert maximal force. Several studies showed that dominant-side grip strength exceeded nondominant-side grip strength for right-handed subjects, while no significant differences were observed for left-handed people.31,32 Therefore, for our study, three measurements were performed for the nondominant hand, and the average of recorded measurements was used for the analysis.
Diet treatment
To estimate usual nutrient intake, a food-frequency questionnaire (FFQ) was administered to all patients at the first visit. The questionnaire was used to measure participant’s usual food intake during the previous 3 months. A food list for the Italian diet was obtained by the European Prospective Investigation into Cancer and Nutrition (EPIC).33 In particular, we administered a semiquantitative food questionnaire calculated for the Naples cohort of EPIC;33 this contained questions on 140 food items. For each item, patients are asked to indicate their usual rate of consumption, choosing from eight frequency categories. The categories ranged from “less than once a month” to “twice a day”.33,34 Consumption was quantified using units (one apple, slice of bread), standard portion (eg, 120 g of meat), or household measures (eg, glass, cup). Additional questions were asked to detect the most common cooking methods and the type of fat usually used for cooking. Sarcopenic obese older peoples were treated with a hypocaloric diet for 3 months to lose weight. Each subject’s resting energy expenditure was estimated according to the sex-specific Harris–Benedict equation,35 and assigned caloric intake was approximately 20–25 kcal/kg DBW/day.
The caloric intake daily distribution was 20% of total calories in breakfast, 10% during each snack, 30% during lunch, and 30% during dinner. Sarcopenic obese older people were divided in two groups: the first group (50 females, NPI) was administered with 0.8 g/kg DBW/day of proteins (breakfast 25%–30% g, lunch 35%–40% g, dinner 35%–40% g), while the second group (54 females, HPI) was treated with 1.2 g/kg DBW/day of proteins (breakfast 25%–30% g, lunch 35%–40% g, dinner 35%–40% g).36,37
All groups were instructed to change their diet, increasing protein intake. In particular, good sources of proteins low in fat, including lean meat, poultry, and fish, were recommended. For each patient, a personalized diet was prepared, and the amount of protein, carbohydrates, and lipids to ingest was calculated according to DBW. Dietary ingestion was estimated according to a daily food diary, self-administered, and three reports of nonconsecutive 24-hour recall every month during the follow-up.
Physical activity
According to previous data, physical activity was recommended in older peoples, at least five times a week for 30 minutes (walking and/or aerobic activity); this activity has been suggested to improve and maintain health.8,27,38 Physical activity was evaluated using the Italian version of the International Physical Activity Questionnaire – Short Form (IPAQ-SF).39 The IPAQ has become the most widely used physical activity questionnaire.40
The questionnaire contains seven questions and comprehensively quantifies different physical activities (such as work, leisure time, home activities) in metabolic equivalent of tasks (METs). An MET is the unit of metabolic rate measurement, and is defined as the amount of heat emitted by a person in a sitting position per square meter of skin.
The questionnaire was administered to subjects at the first visit and at follow-up, performed monthly up to the end of the study. Responses were converted to MET minutes per week (METmin/week) according to the IPAQ-SF scoring protocol. The total minutes over the last 7 days, spent on vigorous activity, moderate activity, and walking, were multiplied by 8.0, 4.0, and 3.3, respectively, to create MET scores for each activity level. MET scores across the three subcomponents were summed to indicate the overall physical activity. Vigorous physical activity included heavy lifting, digging, aerobics, or fast bicycling; moderate physical activity included carrying light loads, bicycling at a regular pace, or doubles tennis; “walk” physical activity included activity like walk at work and/or at home, walking to travel from place to place, and any other walking (recreation, sport, exercise, or leisure).39
Statistical analysis
Data are reported as mean ± standard deviation unless otherwise stated. Analysis of variance and Student’s t-test (paired or unpaired) were used to compare groups before and after dieting. Statistical significance was set at P<0.05. Statistical analysis was carried out using SPSS 14 for Windows (SPSS Inc, Chicago, IL, USA).
Results
A total of 130 obese older females were recruited for the assessment of sarcopenia prevalence. At first, all obese older subjects presented high usual energy intake (1,815±204 kcal/day) and high usual consumption of fats (30.4%±2.1% of total energy intake), while the evaluated protein intake was 15.2%±1.3% of total energy intake. All subjects had a protein intake of 0.7±0.2 g/kg DBW/day. From the beginning of the study, the intake was increased to 0.8 g/kg DBW/day in the NPI group and 1.2 g/kg DBW/day in the HPI group.
Our data indicated that 104 obese women were class II sarcopenic according to the obesity-derived cutoff score (7.3 kg/m2) (Table 1); 50 sarcopenic patients were recruited to group 1 and administered an NPI diet, and 54 sarcopenic patients were recruited to group 2 and administered an HPI diet. Table 2 reports anthropometric measurements, as well as handgrip strength and MMI values, before and after 3 months’ dieting.
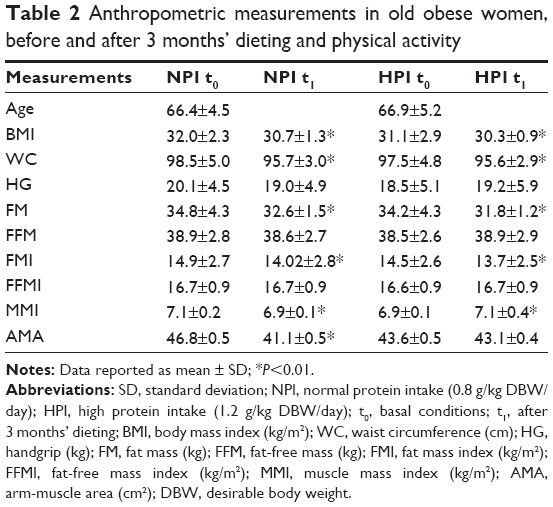 | Table 2 Anthropometric measurements in old obese women, before and after 3 months’ dieting and physical activity |
After treatment, BMI values were significantly reduced in both groups: 30.7±1.3 vs 32.0±2.3 kg/m2 (P<0.01 vs baseline) in NPI females, while in the HPI group BMI values were 30.3±0.9 vs 31.1±2.9 kg/m2 (P<0.01 vs baseline). Moreover, a significant reduction in WC was detected in the NPI as well as the HPI group (Table 2). In particular, WC was 95.7±3.0 vs 98.5±5.0 cm (P<0.01 vs baseline) in NPI females and 95.6±2.9 vs 97.5±4.8 cm (P<0.01 vs baseline) in HPI group. BIA showed significant reductions in FM in both groups after diet treatment (NPI 32.6±1.5 vs 34.8±4.3 kg, HPI 31.8±1.2 vs 34.2±4.3 kg; P<0.01 vs baseline). On the other hand, FFM did not show significant variations in the NPI or the HPI group, even though there was a decreasing trend in the NPI (38.6±2.7 vs 38.9±2.8 kg) group, as well as an increasing trend in the HPI group (38.9±2.9 vs 38.5±2.6 kg). After dieting, AMA was significantly reduced in the NPI group (41.1±0.5 vs 46.8±0.5 cm2, P<0.01 vs baseline), but not in HPI subjects (43.1±0.4 vs 43.6±0.5 cm2). Dieting induced significant reduction in MMI in NPI subjects (6.9±0.1 vs 7.1±0.2 kg/m2, P<0.01 vs baseline). Conversely, hypocaloric diet, higher in protein, increased MM in HPI females (MMI 7.1±0.4 vs 6.9±0.1 kg/m2, P<0.01 vs baseline) (Figure 3). Physical strength as measured by handgrip did not show significant variations in either group, even though there was a decreasing trend in the NPI group and an increasing trend in the HPI group (NPI 19.0±4.9 vs 20.1±4.5 kg, HPI 19.2±5.9 vs 18.5±5.1 kg).
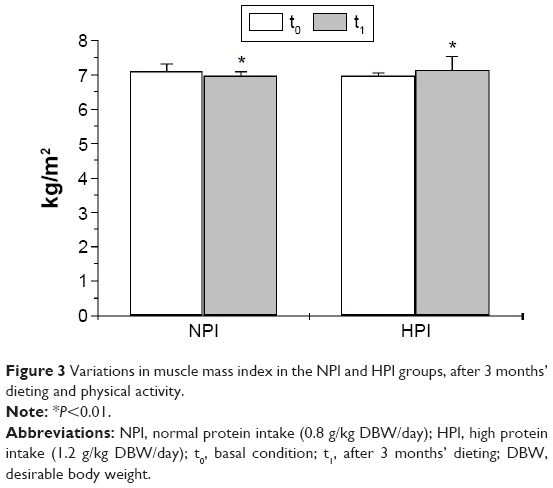 | Figure 3 Variations in muscle mass index in the NPI and HPI groups, after 3 months’ dieting and physical activity. |
Physical activity was evaluated according to the IPAQ-SF at the first visit and at follow-up, performed monthly up to the end of the study. At first, patients showed only moderate activity: levels were 327.5±84.2 METmin/week in the NPI group and 315.0±67.3 METmin/week in the HPI group. Physical activity (walking and/or aerobic activity) was recommended for 30 minutes at least five times a week. At the end of treatment, our studied population showed an increase in MET levels. In particular, all patients increased activity, and the detected level was 841.4±208.9 METmin/week in NPI females and 824.0±178.4 METmin/week in the HPI group.
In conclusion, no significant differences in physical activity were observed between the NPI and HPI groups under baseline conditions. After 3 months’ dieting, a significant increase in physical activity was observed in both groups (P<0.01), but no significant difference was detected between the groups.
Discussion
The combination of obesity and sarcopenia represents an emerging cause of frailty in older people.6,8,11,13,41 Aging is associated with changes in body composition, with a progressive increase in visceral abdominal fat, and loss of MM.4 Therefore, several studies have underlined that obese adults trying to lose weight need to consume almost 0.8 g/kg/day of good-quality proteins.17,18 On the other hand, several nitrogen-balance analyses suggested that 0.8 g/kg/day was inadequate in elderly patients; therefore, 1.4 g/kg/day of high-quality proteins has been proposed.19–22
The main goal of our study was to verify the effect of a diet moderately rich in proteins (1.2 g/kg DBW/day) on lean mass in sarcopenic obese older women. Baumgartner et al described sarcopenia as MM loss characterized by two standard deviations or more below the mean of height-adjusted MM (MM·height−2), calculated according to a young reference-population database.9,10,12,41 As reviewed elsewhere, a similar approach has been employed by several authors to classify sarcopenia.42,43 However, many attempts have also been made to develop cutoff scores useful to distinguish between sarcopenic older adults and older adults with a relatively healthy MM.44,45 Cutoff scores for sarcopenia classification are still questionable. The European Working Group on Sarcopenia in Older People recommends use of a healthy young adult population database, rather than other predictive reference populations, with cutoff scores at two standard deviations below the mean reference value.2 In previous studies, sarcopenia cutoff scores were not stratified for age or BMI, but both values were related to MM. In particular, our preliminary data showed that MMI was significantly higher in the obese adult population with respect to the normal-weight adult population (Table 1). It is worth noting that according to our normal-weight adult women cutoff score (6.8 kg/m2) (Table 1), only 17 obese older women were sarcopenic (class II sarcopenia). Furthermore, according to the Baumgartner et al cutoff score for women (5.45 kg/m2),41 no obese older females in our population were sarcopenic.
On the other hand, the present data show that sarcopenic women were detected using the obesity-derived cutoff score, avoiding underestimation of sarcopenia in obese older females. Consequently, in the present study, sarcopenia was defined according to the obese adult women cutoff score (7.3 kg/m2) (Table 1). According to this value, 104 women were class II sarcopenic in our study population. Fifty of these sarcopenic obese older women were treated with a hypocaloric diet characterized by 0.8 g/kg DBW/day protein intake, while the other 54 were administered with a hypocaloric diet characterized by 1.2 g/kg DBW/day protein intake.
After 3 months’ dieting, all groups showed a reduction in BMI and WC, as expected. Moreover, diet treatment was able to reduce FM in the NPI and HPI groups, while AMA significantly decreased only in the NPI group. MMI presented a significant reduction in NPI females, while in the HPI group MMI significantly increased. Our results on physical strength, evaluated by handgrip test, indicated that there were no significant differences in the groups after 3 months’ dieting. Even though a trend for decreased physical strength was observed in the NPI group, HPI females showed a trend for increase. Therefore, further studies are required to better define physical strength patterns. However, after 3 months’ observation, all patients showed a significant change in their physical activity levels, evaluated by the IPAQ-SF, as walking activity.
Our results indicate that obesity in older subjects could require a dietary approach based on caloric restriction, with proportional higher protein intake according to DBW. Protein intake of 0.8 g/kg DBW/day did not appear to preserve MM in sarcopenic women, while 1.2 g/kg DBW/day protein intake was effective in preserving MM, as indicated by MMI values. In particular, we did not prescribe different physical activity for both groups, and we did not detect differences in physical activity between the NPI and HPI groups during the study. Therefore, we assumed that changes in body composition were mostly linked to diet treatment. However, we observed a significant reduction in FM, while FFM did not show significant variations in the HPI group, and MMI (kg/m2) significantly increased. In conclusion, the changes in FM were not accompanied by a decrease in FFM; conversely, the changes in MMI were accompanied by a decrease in FM. In older subjects, where sarcopenia and obesity are recognized as the two major causes of disability, the decreased physical activity and the reduced energy expenditure predispose to fat accumulation and fat redistribution accompanied by MM loss. Treatment should be aimed at reducing intra-abdominal fat with conventional diet restriction, and to preserve MM and physical strength through appropriate protein intake, accompanied by moderate physical activity.
Limitations of the study
The first limitation of the present study was the small number of treated patients for each group: 50 sarcopenic obese older women were treated with a hypocaloric diet containing 0.8 g/kg DBW/day proteins, while 54 sarcopenic obese older females were administered with a hypocaloric diet containing 1.2 g/kg DBW/day proteins. Therefore, it will be important to increase the sample size to confirm the present data. A second limitation could have been confounding by comorbidity, because the observed effects of dieting and increased physical activity were restricted to a relatively healthy study sample. Furthermore, another limitation may have been the limited period of observation; indeed, 3 months’ dieting was a short time to obtain good correlation between the decrease in food intake and the MM loss. Therefore, we plan to increase observation time up to 6 and 12 months. In conclusion, the results of the present study appear to be encouraging, even though further studies are required. However, our data suggest that adequate protein intake, according to DBW, and physical activity may prevent lean-mass losses associated with voluntary weight loss.
Author contributions
EM collected data, designed the analysis, co-analyzed the data, wrote the manuscript and revised the manuscript. GN collected data, co-analyzed data and revised the manuscript. MS collected data, co-analyzed data and revised the manuscript. MDM collected data, co-analyzed data, wrote the manuscript and revised the manuscript. DL collected data, co-analyzed data and revised the manuscript. GD collected data, advised on statistical analysis and revised the manuscript. AC designed the study, co-analyzed data, wrote the manuscript and revised the manuscript. All Authors read and approved the findings of the study.
Disclosure
The authors report no conflicts of interest in this work.
References
Ogden CL, Carroll MD, Curtin LR, McDowell MA, Tabak CJ, Flegal KM. Prevalence of overweight and obesity in the United States, 1999–2004. JAMA. 2006;295(13):1549–1555. | ||
Cruz-Jentoft AJ, Baeyens JP, Bauer JM, et al. Sarcopenia: European consensus on definition and diagnosis. Report of the European Working Group on Sarcopenia in Older People. Age Ageing. 2010;39(4):412–423. | ||
Han TS, Tajar A, Lean ME. Obesity and weight management in the elderly. Br Med Bull. 2011;97(1):169–196. | ||
Janssen I, Ross R. Linking age-related changes in skeletal muscle mass and composition with metabolism and disease. J Nutr Health Aging. 2005;9(6):408–419. | ||
Rosenberg IH. Sarcopenia: origins and clinical relevance. J Nutr. 1997;127(5 Suppl):990S–991S. | ||
Clark BC, Manini TM. Sarcopenia =/= dynapenia. J Gerontol A Biol Sci Med Sci. 2008;63(8):829–834. | ||
Doherty TJ. Invited review: aging and sarcopenia. J Appl Physiol (1985). 2003;95(4):1717–1727. | ||
Jarosz PA, Bellar A. Sarcopenic obesity: an emerging cause of frailty in older adults. Geriatr Nurs. 2009;30(1):64–70. | ||
Morley JE, Baumgartner RN, Roubenoff R, Mayer J, Nair KS. Sarcopenia. J Lab Clin Med. 2001;137(4):231–243. | ||
Rolland Y, Lauwers-Cances V, Cournot M, et al. Sarcopenia, calf circumference and physical function of elderly women: a cross sectional study. J Am Geriatr Soc. 2003;51(8):1120–1124. | ||
Roubenoff R. Sarcopenic obesity: the confluence of two epidemics. Obes Res. 2004;12(6):887–888. | ||
Waters DL, Baumgartner RN, Garry PJ. Sarcopenia: current perspectives. J Nutr Health Aging. 2000;4(3):133–139. | ||
Zamboni M, Mazzali G, Fantin F, Rossi A, Di Francesco V. Sarcopenic obesity: a new category of obesity in the elderly. Nutr Metab Cardiovasc Dis. 2008;18(5):388–395. | ||
Bales CW, Buhr G. Is obesity bad for older persons? A systematic review of the pros and cons of weight reduction in later life. J Am Med Dir Assoc. 2008;9(5):302–312. | ||
Janssen I, Heymsfield SB, Ross R. Low relative skeletal muscle mass (sarcopenia) in older persons is associated with functional impairment and physical disability. J Am Geriatr Soc. 2002;50(5):889–896. | ||
Tipton KD. Muscle protein metabolism in the elderly: influence of exercise and nutrition. Can J Appl Physiol. 2001;26(6):588–606. | ||
Trumbo P, Schlicker S, Yates AA, Poos M. Dietary reference intakes for energy, carbohydrates, fiber, fat acids, cholesterol, protein and amino acids. J Am Diet Assoc. 2002;102(11):1621–1630. | ||
Volpi E, Campbell WW, Dwyer JT, et al. Is the optimal level of protein intake for older adults greater than the recommended dietary allowance? J Gerontol A Biol Sci Med Sci. 2013;68(6):677–681. | ||
Campbell WW, Crim MC, Dallal GE, Young VR, Evans WJ. Increased protein requirements in elderly people: new data and retrospective reassessments. Am J Clin Nutr. 1994;60(4):501–509. | ||
Campbell WW, Johnson CA, McCabe GP, Carnell NS. Dietary protein requirements of younger and older adults. Am J Clin Nutr. 2008;88(5): 1322–1329. | ||
Deutz NE, Bauer JM, Barazzoni R, et al. Protein intake and exercise for optimal muscle function with aging: recommendations from the ESPEN Expert Group. Clin Nutr. 2014;33(6):929–936. | ||
Bauer J, Biolo G, Cederholm T, et al. Evidence-based recommendations for optimal dietary protein intake in older people: a position paper from the PROT-AGE study group. J Am Med Dir Assoc. 2013;14(8):542–559. | ||
Kurpad AV, Vaz M. Protein and amino acid requirements in the elderly. Eur J Clin Nutr. 2000;54 Suppl 3:S131–S142. | ||
Rand WM, Pellett PL, Young VR. Meta-analysis of nitrogen balance studies for estimating protein requirements in healthy adults. Am J Clin Nutr. 2003;77(1):109–127. | ||
Siervo M, Stephan BC, Nasti G, Colantuoni A. Ageing, adiposity indexes and low muscle mass in a clinical sample of overweight and obese women. Obes Res Clin Pract. 2012;6(1):e1–e90. | ||
Piccoli A. Patterns of bioelectrical impedance vector analysis: learning from electrocardiography and forgetting electric circuit models. Nutrition. 2002;18(6):520–521. | ||
Frontera WR, Meredith CN, O’Reilly KP, Evans WJ. Strength training and determinants of VO2max in older men. J Appl Physiol (1985). 1990;68(1):329–333. | ||
Tichet J, Vol S, Goxe D, Salle A, Berrut G, Ritz P. Prevalence of sarcopenia in the French senior population. J Nutr Health Aging. 2008; 12(3):202–206. | ||
VanItallie TB, Yang MU, Heymsfield SB, Funk RC, Boileau RA. Height-normalised indices of the body’s fat free mass and fat mass: potentially useful indicators of nutritional status. Am J Clin Nutr. 1990;52(6):953–959. | ||
Lauretani F, Russo CR, Bandinelli S, et al. Age-associated changes in skeletal muscles and their effect on mobility: an operational diagnosis of sarcopenia. J Appl Physiol (1985). 2003;95(5):1851–1860. | ||
Incel NA, Ceceli E, Durukan PB, Erdem HR, Yorgancioglu ZR. Grip strength: effect of hand dominance. Singapore Med J. 2002;43(5):234–237. | ||
Armstrong CA, Oldham JA. A comparison of dominant and non-dominant hand strengths. J Hand Surg Br. 1999;24(4):421–425. | ||
Pala V, Sieri S, Palli D, et al. Diet in the Italian EPIC cohorts: presentation of data and methodological issues. Tumori. 2003;89(6):594–607. | ||
Panico S, Dello Iacovo R, Celentano E, et al. Progetto ATENA, a study on the etiology of major chronic diseases in women: design, rationale and objectives. Eur J Epidemiol. 1992;8(4):601–608. | ||
Harris J, Benedict F. A Biometric Study of Basal Metabolism in Man. Washington: Carnegie Institution; 1919. | ||
Symons TB, Schutzler SE, Cocke TL, Chinkes DL, Wolfe RR, Paddon-Jones D. Aging does not impair the anabolic response to a protein-rich meal. Am J Clin Nutr. 2007;86(2):451–456. | ||
Paddon-Jones D, Rasmussen BB. Dietary protein recommendations and the prevention of sarcopenia. Curr Opin Clin Nutr Metab Care. 2009;12(1):86–90. | ||
Frontera WR, Meredith CN, O’Reilly KP, Knuttgen HG, Evans WJ. Strength conditioning in older men: skeletal muscle hypertrophy and improved function. J Appl Physiol (1985). 1988;64(3): 1038–1044. | ||
Lee PH, Macfarlane DJ, Lam TH, Stewart SM. Validity of the International Physical Activity Questionnaire Short Form (IPAQ-SF): a systematic review. Int J Behav Nutr Phys Act. 2011;8:115. | ||
van Poppel MN, Chinapaw MJ, Mokkink LB, van Mechelen W, Terwee CB. Physical activity questionnaires for adults: a systematic review of measurement properties. Sports Med. 2010;40(7):565–600. | ||
Baumgartner RN, Koehler KM, Gallagher D, et al. Epidemiology of sarcopenia among the elderly in New Mexico. Am J Epidemiol. 1998;147(8):755–763. | ||
Kim YS, Lee Y, Chung YS, et al. Prevalence of sarcopenia and sarcopenic obesity in the Korean population based on the Fourth Korean National Health and Nutritional Examination Surveys. J Gerontol A Biol Sci Med Sci. 2012;67(10):1107–1113. | ||
Merriwether EN, Host HH, Sinacore DR. Sarcopenic indices in community-dwelling older adults. J Geriatr Phys Ther. 2012;35(3):118–125. | ||
Prado CM, Wells JC, Smith SR, Stephan BC, Siervo M. Sarcopenic obesity: a critical appraisal of the current evidence. Clin Nutr. 2012;31(5):583–601. | ||
Waters DL, Baumgartner RN. Sarcopenia and obesity. Clin Geriatr Med. 2011;27(3):401–421. |
 © 2016 The Author(s). This work is published and licensed by Dove Medical Press Limited. The
full terms of this license are available at https://www.dovepress.com/terms
and incorporate the Creative Commons Attribution
- Non Commercial (unported, 3.0) License.
By accessing the work you hereby accept the Terms. Non-commercial uses of the work are permitted
without any further permission from Dove Medical Press Limited, provided the work is properly
attributed. For permission for commercial use of this work, please see paragraphs 4.2 and 5 of our Terms.
© 2016 The Author(s). This work is published and licensed by Dove Medical Press Limited. The
full terms of this license are available at https://www.dovepress.com/terms
and incorporate the Creative Commons Attribution
- Non Commercial (unported, 3.0) License.
By accessing the work you hereby accept the Terms. Non-commercial uses of the work are permitted
without any further permission from Dove Medical Press Limited, provided the work is properly
attributed. For permission for commercial use of this work, please see paragraphs 4.2 and 5 of our Terms.