Back to Journals » Nanotechnology, Science and Applications » Volume 14
Diamond Nanofilm Normalizes Proliferation and Metabolism in Liver Cancer Cells
Authors Sosnowska M ![]() , Kutwin M, Strojny B
, Kutwin M, Strojny B ![]() , Wierzbicki M
, Wierzbicki M ![]() , Cysewski D, Szczepaniak J, Ficek M
, Cysewski D, Szczepaniak J, Ficek M ![]() , Koczoń P, Jaworski S
, Koczoń P, Jaworski S ![]() , Chwalibog A
, Chwalibog A ![]() , Sawosz E
, Sawosz E
Received 8 June 2021
Accepted for publication 28 July 2021
Published 28 August 2021 Volume 2021:14 Pages 115—137
DOI https://doi.org/10.2147/NSA.S322766
Checked for plagiarism Yes
Review by Single anonymous peer review
Peer reviewer comments 2
Editor who approved publication: Professor Israel Rubinstein
Malwina Sosnowska,1 Marta Kutwin,1 Barbara Strojny,1 Mateusz Wierzbicki,1 Dominik Cysewski,2 Jarosław Szczepaniak,1 Mateusz Ficek,3 Piotr Koczoń,4 Sławomir Jaworski,1 André Chwalibog,5 Ewa Sawosz1
1Department of Nanobiotechnology, Institute of Biology, Warsaw University of Life Sciences, Warsaw, Poland; 2Spectrometry Laboratory, Institute of Biochemistry and Biophysics, Polish Academy of Science, Warsaw, Poland; 3Department of Metrology and Optoelectronics, Gdansk University of Technology, Gdansk, Poland; 4Department of Chemistry, Institute of Food Sciences, Warsaw University of Life Sciences, Warsaw, Poland; 5Department of Veterinary and Animal, Sciences, University of Copenhagen, Frederiksberg, Denmark
Correspondence: André Chwalibog
Department of Veterinary and Animal Sciences, University of Copenhagen, Groennegaardsvej 3, Frederiksberg, 1870, Denmark
Tel +45 40963573
Email [email protected]
Malwina Sosnowska
Department of Nanobiotechnology, Institute of Biology, Warsaw University of Life Sciences, Warsaw, Poland
Tel +48 225936667
Email [email protected]
Purpose: Surgical resection of hepatocellular carcinoma can be associated with recurrence resulting from the degeneration of residual volume of the liver. The objective was to assess the possibility of using a biocompatible nanofilm, made of a colloid of diamond nanoparticles (nfND), to fill the side after tumour resection and optimize its contact with proliferating liver cells, minimizing their cancerous transformation.
Methods: HepG2 and C3A liver cancer cells and HS-5 non-cancer cells were used. An aqueous colloid of diamond nanoparticles, which covered the cell culture plate, was used to create the nanofilm. The roughness of the resulting nanofilm was measured by atomic force microscopy. Mitochondrial activity and cell proliferation were measured by XTT and BrdU assays. Cell morphology and a scratch test were used to evaluate the invasiveness of cells. Flow cytometry determined the number of cells within the cell cycle. Protein expression in was measured by mass spectrometry.
Results: The nfND created a surface with increased roughness and exposed oxygen groups compared with a standard plate. All cell lines were prone to settling on the nanofilm, but cancer cells formed more relaxed clusters. The surface compatibility was dependent on the cell type and decreased in the order C3A >HepG2 >HS-5. The invasion was reduced in cancer lines with the greatest effect on the C3A line, reducing proliferation and increasing the G2/M cell population. Among the proteins with altered expression, membrane and nuclear proteins dominated.
Conclusion: In vitro studies demonstrated the antiproliferative properties of nfND against C3A liver cancer cells. At the same time, the need to personalize potential therapy was indicated due to the differential protein synthetic responses in C3A vs HepG2 cells. We documented that nfND is a source of signals capable of normalizing the expression of many intracellular proteins involved in the transformation to non-cancerous cells.
Keywords: cell cycle, cell proteome, diamond nanofilm, extracellular matrix, invasion, liver cancer
Introduction
Hepatocellular carcinoma (HCC) ranks fourth among neoplasms in terms of the number of deaths caused worldwide.1 Potential therapy is difficult because the liver parenchyma is characterized by a high activity of efflux pumps and physiological detoxification of drugs, making it resistant to most chemotherapeutic agents.2 The application of even modern therapies, such as first- and second-generation tyrosine kinase inhibitors, inhibitors of inflammatory processes, and genetically modified T cells taken from the patient (CAR-T) extended the lives of patients with advanced hepatoma by only one year.3 Resection, and even re-resection, is in many cases the best therapeutic method.4 However, there is still a high risk of tumour recurrence, resulting, inter alia, from the presence of multinodular cirrhosis in the rest of the liver.5 The niche remaining after resection is thus a largely degraded tissue, unable to promote liver regeneration mechanisms.
The leading cause of liver cancer is the quantitative and qualitative remodelling of extracellular matrix (ECM) components due to inflammation, steatosis and liver fibrosis.6 The normal ECM is a mosaic of various components, including fibrous proteins (collagen, fibronectin, laminin and vitronectin), proteoglycans and glycosaminoglycans, the detection of which by cellular receptors directs complex signalling pathways in the cell.7 Even small changes in the content of ECM components and their distribution contribute to changes in the stiffness and elasticity of the matrix and abnormal signal transduction in the cell.8 Modification of the mechanical properties of the ECM affects the behaviour of cells and can change their phenotype, leading to neoplasm.9–11 Moreover, an incorrect matrix promotes genetic mutations, which further affects abnormalities in the formation of ECM structure.7,12
The search for a biocompatible material that is capable of supporting, improving and partially replacing degraded ECM and can be inserted into a niche after tumour resection is a challenge. The ideal biomaterial to support the degraded ECM should be non-toxic, non-degradable, stable in vivo, nano-sized, plastic to easily adapt to the tissue structure and hydrophilic with a varied physical structure and exposed oxygen groups on its surface.13
Diamond nanoparticles (NDs) are hydrophilic and photostable with a low coefficient of friction14,15 and, at the same, time capable of creating a unique surface composed of a conglomerate of nano-sized particles, or ‘balls’, can be considered as an essential mechanical element of the ECM mimic. According to the latest research, carbon scaffolds that are not subject to enzymatic degradation can play the role of a matrix for cell growth and maturation for a long time and undergo remodelling corresponding to the tissue kinetics.16 Moreover, diamond does not acidify the ECM with its degradation products, unlike the biodegradable polymers used in the construction of ECM mimic scaffolds.17,18
Thus, creating a self-organizing layer of ND, making a unique substrate that forms a 3D structure in nano-morphology visualization, can support the ECM. The structure can induce mechanical stimuli through a stiffness gradient and chemical stimuli through the presence of oxygen on the surface and communicate with the cell through its charge, which can modulate the polarity and behaviour of cells. The stiffness gradient occurs naturally in the liver tissue, where the matrix is softer around hepatocytes than in stellate cells.19 The adsorption properties of the polar groups of diamond allow it to selectively bind many serum adhesion proteins to its surface20 and control their release, which resembles the dynamic activity of the ECM.21 On the other hand, diamond coatings can also have anti-adhesive properties if they have hydrogen groups on their surface,20,22 which means that, like ECMs, they create a varied structure with hydrophilic and hydrophobic spaces.
Diamond nanoparticles are considered the least toxic carbon material. They are not a source of inflammation and blood clots; they are haemocompatible and do not generate reactive oxygen species.23–28 In in vitro and in ovo studies, the low concentration of ND did not cause morphological changes in liver cancer cells.29 It did not affect the growth and development of chicken embryos.30 Moreover, high doses of ND injected intraperitoneally did not cause pathological changes in rats.31 There are several reports on the inhibition of the expansion of lung and colon cancer cells32 and glioma33 by ND suspended in the culture medium. It seems that the key to diamond biocompatibility and diamond-based scaffolds is the inhibition of endocytosis.32
Due to its stiffness, diamond is mainly used as a mimic of bone ECM,34 as diamond layers can stimulate adhesion, growth and maturation of osteoblasts and, consequently, regeneration of bone tissue.35 Due to its biocompatibility, it is used in the form of a monolayer to support neural networks. Neurons adhere to and grow on the ND and mostly become morphologically similar to neurons grown on ECM proteins.36 Chen et al20 showed that ultra-nanocrystalline diamond films regulate the spontaneous differentiation of neural stem cells in the absence of growth factors. The ability to induce cell differentiation to produce the desired tissue is one of the key features of native ECM. Thus, ND can be the mimic ECM of both hard (bone) and soft (liver and brain) tissues and promote the growth of even the most demanding cells.36
In the present research, we demonstrated, for the first time, the concept of a niche modification method after resection of a liver tumour. The proposed idea is to cover the resulting niche after tumour removal with a colloidal solution of ND. Spraying or washing the niche with such a solution creates a very thin nanofilm on the surface of the tissues of the niche, made of a layer of ND. We assumed that the resulting nanofilm, as an alternative to the damaged tissue structure, and above all ECM, adjacent to the tumour, should promote proper adhesion, reduce the rate of proliferation and reduce cell malignancy. The objective was to prove that the nanofilm formed by ND, as a source of mechano- and chemotransduction, can play the role of a mechano-chemo-transduction signal activator. It can normalize the expression of key intracellular proteins involved in adhesion, migration and proliferation, and consequently, reduce the oncogenic potential of the cell. The diamond nanofilm (nfND) could be used to fill a niche after hepatic tumour resection, leading to colonization of the niche and regeneration of the liver.
Materials and Methods
Preparation and Characterization of Diamond Nanoparticles and Diamond Nanofilm
Characterization of Diamond Nanoparticles
Diamond nanoparticles were produced by the detonation method and obtained from SkySpring Nanomaterials. Nanomaterials were purchased as a powder, dispersed into ultrapure Milli-Q water and sonicated in an ultrasonic bath (Bandelin Electronic, Berlin, Germany). The morphology of ND (50 mg/L solutions) was characterized using transmission electron microscopy (TEM: JEM-1220 JEOL, Tokyo, Japan) and scanning electron microscopy (SEM; Quanta 200, FEI, Hillsboro, USA) in two independent samples. Zeta potential was determined with a Nano-ZS90 Zetasizer (Malvern Instruments, Malvern, UK) in triplicate.
To determine the functional groups of ND, the Fourier transform infrared (FTIR) spectra were studied using a Perkin Elmer System 2000 instrument (MA, USA) operated by Pegrams software. All steps were performed according to Sosnowska et al.11 Spectra were presented as transmittance (dependent variable) against wavenumber (independent variable) in the range of 500–4000 cm−1. At least 25 scans per sample were completed.
Raman Spectroscopy measurements of nanodiamond powder were performed using a Horiba Jobin Yvon T64000 spectrometer equipped with a single grating and an automated 3-axis stage with a 100-nm spatial resolution. The excitation source was a Kimmon Koha He–Cd dual-mode (325 nm/422 nm) laser. The 422 nm wavelength laser light and satellite lines were removed with a series of optical filters. The laser light with a power of 23 mW was focused on the nanodiamond powder using an Olympus MPFLN objective with 50x magnification. The analysis of the Raman spectra was conducted using the OriginPro 2020 (64-bit) SR1 9.7.0.188 software.
Characterization of Diamond Nanofilm
ND aqueous solution at a concentration of 1000 mg/L was used to form a nanofilm. Colloids were dried under sterile conditions. Then, 104 µg of ND solution was placed on a 1 cm2 surface. Nanofilms were adhered perfectly to the bottom of the plastic wells and formed a thin surface. Roughness parameters were measured using atomic force microscopy (AFM) (Nanosurf, Liestal, Switzerland). AFM images were taken of two independent samples at the edge and the centre of nfND. AFM was also performed on uncoated polystyrene plates (control).
Cell cultures
A non-cancer bone marrow stromal cell line (HS-5, CRL-11882) and liver cancer cell lines (HepG2, HB-8065; C3A, CRL-10741) were purchased from the American Type Culture Collection (ATCC). The cell cultures were maintained at 37°C, under 5% CO2, in Dulbecco’s Modified Eagle Medium, Low Glucose (DMEM, Gibco, Thermo Fisher Scientific, Waltham, MA, USA). DMEM media were supplemented with 10% foetal bovine serum (FBS, Life Technologies), penicillin (100 U/mL) and streptomycin (100 mg/mL, Life Technologies). HS-5, HepG2 and C3A cells were seeded on 6-well plates, 96-well plates and 2-well culture inserts at a concentration of 1.5 × 10⁵, 1×10⁴ and 4×10⁴ per well, respectively. Experiments were conducted according to the following scheme: 1. HS-5 cell control; 2. HS-5 cells on nfND; 3. HepG2 cell control; 4. HepG2 cells on nfND; 5. C3A cell control; C3A cells on nfND.
Scanning Electron Microscopy
To assess the morphological changes in cells grown on 6-well plates uncoated and coated with ND nanofilm, scanning electron microscopy (SEM) was used (Quanta 200). Cells were maintained on nfND for 7 days without medium changes, then rinsed in phosphate-buffered saline (PBS, pH 7.2) and fixed in 2.5% glutaraldehyde (G5882, Sigma-Aldrich). Subsequent steps were performed using osmium tetroxide and carbohydrazide. Contrasted cells were dehydrated through a hexylene glycol series (Sigma-Aldrich) using a point dryer (Polaron CPD 7501, Quorum Technologies, Laughton, UK). Finally, samples were placed on aluminium SEM, and four independent images were taken for each sample.
XTT Assay
Cell viability was determined with the XTT assay kit (No. 11465015001, Roche, Mannheim, Germany). Cells were transferred to a 96-well plate with nfND (or without as a control) and cultured for 24 and 48 h. XTT reagent (50 µL) was added to the culture medium (100 µL). Then, cells were incubated at 37°C for 1 h. Before viability changes were read, the culture medium was transferred to a new plate (without nanofilm). The results were measured using a Tecan Infinite 200 microplate reader (Tecan, Durham, NC, USA) at 475 nm and a reference wavelength of 650 nm. Cell viability is expressed as the percentage of ODtest/ODcontrol, where ODtest is the optical density of cells seeded on nfND, and ODcontrol is the optical density of the control sample. All study groups were evaluated in six repetitions.
BrdU Assay
Cell proliferation studies were based on the measurement of BrdU incorporation during DNA synthesis. Cells were seeded on 96-well microplates according to the scheme as described in the section ‘Cell cultures’. After a 24-h incubation, BrdU labelling solution was added to a final concentration of 20 µM in each well. Cells were labelled for 24 h at 37°C. The next steps were carried out according to the protocol (No. 11647229001, Roche). The reaction product was quantified by measuring the absorbance at 450 nm and a reference wavelength of 690 nm using a Tecan Infinite 200 microplate reader. Before the changes in proliferation were read, the liquid was transferred to a new plate (without nanofilms). Cell proliferation was expressed as the percentage of ODtest/ODcontrol. All study groups were evaluated in six repetitions.
Scratch Wound Closure Assay
Cell migration was observed using a 2-well culture insert (No. 80209, Animalab, Germany). The inserts were placed in 6-well plates uncoated and completely coated with nfND. Colloids were dried under sterile conditions, and then inserts were placed in 6-well plates coated by nfND. Cells were cultivated in a 2-well culture insert in 70 µL of DMEM to achieve a monolayer. According to the manufacturer's information, the growth area in the culture insert was 0.22 cm2 per well and the cell-free gap was 500 µm ± 100 µm. After 24 h of incubation and removal of the insert, the cell layer was washed with PBS to remove any non-adherent cells. The 6-well plate was filled with 2 mL of DMEM in each well. The cultivation time was adjusted to nearly complete cell coverage of the free gap, ie 72 h for HS-5 cells and 7 days for C3A and HepG2 cells. After incubation, cells were stained with haematoxylin-eosin (H+E). Images were acquired in the same area at 10× magnification of the free gap using a digital camera (Leica MC190 HD) mounted on an inverted microscope with LAS V4.10 software (Leica, Wetzlar, Germany). The wound-closure rate was assessed on the basis of extracellular spaces (%) of a 1-mm2 area using ImageJ® 1.48v. software (National Institutes of Health, Bethesda, MD, USA).
Mass Spectrometry
The cells were cultivated on a 6-well plate for 7 days as described in the section, “Cell cultures”. Following incubation, cells were detached, harvested and centrifuged at 1200 rpm for 10 min. Whole-cell protein extract was prepared with a TissueLyser LT instrument (Qiagen, Hilden, Germany) using 50 µL of ice-cold radioimmunoprecipitation assay (RIPA) buffer for each biological sample. RIPA buffer was supplemented with protease inhibitors (Sigma-Aldrich, St. Louis, MO, USA) at a ratio of 100:1. The homogenate was centrifuged at 12,000 rpm for 30 min, and the supernatant was transferred to new tubes. The supernatant was also lysed with M-Per buffer (Thermo Fisher Scientific) and sonicated. The buffer was added in excess to obtain the clearest solution possible. Proteins (100 µg) were precipitated using chloroform/methanol protocol. The protein pellets of each sample were solubilized in 100 µL of 100 mM TEAB, 8 M urea, 5 µL of TCEP mM, sonicated and alkylated with 5 µL of MMTS for 30 min with sonication. The protein mixture was digested with a mixture of proteases LysC/Trypsin (Promega V5073, Madison, WI, USA) in 8 M urea and 100 mM TEAB, added in 1:50 ratio (enzyme:proteins). After 4 h of digestion with shaking at 37°C, samples were diluted to achieve a urea concentration of 1 M and digested overnight. The peptide mixture was purified with HL 10 mg cartridges and evaporated to dryness in a rotary evaporator. The pellet was dissolved with 2% acetonitrile in the presence of 0.1% TFA. MS analysis was performed by LC‐MS in the Laboratory of Mass Spectrometry (IBB PAS, Warsaw) using a NanoAcquity UPLC System (Waters) coupled to a QExactive Orbitrap Mass Spectrometer (Thermo Fisher Scientific). The mass spectrometer was operated in the data‐dependent MS2 mode, and data were acquired in the m/z range of 200–2000. Peptides were separated by a 180‐min linear gradient of 95% solution A (0.1% formic acid in water) to 45% solution B (acetonitrile and 0.1% formic acid). Each sample measurement was preceded by three washing runs to avoid cross‐contamination. Data were analysed with the MaxQuant 1.6.1.3 platform, searched against the UniProt human reference proteome downloaded on 01.12.2020, with MMTS as the fixed modification, and oxidation M and acetyl as the variable ones. Heat-maps were performed using GraphPad Prism software version 8.1.2 (GraphPad Software Inc., La Jolla, CA, USA). The protein–protein interaction network was visualized using inBio Discover™.37
Flow Cytometry
Flow cytometry was used for cell cycle analysis. Cells were seeded on uncoated or nfND-coated 6-well plates. After 7 days’ incubation, cells were harvested and washed. All the following steps were performed according to a previous study.10 Briefly, cells were dispersed in 1 mL phosphate buffered saline without Ca2+ and Mg2+, and then the cell suspension was slowly added to 9 mL of ice-cold 70% ethanol. Fixation was performed at −20°C overnight. Cells were washed to remove residual ethanol, and each sample was stained with 500 µL of staining solution at room temperature for 30 min. The staining solution contained RNAse A (2 µL, Thermo Fisher Scientific, Waltham, MA, USA), propidium iodide (PI; 20 µL, Thermo Fisher Scientific, Waltham, MA, USA), Tween 20 (0.5 µL) and PBS (477.5 µL). The final concentration of PI in the staining solution was 20 µg/mL. Cells were analysed by flow cytometry (FACSCalibur, Becton Dickinson, Franklin Lakes, NJ, USA), measuring the fluorescence emission at 530 nm and 575 nm (or equivalent), using excitation at 488 nm.
Statistical Analysis
The data were analysed by t-test using Statgraphics Plus 4.1 (StatPoint Technologies, Warrenton, VA, USA) and Scaffold 4 Q+S software. Different letters (a, b) indicate significant differences between the control and nfND treatments (p ≤ 0.05).
Results
Characterization of Diamond Nanocolloid
The diamond used was fine powder, well dispersed in water. The NDs were rounded and regular, ranging from 2 to 13 nm. However, ND showed a tendency to agglomerate after drying (Figure 1). The zeta potential of the hydrocolloid was 9.5 ± 0.66 mV.
The diamond spectrum consists of five distinct spectral regions containing one to four bands. Starting from the highest wavenumbers, a broad and intense band generated by OH and COOH group stretching was observed. This band with maximum transmission at 3475 cm−1 and the shoulder band located at 1730 cm−1 (C=O stretching) confirmed the presence of at least some oxygen attached to carbon. A series of weak bands at 2959, 2817, 2730 and 2642 cm−1 generated by stretching of C-H bonds together with the previously mentioned band at 3275 cm−1 confirmed the presence of hydrogen. Another series of weak bands generated by C-H bending, ie rocking and wagging as well as C-C and C-O stretching, was present at 1363, 11,250 (C-H), 1185 (C-C) and 1112 (C-O) cm−1. A distinct band located at 1603 cm−1 was generated, most probably by C=C stretching, which was unexpected. Two bands located at 2364 and 2333 cm−1 were due to vibrations of CO2.
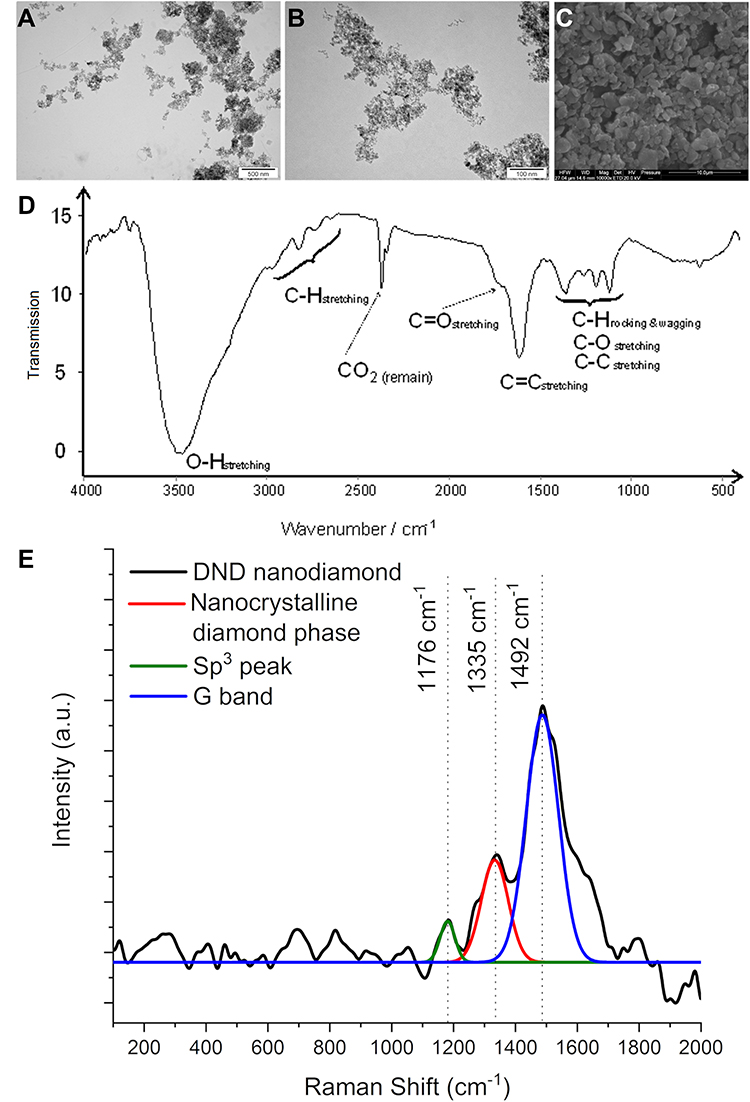 |
Figure 1 Characterization of diamond nanoparticles (ND). Notes: Morphology of ND using scanning electron microscopy (A and B) and transmission electron microscopy (C). Scale bars: 500 nm (A), 100 nm (B) and 10 µm (C). Infrared spectrum of ND registered in the middle region (500–4000 cm-1) (D). Raman spectrum of ND collected at an excitation wavelength of 514 nm (E). |
The Raman spectrum for ND is shown in Figure 1E. Three peaks (1176 cm−1, 1335 cm−1 and 1492 cm−1) were recorded in the Raman spectrum. The weak peak at around 1335 cm−1 is associated with a disorder due to the formation of sp3 bonds.38 A distinct Raman peak around 1140 cm−1 is often taken as a simple criterion for a nanocrystalline diamond phase in diamond films.39 However, the observation that this mode is always accompanied by a mode around 1480 cm−1 (seen around 1490 cm−1 as a shoulder of the G-mode) shows (similar) dispersions, while the diamond mode around 1332 cm−1 does not. As reported several times in the literature,40,41 the two modes around 1140 and 1490 cm−1 not only appear together. The observed spectrum is characteristic of diamond powders with sizes below 5 nm.42,43
Characterization of Diamond Nanofilm
All topography parameters of the ND-coated plate were much higher than those of the plastic plate (Table 1). AFM analysis showed that use of the ND-coated plate increased the average roughness 2-fold from 7.2 nm to 15.3 nm. The average maximum height of the roughness and average maximum roughness valley depth increased approximately 2-fold and were less than 100 nm, which qualifies the multilayer to be called a nanofilm. The AFM profile showed one peak for the control and many peaks for nfND, which is related to the irregular and corrugated ND surface with valleys and peaks (Figure 2).
 |
Table 1 Comparison of the AFM Parameters Between Ordinary Polystyrene Plate and Plate Coated with Diamond Nanofilm (nfND) |
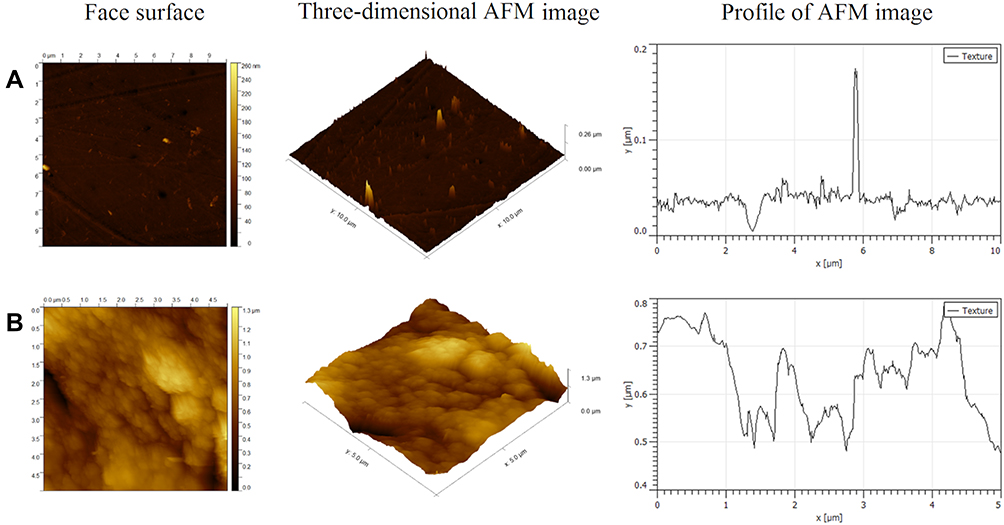 |
Figure 2 Topographical image of polystyrene plate (A); scale bar: 10 µm x 10 µm x 260 nm) and polystyrene plate diamond coated (B); scale bar: 5 µm x 5 µm x 1300 nm). Images present two- and three-dimensional atomic force microscopy images and profiles. |
Analysis of Cell Morphology
HS-5 cells, independent of the treatment group, did not take on a spherical form and grew separately, retaining the natural physiology of connective tissue. In the control group, lamellipodia ended with many tiny filopodia, which was not observed on the modified surface. The morphological picture of non-tumour HS-5 cells after 7 days of incubation on ND nanofilm indicated some morphological changes related to the limited contact of cells with diamond (Figure 3). Cells growing on the nfND were extended and possessed shrunken cell bodies and protrusions extending far beyond the cell body.
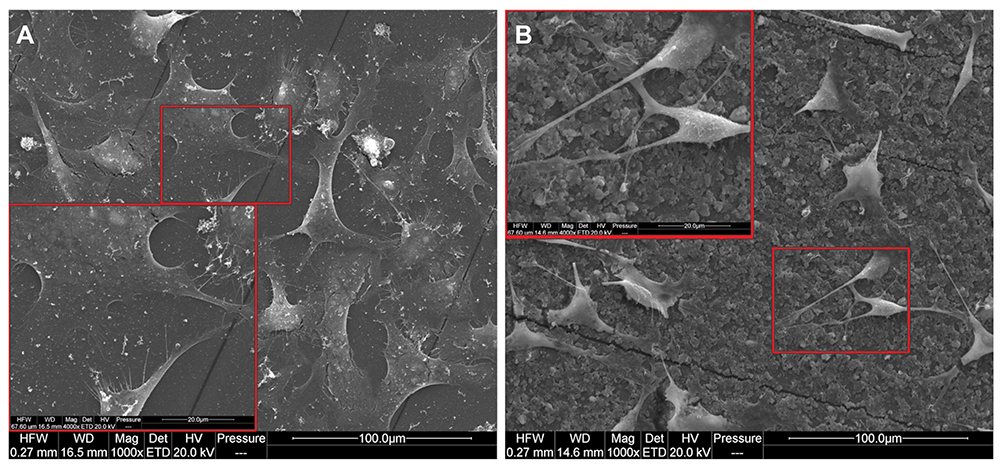 |
Figure 3 HS-5 cell morphology after 7 days of culture. (A) cultured on a standard polystyrene plate, (B) cultured on diamond nanofilm. Notes: Scanning electron microscopy. The larger red frames (scale bar: 20 µm) indicate magnified parts of the main images (marked by smaller red frames, scale bar: 100 µm). |
HepG2 and C3A liver cancer cells formed cell clusters, which were observed in all groups. After 7 days of culture on the nfND, the tumour cell clusters were smaller and more relaxed. Thus, the total number of cells that formed clusters was reduced on the modified surface. Moreover, a large number of single, round (Figure 4) or oval (Figure 5) cells were observed on nfND.
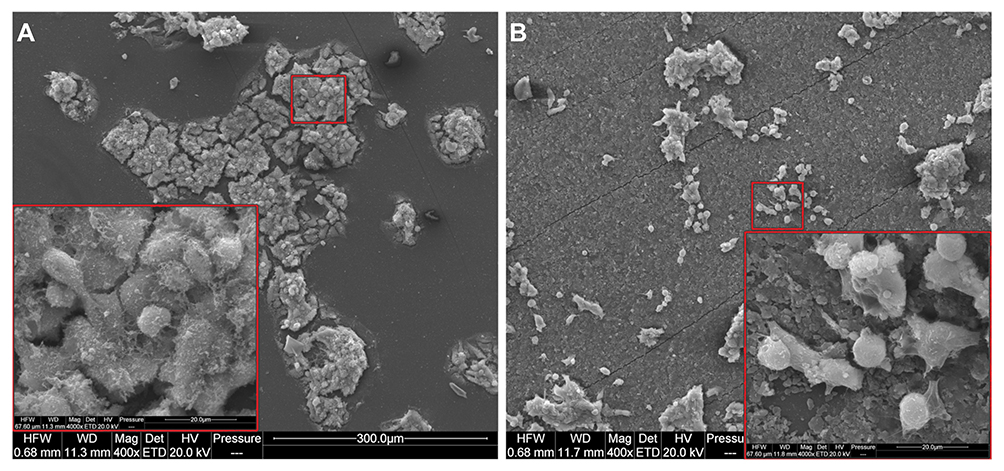 |
Figure 4 HepG2 cell morphology after 7 days of culture. (A) cultured on standard polystyrene plate, (B) cultured on diamond nanofilm. Notes: Scanning electron microscopy. The larger red frames (scale bar: 20 µm) indicate magnified parts of the main images (marked by smaller red frames, scale bar: 300 µm). |
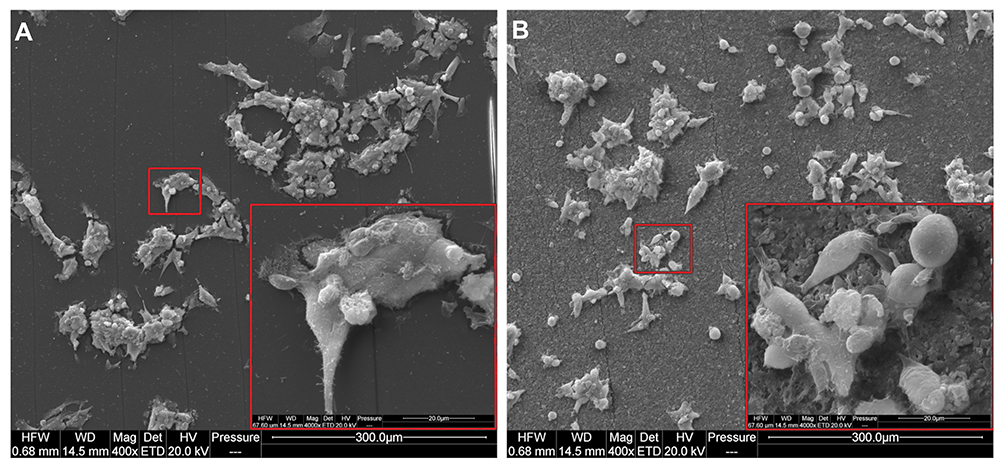 |
Figure 5 C3A cell morphology after 7 days of culture. (A) cultured on standard polystyrene plate, (B) cultured on diamond nanofilm. Notes: Scanning electron microscopy. The larger red frames (scale bar: 20 µm) indicate magnified parts of the main images (marked by smaller red frames, scale bar: 300 µm). |
Evaluation of the Biocompatibility of Diamond Nanofilm
Cell viability was measured by using a test based on the bioreduction of tetrazolium salts to formazan. The nfND, at a concentration of 1000 µg/mL, resulted in cell viabilities of 44.0% ± 12.5 in normal cells and 78.6% ± 8.9 in hepatoma HepG2 cells. C3A cells growing on nfND retained almost their entire metabolic activity (Figure 6 and Figure S1). Hepatocytes, as highly metabolically active and detoxifying cells, were more resistant than bone marrow stromal cells after 24 and 48 h treatment.
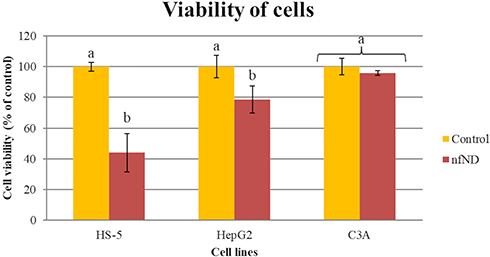 |
Figure 6 Analysis of HS-5, HepG2 and C3A cell viability after 24 h of cultivation on uncoated (control) and diamond-coated plates (nfND) using the XTT assay. Notes: Different letters indicate significant differences control vs nfND (p ≤ 0.05, t-test). |
Similar results were obtained from the second spectrophotometric test, BrdU. Figure 7 shows that nanofilm decreased the proliferation of the HS-5 cell line by almost 2-fold (46% ± 6.2). nfND also slightly reduced the proliferation of HepG2 and C3A cancer cells by less than 20%. These results allowed us to demonstrate the biocompatibility of nfND, particularly for cancer cells, which prompted the use of nanofilm as an ECM mimic in the following experiments.
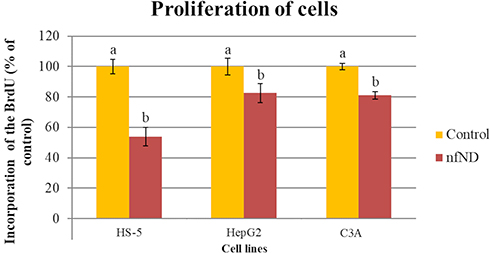 |
Figure 7 Analysis of HS-5, HepG2 and C3A cell proliferation after 48 h of cultivation on uncoated (control) and diamond-coated plates (nfND) using the BrdU test. Notes: Different letters indicate significant differences control vs nfND (p ≤ 0.05, t-test). |
Analysis of Cell Invasion
A wound-healing assay was performed to evaluate the migration and proliferation of cells on the ND-coated plate. HS-5 cells migrated faster than liver cancer cells and almost completely covered the free gap after 72 h. The distance of the wound closure was strongly correlated with the incubation time. Two-dimensional cell migration provided information about inhibition of HS-5 cell invasion on nfND after 6, 12, 24 and 72 h. Single-cell migration was the most inhibited after 24 and 72 h of cultivation on the modified surface (Figure 8).
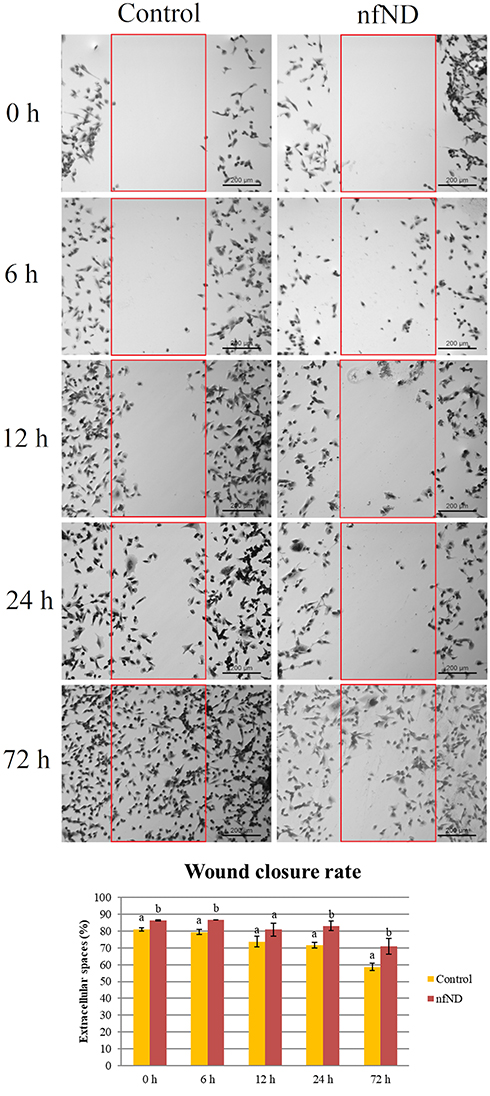 |
Figure 8 Analysis of HS-5 cell invasion and migration after 0, 6, 12, 24 and 72 h of cultivation on a polystyrene plate (control) and a diamond coated polystyrene plate (nfND). Notes: Scratch wound closure assay. The top micrographs: light microscopy. The down micrographs: quantitative data. Different letters indicate significant differences control vs nfND (p ≤ 0.05, t-test). |
The results obtained with the wound-healing assay indicate that the inhibition of collective migration in liver cancer cells was related to the use of nfND. Figure 9 shows that cells grown on nfND exhibited a clear reduction in cell migration. As early as 72 h after the removal of the insert from the plate, the wound width was 82.0 ± 3.2%, while the control cells migrated intensively, reducing the wound width to 66.5 ± 2.3%. After 7 days of growth on nfND, the migration capacity of the HepG2 cells was weakened approximately 2-fold compared with the control.
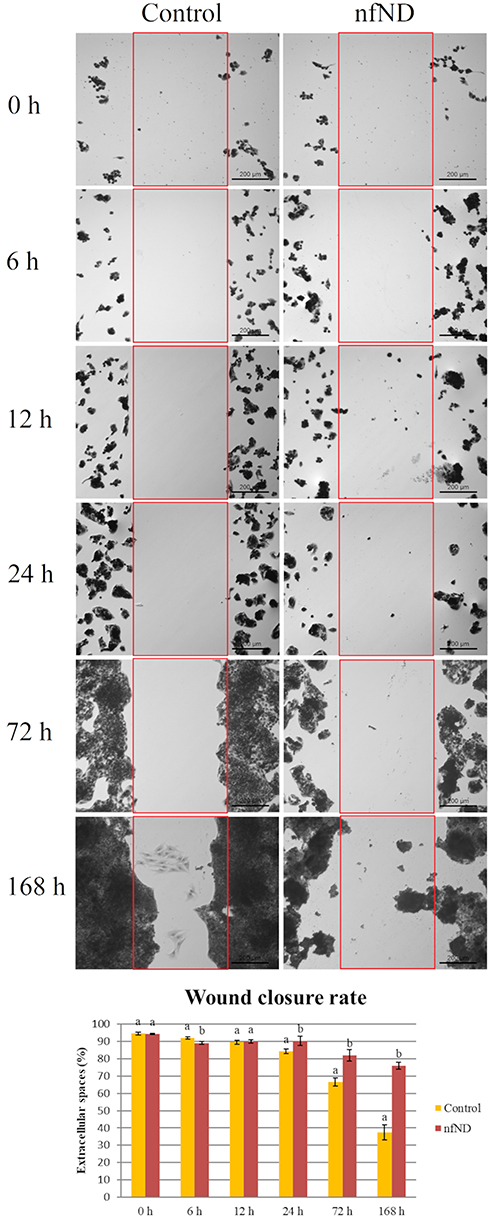 |
Figure 9 Analysis of HepG2 cell invasion and migration after 0, 6, 12, 24, 72 and 168 h of cultivation on polystyrene plate (control) and diamond coated polystyrene plates (nfND). Notes: Scratch wound closure assay. The top micrographs: light microscopy. The bottom micrographs: quantitative data. Different letters indicate significant differences control vs nfND (p ≤ 0.05, t-test). |
Scratch closure progressed in untreated control C3A cells from 6 h (75.9 ± 1.1%) to complete closure after 7 days (25±1.8%). In nfND group, the wound was still open after 7 days’ incubation (Figure 10).
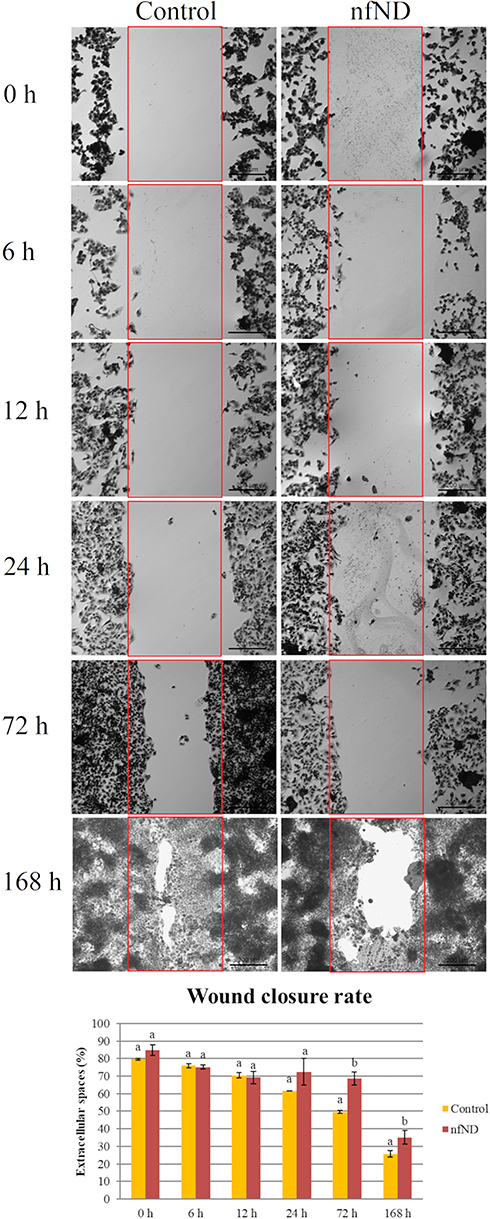 |
Figure 10 Analysis of C3A cell invasion and migration after 0, 6, 12, 24, 72 and 168 h of cultivation on polystyrene plate (control) and diamond coated polystyrene plate (nfND). Notes: Scratch wound closure assay. The top micrographs: light microscopy. The bottom micrographs: quantitative data. Different letters indicate significant differences control vs nfND (p ≤ 0.05, t-test). |
Cell Cycle
To investigate if mechanical induction of cells with diamond would affect the cell cycle phase distribution, flow cytometry was used. As shown in Figure 11, the G2/M peak of HS-5 cells decreased from 25.2 ± 0.7% (control) to 18.5 ± 3.5% (nfND). Simultaneously, an accumulation of cells in the G0/G1 and S phases was observed under the influence of nfND.
Cell growth on nfND caused deregulation of the cell cycle phase distribution in cancer cells. This effect was more relevant in C3A cells than in HepG2 cells. We observed that nfND caused an accumulation of C3A cells in the S and G2/M phases. Seven days after growth on nfND, 71.6 ± 6.4% of the C3A cells were in G1 phase, 5.3 ± 1.7% were in S phase, and 23.1 ± 4.7% were in G2/M phase, compared with control cells, of which 84.9 ± 0.9% were in G1 phase, 3.1 ± 0.3% in S phase and 12.0 ± 1.1% in G2/M phase. Our results indicated that the anti-proliferative effect of nfND is correlated with the accumulation of cancer cells in G2/M phase.
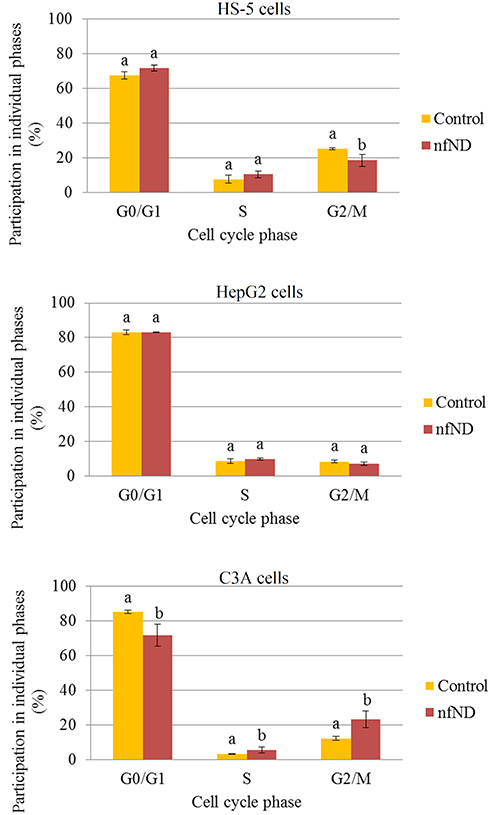 |
Figure 11 Effect of diamond nanofilm (nfND) on the number (percentage) of HS-5, HepG2 and C3A cells in G0/G1, S and G2/M phases after 7 days’ cultivation. Notes: Propidium iodide (PI) 488 assay. Different letters indicate significant differences control vs nfND (p ≤ 0.05, t-test). |
Impact of Diamond on Protein Expression
Mass spectrometry was used to confirm changes in adhesion, migration and the cell cycle. We compared the proteome of cancer cells cultivated on the ordinary plate and diamond-coated plate (t-test), and identified a set of 3798 proteins represented in HepG2 and/or C3A cells.
In HepG2 cells, 3036 proteins were identified in the control group and 2426 in the study group. Of all proteins in HepG2 cells, 189 showed statistically significant changes in expression, and most of them were overexpressed (150) after cultivation on nfND (Figure 12A–C). Next, we performed gene annotation enrichment analysis and observed that cytoplasmic and plasma membrane proteins were the most abundant categories of proteins with altered expression (Figure 12D).
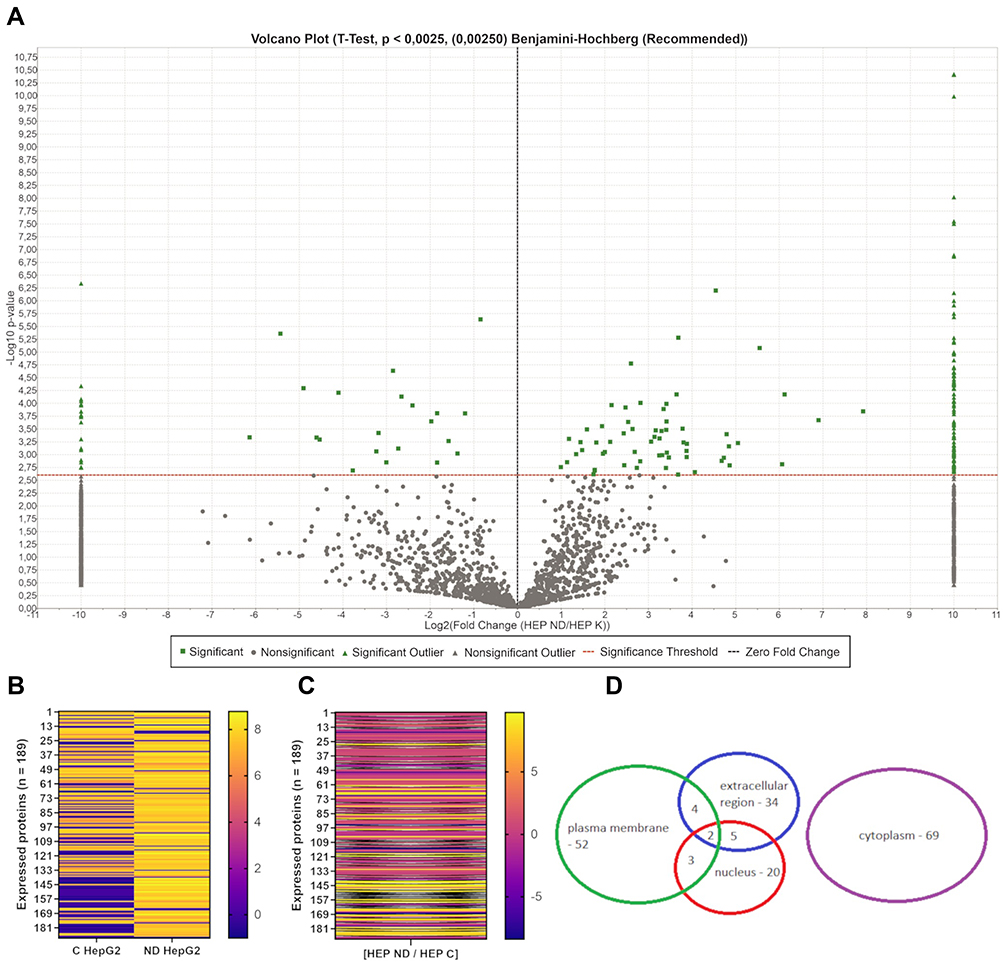 |
Figure 12 Mass spectrometric analysis results identifying changes in intracellular protein expression of HepG2 after culture on nfND. Abbreviation: FC, fold change. Notes: (A) Volcano plot (t-test, p < 0.00250, Benjamini-Hochberg, n = 5 per group) showing the abundance of identified proteins (3798 proteins) on the nfND-coated plate compared with the ordinary plate. The red line defines the cut-off for statistical significance. Proteins with altered expression are depicted in green. Left side: downregulation. Right side: upregulation. (B and C) Heat-map of protein expression identified and quantified by mass spectrometry in proteomic analysis. Heat-map shows proteins with statistically altered expression (n = 189). (B) Each column of the heat-map represents a study group (C – control, nfND) and each row represents a protein with significant differences in expression. The results are presented as log10 values. (C) Each column of heat-map represents a log10FC values, and each row represents proteins with significant differences in expression. The black line defines an infinite change. (D) Data set shows the number of nuclear, membrane, extracellular region and cytoplasmic proteins among all identified up or downregulated proteins. |
Proteome analysis of C3A cells confirmed the results obtained for HepG2 cells regarding the loss of expression of some proteins on nfND. In C3A cells, 3029 proteins were identified in the control group, while in the nfND group only 2158 proteins were identified. Among all identified proteins in C3A cells, the expression of 172 proteins was changed on nanofilm (Figure 13A–C). Moreover, the most numerous groups were cytoplasmic and nuclear proteins (Figure 13D), and most of them (135) were downregulated.
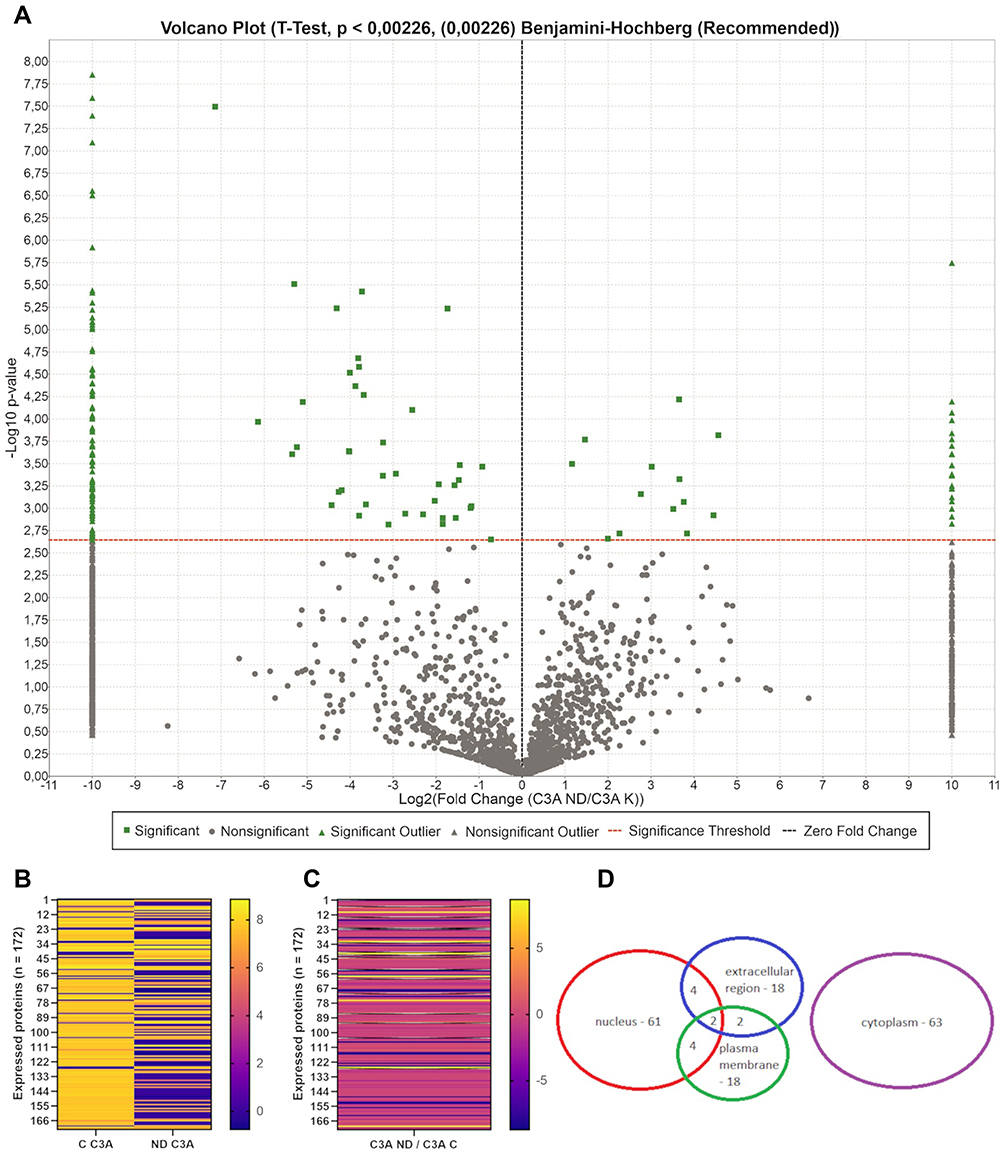 |
Figure 13 Mass spectrometric analysis results identifying changes in intracellular proteins expression of C3A after culture on nfND. Abbreviation: FC, fold change. Notes: (A) Volcano plot (t-test, p < 0.00226, Benjamini-Hochberg, n = 5 per group) showing the abundance of identified proteins (3798 proteins) on an nfND-coated plate compared with an ordinary plate. The red line defines the cut-off for statistical significance. Proteins with altered expression are depicted in green. Left side: downregulation. Right side: upregulation. (B and C) Heat-map of protein expression identified and quantified by mass spectrometry in proteomic analysis. Heat-map shows proteins with statistically altered expression (n = 172). (B) Each column of the heat-map represents a study group (C – control, nfND), and each row represents proteins with significant differences in expression. The results are presented as log10 values. (C) Each column of the heat-map represents log10FC values, and each row represents proteins with significant differences in expression. The black line defines an infinite change. (D) Data set shows the number of nuclear, membrane, extracellular region and cytoplasmic proteins among all identified up or downregulated proteins. |
Proteomic data was used to generate a graphic representation of known protein–protein interactions, the expression of which was significantly changed (top proteins) (Figures 14A and 15A). The networks contained proteins involved in respiratory electron transport, ECM organization, cell-cell communication, the cell cycle, MAPK family signalling cascades, PI3K/AKT signalling in cancer and MTOR signalling (Figures 14B and 15B). The most abundant subnetworks were involved in respiratory electron transport (HepG2) and the cell cycle (C3A). Detailed data are presented in Tables S1 and S2.
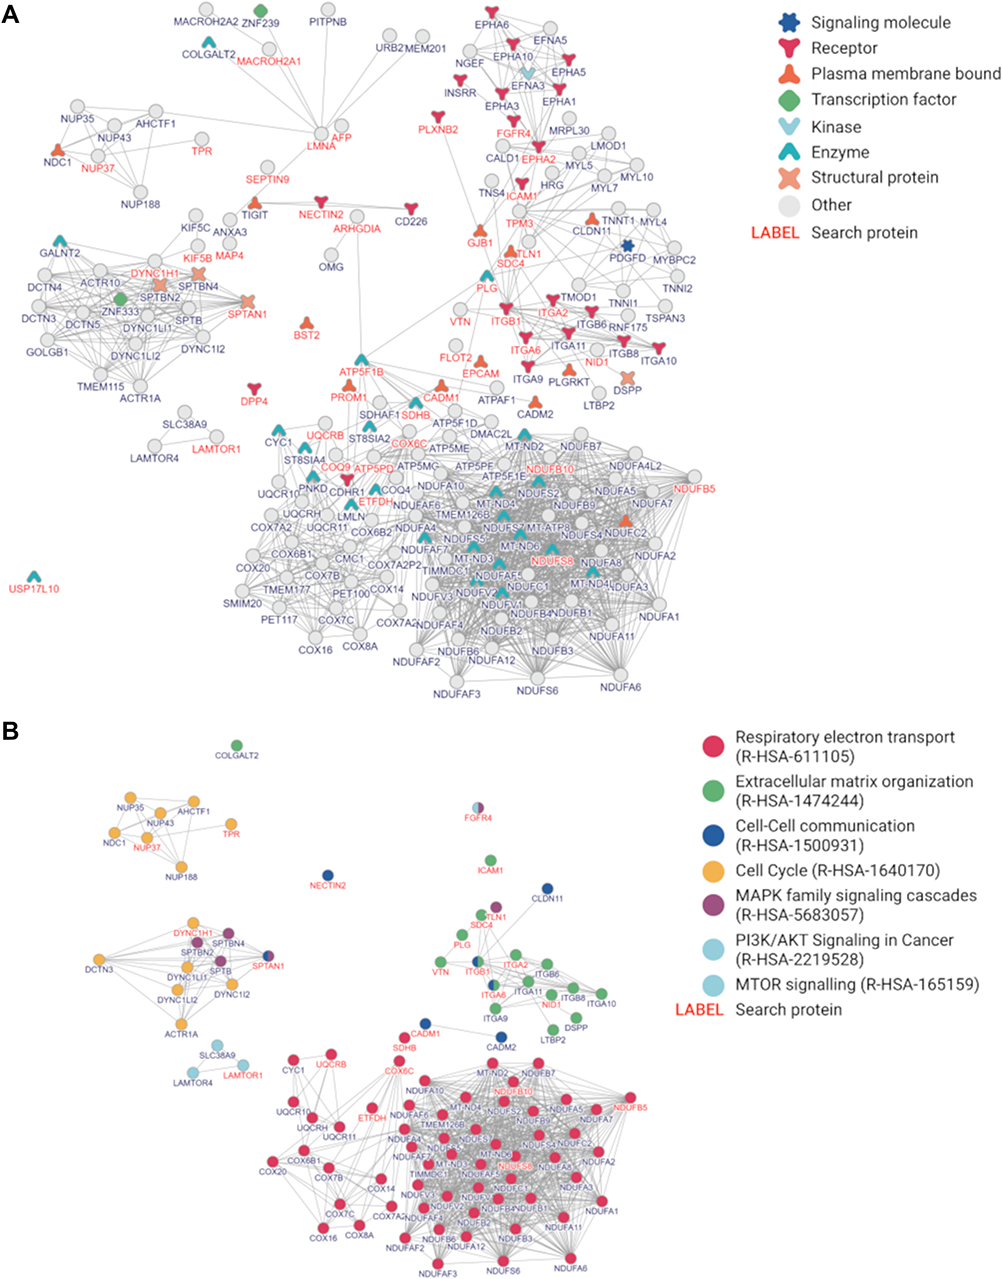 |
Figure 14 The protein–protein interaction network in HepG2 cells. Notes: (A) The top 44 proteins selected from 189 proteins with altered expression after cultivation on nfND. The top 44 proteins are marked in red font and divided into protein types. In the network, neighbouring proteins are marked in black font. (B) Some proteins were enriched with signalling annotations. |
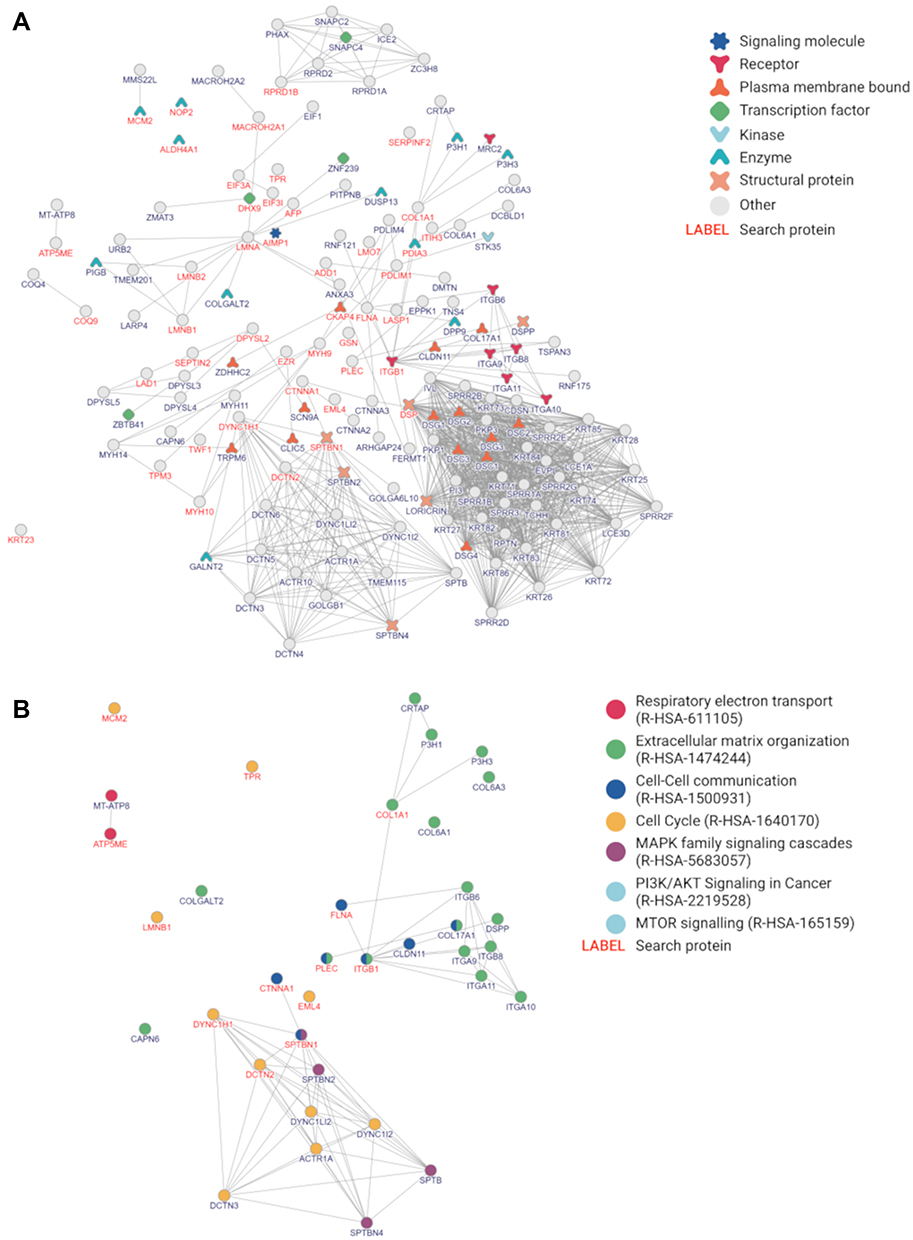 |
Figure 15 The protein–protein interaction network in C3A cells. Notes: (A) The top 44 proteins selected from 172 proteins with altered expression after cultivation on nfND. The top 44 proteins are marked in red font and divided into protein types. In the network, neighbouring proteins are marked in black font. (B) Some proteins were enriched with signalling annotations. |
Discussion
The treatment of cancer by repairing/modelling its environment, especially the ECM, appears promising.44 However, the condition after tumour resection seems particularly critical, where damaged tissue from the tumour environment may promote its recurrence. Therefore, we decided to investigate whether a thin nanodiamond film (created by a simple application by spraying the area after tumour resection) can create a niche—a microenvironment, the mechano-chemical action of which will induce the non-cancerous nature of proliferating cells. We conducted in vitro model studies on liver cancer cells vs normal cells, using standard plastic dishes with a nanofilm made of ND. The animal model could be more appropriate; however, the cellular model also reflects a moment after tumour resection. Tumour resection removes a large part of the tissue but single, scattered, marginal neoplastic cells remain. In our study, these single cells are cells of the HepG2 and C3A lines, ie, cells derived from the primary tumour. The work used the invasion test as a test resembling the moment before resection and the moment after resection. It was previously demonstrated that diamond nanoparticles repeatedly injected into the peritoneal cavity of rats located at the injection site in the form of visible aggregates for 12 weeks but do not cause pathological changes in organs, including the liver.45 It follows that spraying the liver after resection with a diamond colloid will form a thin layer of nanofilm that will persist for a long time at the injection site.
In previous studies, we found that mechanical and chemical stimuli, induced by the graphene surface and the addition of chicken embryo liver extract, change the signalling pathways of HepG2 and C3A liver cancer cells towards reducing the neoplastic potential.11 However, the graphene oxide surface alone did not produce the desired effect. Therefore, the presented research aimed to determine to what extent the modification of the substrate, by creating a nfND and the mechano-chemical signals flowing from it, will “heal” the external environment of the cell and reduce its carcinogenic potential.
In the present research, we created a more delicate, though rough, film by applying ND to the bottom of the culture plate. Our results showed that spherical, very small NDs (2–13 nm), which were suspended in water (0.1% concentration), and then dropped onto the surface of the plate, forming a surface unique in its shape after drying. On the one hand, the surface was varied and rough, and on the other, it was devoid of sharp edges (characteristic of graphene oxide) because it was made of rounded ND. In vivo, ECM components also form a nano-patterned mosaic.46
An essential feature of the mechano-chemical interaction at the surface is the hybridization of carbon orbitals and the number of defects occurring in the layers.47 Graphene oxide has the advantage of sp2 orbitals, and diamond sp3.11,48 The nano-diamond used in our experiments had a sp3/sp2 orbitals ratio of 0.34. Thus, the uniqueness of the surface created by ND was the formation of a kind of mosaic of domains rich in sp3 hybridization (the greater part) and domains also containing sp2 bonds. Thus, the obtained structure was varied in terms of roughness and activity due to functional groups exposed to the surface of the formed nfND.49
In this study, it was shown that the nfND was the source of oxygen, hydroxyl and carboxyl groups that were not present on a regular polystyrene plate, as found in previous experiments.10 Chen et al20 and Chong et al50 reported that the surface oxygen groups available on the diamond surface are the binding sites for laminin and fibronectin while acting as a proadhesive motif for integrin. In addition, the presence of oxygen groups increases the hydrophilicity of the diamond layer, which is associated with its high biocompatibility.23–28 Cells adhere preferentially to diamond’s oxygen domains compared with hydrogen-exposing sites. Moreover, oxygen-exposed diamond supports the formation of ECM.27 Another important feature of the nfND is its positive charge (zeta potential), imitating the charge of ECM components, such as nidogen and perlecan.51 In conclusion, it can be expected that the physicochemical features of nfND should be compatible with the cells that inhabit them.
The cell is a micrometric structure, but the protein apparatus that determines all its functions is organized at the nanometric level. The variety of the nfND surface on a nanometric scale corresponds to the perception of cell receptors. The analysis of a wide range of proteins with altered expression under the influence of a surface change (nfND) allowed us to monitor changes in the structure, function or metabolism of the cell and to determine the observed mechanisms.
From a physical point of view, the roughness of the surface is decisive for cell adhesion.52 Integrin receptors are the nano-structure of the cell—the link between the ECM and the cell and the source of the signalling cascade that determines the ultimate behaviour of the cell. The integrin family is made up of 18 α and 8 β subunits linked into 24 different heterodimers. Our study found that culturing liver cancer cells in a diamond niche increased the expression of the β1 subunit—the one most commonly found in heterodimers.53 High expression of one subunit causes a change at the level of the entire dimer.54 Thus, a change in the expression of the β1 subunit could affect the recognition and signal transduction of collagen (α1β1, α2β1, α10β1 and α11β1), fibronectin (α5β1, αVβ1, α4β1 and α9β1), vitronectin (α8β1) and laminin (α3β1 and α7β1).55 Thus, nfND could effectively mimic the characteristics of the listed components of the natural ECM. However, an increase in β1 integrin expression is associated with a worse prognosis in lung, breast and liver cancers.56 On the other hand, recent studies report the key role of β1 integrin in shaping the liver microstructure and regulating the secretion of transforming growth factor β.57 Moreover, the complete loss of β1 integrin expression is associated with impaired liver regeneration and liver necrosis and severely impairs hepatocyte proliferation.58 The cytoplasmic domain of integrin β1 binds to filamin A,59 which competes for the binding site with talin and is an integrin inactivator.60 Diamond nanofilm decreased filamin expression. It can be assumed that this was related to the increase in β1 integrin expression observed by us. This mechanism could be the first step towards the normalization of ECM-cell communication observed in healthy liver tissue.61
The nanodiamond niche reduced the expression of major proteins involved in intercellular junctions, such as desmoplakin and α-catenin. Desmoplakin is an important component of desmosomal plaques, and downregulation of desmoplakin is associated with activation of Wnt/β-catenin signalling and the epithelial-mesenchymal (EMT) transition.62,63 Thus, signalling from the nfND weakened the keratin-desmosomal junctions and the E-cadherin-α catenin junctions and finally relaxed the C3A lineage intercellular junctions. This phenomenon was confirmed by the observation of cell morphology in SEM, where many more individual cells than clusters could be seen on the nanofilm surface.
The process of adhesion and migration is based on repeated cycles of stretching and contracting cells and is made possible by actin and myosin, as well as polymerization and depolymerization processes. In our study, an increase in the expression of the actin-depolymerizing factor protein was observed, which means that the pool of actin monomers for the reassembly of cytoskeleton filaments was larger. Moreover, it can be assumed that this conferred protection against the accumulation of abnormal F-actin structures.64 In general, however, the surface of the diamond lowered the expression of most cytoskeletal proteins, and as found in most types of cancer, including liver cancer, the levels of proteins involved in actin remodelling were elevated.65–67 The expression of non-muscle myosin (MYH9)—a motor protein involved in HCC cell motility and cytokinesis—was reduced, which, according to Lin et al,68 is a positive prognostic of treatment. Diamond nanofilm also decreased the expression of actin-binding proteins, ie TWF1 (twinfilin 1), ezrin and LIM domain only protein 7. The decrease in TWF1 expression is associated with increased effectiveness of chemotherapy and inhibition of the growth of pancreatic cancer and lung adenocarcinoma.69,70 Moreover, the decrease in the amount of TWF1 in the cell is accompanied by a reduction in the size of the tumour, as well as the acquisition of the characteristics of the epithelial (static) phenotype.70 TWF1, as well as esrin, shape cell polarity and are involved in cell–ECM adhesion. According to some authors, a decrease in ezrin expression results in inhibition of cell invasiveness.71
We observed that nfND decreased the expression of proteins with the LIM domain, proteins with the LIM and PDZ domains and septins, which can be associated with the slowing down of cytoskeletal reorganization and protein–protein interactions.66,72 Moreover, HCC is characterized by collective, rather than single, cell migration, which is caused by the cytoskeleton linker plectin.73 The reduction in plectin expression, observed under the influence of nfND, could be associated with a reduction in the tendency toward migration, especially collective migration. Plectin is also considered to be a factor promoting the migration and invasiveness of cancer cells.74 Undoubtedly, the reduction of plectin expression proves that the nanodiamond niche plane induces changes in the behaviour of the cell towards reducing its neoplastic character. Furthermore, the invasiveness test (wound healing), as well as the visualization of cells under an electron microscope, confirmed that nfND does not promote migration of liver cancer cells. These results confirm the observations of Guo et al75 that diamond-derived mechanical-chemical stimuli induce a change in the expression of proteins responsible for arranging the cytoskeleton, increase adhesion and inhibit migration of liver cancer cells.
The signal from the cytoskeleton is in effect transferred to the envelope and the nuclear lamina. The nuclear lamina is formed by type A and B lamins and prelamin-A/C, which control the mechanical properties and integrity of the cell nucleus and chromatin organization.76 In our experiment, a signal from a nanodiamond niche reduced the expression of four proteins involved in the organization of nuclear pore complexes; lamins B1 and B2, nucleoproteins TPR and prelamin-A/C in C3A cells. In the context of the studies by Lim et al,77 this result shows that high expression of lamin B as a prognostic indicator of liver cirrhosis and cancer can be considered very promising. Moreover, in many cancers, the high content of lamin-A/C generates a predisposition to the generation of distant lung metastases.78 Thus, mechano-chemical stimulation induced by nfND probably beneficially modified nuclear transport by changing the density and distribution of nuclear pores.76
Ultimately, the diamond signal was transduced to the nucleoplasm, leading, in C3A cells, to a reduction in the expression of the core histone macro-H2A1 protein, indicating an optimization of chromatin packing. Complete silencing of macro-H2A1 may turn liver cancer cells into stem cells.79
Diamond nanofilm also reduced the expression of all other significantly altered proteins in C3A cells responsible for the cell cycle and proliferation, such as DNA replication licensing factor MCM2, probable 28S rRNA (cytosine (4447)-C (5))-methyltransferase, regulation of nuclear pre-mRNA domain-containing protein 1B and ATP-dependent RNA helicase A. Analysis of the cell cycle results obtained by flow cytometry determined that the C3A cell population in the G0/G1 phase decreased, and in the S and G2/M phase it increased due to contact with the nanofilm diamond. Thus, the population of cells entering pre-division—the G1 phase—decreased, which undoubtedly means a decrease in the proliferation rate of C3A cells and correlates with the results of the BrdU proliferation assay. The reduction in the number of cells in the G0/G1 phase should be associated with altered expression of proteins that make up the G1 signalling network, which coordinate cell growth, proliferation and survival and, above all, play the role of key markers in the discovery of the causes of cancer and the development of therapeutic strategies.80 Proteomic studies confirmed our hypothesis and showed a reduction in the expression of all significantly altered proteins involved in proliferation and the cell cycle under the influence of nfND. We also observed a decreased expression level of MCM2, the protein responsible for the initiation of replication under the influence of GO nanofilm in previous studies.11 Moreover, reduced levels of MCM2 and DHX9 helicases and NOP2 methyltransferases inhibit the conversion of liver cirrhosis to HCC81 as well as the development of lung cancer82 and prostate cancer.83 An important tumour marker and cell cycle regulator dependent on cyclin D1 was the protein RPRD1B,84 the expression of which was also reduced by the presence of nfND. The expression of other proteins related to mitosis and proliferation activity was also decreased DYNC1H1, EML4 and DCTN2. These studies clearly showed that the nfND, which is the source of the mechano-chemical signal, reduces the proliferation of C3A liver cancer cells, reducing the intensity of entry into the G1 phase as a result of modified signalling via integrins, the cytoskeleton and the cell nucleus.
Analysing the results of the XTT test, we found that the diamond surface did not reduce the metabolic activity of C3A cells, despite the reduced proliferation of these cells (BrdU test). Proliferation is closely related to an increase in cell biomass, and mutations regulate metabolic pathways in genes involved in proliferation (eg, p53, PI3K-mTOR, MAPK).85 This two-way regulation makes the G1 phase of the cell cycle dependent on glycolysis, while in the G2 phase, normal cells derive energy from oxidative phosphorylation.86 Thus, metabolism is also an indicator of the neoplastic status of a cell, the effectiveness of therapy and cancer development prognosis. In the presented studies, we observed an increase in COQ9 expression, responsible for the transfer of electrons from NADH to ubiquinone in the mitochondrial respiratory chain, as well as ATP5ME, which determines the transport of protons across the mitochondrial membrane to produce an electrochemical gradient that synthesizes ATP.87,88 Upregulation of ATP synthase in various types of cancer is the key to lowering their proliferation and drug resistance.87 The last and decisive evidence for the normalization of cell metabolism was the decrease in the expression of delta-1- pyrroline-5-carboxylate dehydrogenase (ALDH4) on nfND. ALDH is a mitochondrial matrix enzyme that catalyses the conversion of proline into L-glutamate, an important source of energy for the cancer cell. Its increased level is observed in HCC.89 It can be assumed that the availability of oxygen containing groups from the diamond niche could also favour oxygen transformation in the mitochondria, which could prevent acidification and hypoxia, but this requires further research.
Another question, important from the point of view of the possibility of rebuilding by proliferating cells of the optimal (non-cancerous) cell matrix, built on a nfND niche, concerns the potential formation of ECM. Proteomic analysis allowed us to determine changes in the expression of proteins secreted by cells under the influence of nfND in order to reorganize the ECM. The nfND induced an increase in the expression of several proteins involved in ECM structure: type I collagen, alpha-2-antiplasmin, H3 heavy chain inter-alpha-trypsin inhibitor and alpha-fetoprotein. Elevated levels of type I collagen are observed in liver fibrosis and cancer.90 However, in de novo ECM synthesis, the correct synthesis of type I collagen determines fibre organization, particularly the size and arrangement of collagen fibrils within an ECM. Moreover, its synthesis may reduce cell proliferation, which was observed in our study, as well as in the works of and Lee and Desai (2016).91 An interesting result concerned the increase of SERPINF2 expression under the influence of nfND. Tumour tissues are deficient in antiplasmin and therefore resemble non-healing wounds with excessive fibrinolysis and haemostatic plugs.53,92 The nfND enhanced the production of antiplasmin and the serine protease inhibitor ITIH4, which were deficient in HCC, breast, colon and lung cancers.92–94 Upregulation of ITIH4 probably stabilized the newly formed diamond mimic liver ECM by covalent bonding to hyaluronan and increased cell adhesion to such a surface.94
From an analysis of the interaction of C3A liver cancer cells with nfND, it can be concluded that a therapy supporting liver tumour resection, by filling the resulting postoperative niche with nfND, can induce a mechanochemical signal favouring the colonization of this area by cells with a reduced tumour potential. Diamond nanoparticles can get to the tumour site by a simple method based on spraying or washing the postoperative cavity. In this way, they will form a thin, static layer. Our idea is not to couple nanoparticles with antibodies that precisely target malignant tumour cells,95 but to create a kind of artificial, immobile ECM in the form of a thin nanofilm. The mechanism based on coating the inner walls of the resection cavity has already been used in the context of glioblastoma. Superparamagnetic iron oxide nanoparticles induced hyperthermia upon application of an alternating magnetic field. Thus, there is growing interest in local tumour ablation methods based on a strong immune response96 or as in our work anti-proliferative therapy.
The results obtained in the experiments with HepG2 cells are surprising and indicate completely different mechanisms of interaction between nfND and neoplastic cells. Cells of the C3A line are clonal derivatives of HepG2 (ATTC). Overall, HepG2 cells produce less albumin and AFP and show lower cytochrome P-450 activity than C3A cells.97 In addition, HepG2 cells exhibit 3-hydroxy-3- methylglutaryl-CoA reductase and hepatic triglyceride lipase (ATCC) activities.
A key difference in HepG2 vs C3A concerned the cell cycle. The cultivation of HepG2 cells on nfND did not change the phase of the cell cycle; moreover, proteomic analysis confirmed this unfavourable result. The diamond surface stimulated the overexpression of several potential oncogenes, such as NUP37, USP17L10, PROM1, MACROH2A1 and LAMTOR1.79,98–101Overexpression of the nuclear pore structural protein NUP37 in the context of research by Luo et al98 indicates growth promotion of HepG2 cancer cells by altering signal transduction to the nucleus. Studies on another protein, USP17, have shown that deubiquitination with its participation is a process necessary for the progression of the cell cycle and the G1/S phase transition of cancer cells.99 Moreover, overexpression of the LAMTOR (p18) protein is required for the activation of mTORC1 on lysosomes and promotes cell proliferation.101 Another example that may contradict the use of nfND in therapy is the decreased expression of the protein responsible for SEPT9 cytokinesis. According to Oussalah et al,102 disruption of SEPT9 expression as a potential tumour suppressor results in incomplete cell division and is a biomarker of liver cirrhosis and HCC.
An interesting result is the increased expression of most respiratory-chain proteins in HepG2 cells under the influence of nfND; NADH dehydrogenase (NDUFS8, NDUFB10, NDUFB5), succinate dehydrogenase (SDHB), cytochrome bc1 complex (COX6C, UQCRB) and ATP synthase (ATP5PD, ATP5F1B). Undoubtedly, the nfND, which has many oxygen groups on the surface, could induce a change in metabolism to a more oxidative one. Intensive oxygen metabolism could affect the production of reactive oxygen species; however, proteomic analysis showed no changes in the expression of antioxidant enzymes, such as superoxide dismutase, glutathione reductase and glutathione peroxidase.103
Although the nfND modified metabolism towards oxidative phosphorylation, this was not confirmed by a change in the cell cycle phase. However, decreased proliferation (BrdU test) and decreased migration and invasiveness were observed in the scratch test. Moreover, HepG2 cells grown in nfND displayed increased expression of many cell receptors (ITGβ1, ITGα6, ITGα2, EPHA2, Nectin2, ICAM1, PLXNB2, FGFR4 and DPP4) in contrast to C3A cells. This could indicate signalling changes in many signalling pathways, including MAPK and mTOR. The signal from ITGβ1 reduced the expression of talin, an important link between the membrane and the cytoskeleton. The consequent low level of talin could be associated with reduced migration and enhanced adhesion, which could indicate a reduction in the metastatic tendency.104 Another piece of evidence of decreased cell invasion was an increase in the expression of the basement membrane component, nidogen (NID1). The integrity of the basement membrane is the key to inhibiting metastasis and correcting cell polarity.105,106 An interesting, positive manifestation of nfND activity was the induction of syndecan (ECM proteoglycan) expression, which was not observed in the HepG2 control group. Normal, non-cancerous hepatocytes are characterized by the presence of syndecan, which silences MAPK signalling (TLN1, SPTAN1).107
To summarize, it should be stated that the nfND did not unambiguously affect the behaviour of HepG2 cells, on the one hand, its pro-tumour potential can be presumed; however, strong activation of oxidative phosphorylation and reduced migration of these cells may indicate the continuation of research with some modifications to the nfND.
Conclusion
The research presented herein showed the therapeutic possibilities of an nfND, created by applying a colloidal solution of ND to the site of liver tumour resection. On the other hand, experiments have documented that the response of liver tumour cells to mechanochemical stimuli is highly individual and can be differentiated even for relatively similar cells like HepG2 and its C3A clones. Undoubtedly, however, the interaction between the nfND and the population of C3A liver cancer cells caused a decrease in the rate of proliferation, including collective proliferation, an increase in adhesion, activation of ATP synthesis, and above all, a decrease in the population of C3A cells entering the cell cycle proliferation phase.
Acknowledgments
This report is a part of Malwina Sosnowska’s PhD thesis.
Funding
This research was carried out in the framework of project National Science Centre Poland nr. 2019/33/N/NZ7/01392.
Disclosure
The authors report no conflicts of interest in this work.
References
1. Singal AG, Lampertico P, Nahon P. Epidemiology and surveillance for hepatocellular carcinoma: new trends. J Hepatol. 2020;72(2):250–261. doi:10.1016/j.jhep.2019.08.025
2. Marin JJG, Macias RIR, Monte MJ, et al. Molecular bases of drug resistance in hepatocellular carcinoma. Cancers. 2020;12(6):1663. doi:10.3390/cancers12061663
3. Neureiter D, Stintzing S, Kiesslich T, Ocker M. Hepatocellular carcinoma: therapeutic advances in signaling, epigenetic and immune targets. World J Gastroenterol. 2019;25(25):3136–3150. doi:10.3748/wjg.v25.i25.3136
4. Pasini F, Serenari M, Cucchetti A, Ercolani G. Treatment options for recurrence of hepatocellular carcinoma after surgical resection: review of the literature and current recommendations for management. Hepatoma Res. 2020;6:26. doi:10.20517/2394-5079.2019.47
5. Tabrizian P, Jibara G, Shrager B, Schwartz M, Roayaie S. Recurrence of hepatocellular cancer after resection: patterns, treatments, and prognosis. Ann Surg. 2015;261:947–955. doi:10.1097/SLA.0000000000000710
6. Hernandez-Gea V, Toffanin S, Friedman SL, Llovet JM. Role of the microenvironment in the pathogenesis and treatment of hepatocellular carcinoma. Gastroenterology. 2013;144(3):512–527. doi:10.1053/j.gastro.2013.01.002
7. Salim MS, Issa AM, Farrag ARH, Gabr H. Decellularized liver bioscaffold: a histological and immunohistochemical comparison between normal, fibrotic and hepatocellular carcinoma. Clin Exp Hepatol. 2019;5(1):35–47. doi:10.5114/ceh.2019.83155
8. Xu S, Xu H, Wang W, et al. The role of collagen in cancer: from bench to bedside. J Transl Med. 2019;17(1):1–22. doi:10.1186/s12967-019-2058-1
9. Saneyasu T, Akhtar R, Sakai T. Molecular cues guiding matrix stiffness in liver fibrosis. Biomed Res Int. 2016;2646212. doi:10.1155/2016/2646212
10. Sosnowska M, Kutwin M, Jaworski S, et al. Mechano-signalling, induced by fullerene C60 nanofilms, arrests the cell cycle in the G2/M phase and decreases proliferation of liver cancer cells. Int J Nanomed. 2019;14:6197. doi:10.2147/IJN.S206934
11. Sosnowska M, Kutwin M, Strojny B, et al. Graphene oxide nanofilm and chicken embryo extract decrease the invasiveness of HepG2 liver cancer cells. Cancer Nanotechnol. 2021;12(1):1–33. doi:10.1186/s12645-020-00073-5
12. Refolo MG, Messa C, Guerra V, Carr BI, D’Alessandro R. Inflammatory mechanisms of HCC development. Cancers. 2020;12(3):641. doi:10.3390/cancers12030641
13. Deegan DB, Zimmerman C, Skardal A, Atala A, Shupe TD. Stiffness of hyaluronic acid gels containing liver extracellular matrix supports human hepatocyte function and alters cell morphology. J Mech Behav Biomed. 2016;55:87–103. doi:10.1016/j.jmbbm.2015.10.016
14. Lodes MA, Kachold FS, Rosiwal SM. Mechanical properties of micro- and nanocrystalline diamond foils. Philos T R Soc A. 2015;373(2038):20140136. doi:10.1098/rsta.2014.0136
15. Neburkova J, Vavra J, Cigler P. Coating nanodiamonds with biocompatible shells for applications in biology and medicine. Curr Opin Solid State Mater Sci. 2017;21(1):43–53. doi:10.1016/j.cossms.2016.05.008
16. Funda G, Taschieri S, Bruno GA, et al. Nanotechnology scaffolds for alveolar bone regeneration. Materials. 2020;13(1):201. doi:10.3390/ma13010201
17. Jain E, Damania A, Kumar A. Biomaterials for liver tissue engineering. Hepatol Int. 2014;8(2):185–197. doi:10.1007/s12072-013-9503-7
18. Pereira FAS, Salles GN, Rodrigues BVM, Marciano FR, Pacheco-Soares C, Lobo AO. Diamond nanoparticles into poly (lactic acid) electrospun fibers: cytocompatible and bioactive scaffolds with enhanced wettability and cell adhesion. Mater Lett. 2016;183:420–424. doi:10.1016/j.matlet.2016.07.146
19. Turner R, Lozoya O, Wang Y, et al. Human hepatic stem cell and maturational liver lineage biology. Hepatology. 2011;53(3):1035–1045. doi:10.1002/hep.24157
20. Chen Y-C, Lee D-C, Tsai T-Y, et al. Induction and regulation of differentiation in neural stem cells on ultra-nanocrystalline diamond films. Biomaterials. 2010;31(21):5575–5587. doi:10.1016/j.biomaterials.2010.03.061
21. Tian Y, Liu H, Sheldon BW, et al. Surface energy-mediated fibronectin adsorption and osteoblast responses on nanostructured diamond. J Mater Sci Technol. 2019;35(5):817–823. doi:10.1016/j.jmst.2018.11.009
22. Lechleitner T, Klauser F, Seppi T, et al. The surface properties of nanocrystalline diamond and nanoparticulate diamond powder and their suitability as cell growth support surfaces. Biomaterials. 2008;29(32):4275–4284. doi:10.1016/j.biomaterials.2008.07.023
23. Vaijayanthimala V, Tzeng YK, Chang HC, Li CL. The biocompatibility of fluorescent nanodiamonds and their mechanism of cellular uptake. Nanotechnology. 2009;20(42):425103. doi:10.1088/0957-4484/20/42/425103
24. van der Laan K, Hasani M, Zheng T, Schirhagl R. Nanodiamonds for in vivo applications. Small. 2018;14(19):1703838. doi:10.1002/smll.201703838
25. Yang L, Sheldon BW, Webster TJ. The impact of diamond nanocrystallinity on osteoblast functions. Biomaterials. 2009;30(20):3458–3465. doi:10.1016/j.biomaterials.2009.03.014
26. Shi B, Chen L, Auciello O, Auciello O. Fundamentals of ultrananocrystalline diamond (UNCD) thin films as biomaterials for developmental biology: embryonic fibroblasts growth on the surface of (UNCD) films. Diam Relat Mater. 2009;18(2–3):596–600. doi:10.1016/j.diamond.2008.09.016
27. Nistor PA, May PW. Diamond thin films: giving biomedical applications a new shine. J R Soc Interface. 2017;14(134):20170382. doi:10.1098/rsif.2017.0382
28. Lin YC, Tsai LW, Perevedentseva E, Chang HH, Lin CH, Sun DS. The influence of nanodiamond on the oxygenation states and micro rheological properties of human red blood cells in vitro. J Biomed Opt. 2012;17(10):101512. doi:10.1117/1.JBO.17.10.101512
29. Zakrzewska KE, Samluk A, Wierzbicki M, et al. Analysis of the cytotoxicity of carbon-based nanoparticles, diamond and graphite, in human glioblastoma and hepatoma cell lines. PLoS One. 2015;10(3):e0122579. doi:10.1371/journal.pone.0122579
30. Grodzik M, Sawosz F, Sawosz E, et al. Nano-nutrition of chicken embryos. The effect of in ovo administration of diamond nanoparticles and l-glutamine on molecular responses in chicken embryo pectoral muscles. Int J Mol Sci. 2013;14(11):23033–23044. doi:10.3390/ijms141123033
31. Kurantowicz N, Strojny B, Sawosz E, et al. Biodistribution of a high dose of diamond, graphite, and graphene oxide nanoparticles after multiple intraperitoneal injections in rats. Nanoscale Res Lett. 2015;10:398. doi:10.1186/s11671-015-1107-9
32. Adach K, Fijalkowski M, Gajek G, Skolimowski J, Kontek R, Blaszczyk A. Studies on the cytotoxicity of diamond nanoparticles against human cancer cells and lymphocytes. Chem Biol Interact. 2016;254:156–166. doi:10.1016/j.cbi.2016.06.004
33. Wierzbicki M, Jaworski S, Kutwin M, et al. Diamond, graphite, and graphene oxide nanoparticles decrease migration and invasiveness in glioblastoma cell lines by impairing extracellular adhesion. Int J Nanomed. 2017;12:7241–7254. doi:10.2147/IJN.S146193
34. Nicolas J, Magli S, Rabbachin L, Sampaolesi S, Nicotra F, Russo L. 3D extracellular matrix mimics: fundamental concepts and role of materials chemistry to influence stem cell fate. Biomacromolecules. 2020;21(6):1968–1994. doi:10.1021/acs.biomac.0c00045
35. Grausova L, Bacakova L, Kromka A, et al. Nanodiamond as promising material for bone tissue engineering. J Nanosci Nanotechnol. 2009;9(6):3524–3534. doi:10.1166/jnn.2009.NS26
36. Thalhammer A, Edgington RJ, Cingolani LA, Schoepfer R, Jackman RB. The use of nanodiamond monolayer coatings to promote the formation of functional neuronal networks. Biomaterials. 2010;31(8):2097–2104. doi:10.1016/j.biomaterials.2009.11.109
37. Li T, Wernersson R, Hansen RB, et al. A scored human protein-protein interaction network to catalyze genomic interpretation. Nat Methods. 2017;14(1):61–64. doi:10.1038/nmeth.4083
38. Ficek M, Sobaszek M, Gnyba M, et al. Optical and electrical properties of boron doped diamond thin conductive films deposited on fused silica glass substrates. Appl Surf Sci. 2016;387:846–856. doi:10.1016/j.apsusc.2016.06.165
39. Kuzmany H, Pfeiffer R, Salk N, Günther B. The mystery of the 1140 cm− 1 Raman line in nanocrystalline diamond films. Carbon. 2004;42(5–6):911–917. doi:10.1016/j.carbon.2003.12.045
40. Ferrari AC, Robertson J. Origin of the 1150− cm− 1 Raman mode in nanocrystalline diamond. Phys Rev B. 2001;63(12):121405. doi:10.1103/PhysRevB.63.121405
41. Marcus B, Fayette L, Mermoux M, Abello L, Lucazeau G. Analysis of the structure of multi‐component carbon films by resonant Raman scattering. J Appl Phys. 1994;76(6):3463–3470. doi:10.1063/1.357476
42. Mitura K, Jedrzejewska-Szczerska M, Ceynowa P, et al. Haemocompatibility of non-functionalized and plasmachemical functionalized detonation nanodiamond particles. Arch Metall Mater. 2015;60:2183–2189. doi:10.1515/amm-2015-0364
43. Obraztsova ED, Korotushenko KG, Pimenov SM, et al. Raman and photoluminescence investigations of nanograined diamond films. Nanostruct Mater. 1995;6(5–8):827–830. doi:10.1016/0965-9773(95)00187-5
44. Jansen KA, Atherton P, Ballestrem C. Mechanotransduction at the cell-matrix interface. Semin Cell Dev Biol. 2017;71:75–83. doi:10.1016/j.semcdb.2017.07.027
45. Strojny B, Kurantowicz N, Sawosz E, et al. Long term influence of carbon nanoparticles on health and liver status in rats. PLoS One. 2015;10(12):e0144821. doi:10.1371/journal.pone.0144821
46. Amaral M, Gomes PS, Lopes MA, Santos JD, Silva RF, Fernandes MH. Cytotoxicity evaluation of nanocrystalline diamond coatings by fibroblast cell cultures. Acta Biomater. 2009;5(2):755–763. doi:10.1016/j.actbio.2008.08.015
47. Lifshitz Y. Hydrogen-free amorphous carbon films: correlation between growth conditions and properties. Diam Relat Mater. 1996;5(3–5):388–400. doi:10.1016/0925-9635(95)00445-9
48. Su Q, Shi W, Li D, et al. Effects of carbon concentration on properties of nano-diamond films. Appl Surf Sci. 2012;258(10):4645–4648. doi:10.1016/j.apsusc.2012.01.047
49. Jee AY, Lee M. Surface functionalization and physicochemical characterization of diamond nanoparticles. Curr Appl Phys. 2009;9(2):e144–e147. doi:10.1016/j.cap.2008.12.045
50. Chong KF, Loh KP, Vedula SRK, et al. Cell adhesion properties on photochemically functionalized diamond. Langmuir. 2007;23(10):5615–5621. doi:10.1021/la070037y
51. Lieleg O, Baumgärtel RM, Bausch AR. Selective filtering of particles by the extracellular matrix: an electrostatic bandpass. Biophys J. 2009;97(6):1569–1577. doi:10.1016/j.bpj.2009.07.009
52. Katainen J, Paajanen M, Ahtola E, Pore V, Lahtinen J. Adhesion as an interplay between particle size and surface roughness. J Colloid Interf Sci. 2006;304(2):524–529. doi:10.1016/j.jcis.2006.09.015
53. Theocharis AD, Manou D, Karamanos NK. The extracellular matrix as a multitasking player in disease. FEBS J. 2019;286(15):2830–2869. doi:10.1111/febs.14818
54. Arun AS, Tepper CG, Lam KS. Identification of integrin drug targets for 17 solid tumor types. Oncotarget. 2018;9(53):30146–30162. doi:10.18632/oncotarget.25731
55. Humphries JD, Byron A, Humphries MJ. Integrin ligands at a glance. J Cell Sci. 2006;119(19):3901–3903. doi:10.1242/jcs.03098
56. Zha R, Guo W, Zhang Z, et al. Genome-wide screening identified that miR-134 acts as a metastasis suppressor by targeting integrin β1 in hepatocellular carcinoma. PLoS One. 2014;9(2):e87665. doi:10.1371/journal.pone.0087665
57. Masuzaki R, Ray KC, Roland J, Zent R, Lee YA, Karp SJ. Integrin β1 establishes liver microstructure and modulates transforming growth factor β during liver development and regeneration. Am J Pathol. 2021;191(2):309–319. doi:10.1016/j.ajpath.2020.10.011
58. Speicher T, Siegenthaler B, Bogorad RL, Ruppert R, Petzold T, Padrissa-Altes S. Knockdown and knockout of β1-integrin in hepatocytes impairs liver regeneration through inhibition of growth factor signalling. Nat Commun. 2014;5(1):1–13. doi:10.1038/ncomms4862
59. Truong T, Shams H, Mofrad MR. Mechanisms of integrin and filamin binding and their interplay with talin during early focal adhesion formation. Integr Biol. 2015;7(10):1285–1296. doi:10.1039/c5ib00133a
60. Lamsoul I, Dupré L, Lutz PG. Molecular tuning of filamin a activities in the context of adhesion and migration. Front Cell Dev Biol. 2020;8:1432. doi:10.3389/fcell.2020.591323
61. Donadon M, Di Tommaso L, Soldani C, et al. Filamin A expression predicts early recurrence of hepatocellular carcinoma after hepatectomy. Liver Int. 2018;38(2):303–311. doi:10.1111/liv.13522
62. Hu L, Huang Z, Wu Z, Ali A, Qian A. Mammalian plakins, giant cytolinkers: versatile biological functions and roles in cancer. Int J Mol Sci. 2018;19(4):974. doi:10.3390/ijms19040974
63. Wang H, Wu M, Lu Y, et al. LncRNA MIR4435-2HG targets desmoplakin and promotes growth and metastasis of gastric cancer by activating Wnt/β-catenin signaling. Aging. 2019;11(17):6657. doi:10.18632/aging.102164
64. Hotulainen P, Paunola E, Vartiainen MK, Lappalainen P. Actin-depolymerizing factor and cofilin-1 play overlapping roles in promoting rapid F-actin depolymerization in mammalian nonmuscle cells. Mol Biol Cell. 2005;16(2):649–664. doi:10.1091/mbc.e04-07-0555
65. Wu H, Zhou J, Mei S, et al. Circulating exosomal microRNA‐96 promotes cell proliferation, migration and drug resistance by targeting LMO7. J Cell Mol Med. 2017;21(6):1228–1236. doi:10.1111/jcmm.13056
66. Kang S, Xu H, Duan X, et al. PCD1, a novel gene containing PDZ and LIM domains, is overexpressed in several human cancers. Cancer Res. 2000;60(18):5296–5302.
67. Yu J, Zhang W, Tang H, et al. Septin 2 accelerates the progression of biliary tract cancer and is negatively regulated by mir-140-5p. Gene. 2016;589(1):20–26. doi:10.1016/j.gene.2016.05.005
68. Lin BL, Li A, Mun JY, et al. Skeletal myosin binding protein-C isoforms regulate thin filament activity in a Ca2+-dependent manner. Sci Rep. 2018;8(1):1–13. doi:10.1038/s41598-018-21053-1
69. Sun LL, Cheng M, Xu XD. MicroRNA-30c inhibits pancreatic cancer cell proliferation by targeting twinfilin 1 and indicates a poor prognosis. World J Gastroenterol. 2019;25(42):6311. doi:10.3748/wjg.v25.i42.6311
70. Kaishang Z, Xue P, Shaozhong Z, et al. Elevated expression of Twinfilin-1 is correlated with inferior prognosis of lung adenocarcinoma. Life Sci. 2018;215:159–169. doi:10.1016/j.lfs.2018.10.067
71. Wang X, Li N, Han A, Wang Y, Lin Z, Yang Y. Ezrin promotes hepatocellular carcinoma progression by modulating glycolytic reprogramming. Cancer Sci. 2020;111(11):4061. doi:10.1111/cas.14562
72. He H, Li J, Xu M, Kan Z, Gao Y, Yuan C. Expression of septin 2 and association with clinicopathological parameters in colorectal cancer. Oncol Lett. 2019;18(3):2376–2383. doi:10.3892/ol.2019.10528
73. Cheng CC, Chao WT, Liao CC, et al. Plectin deficiency in liver cancer cells promotes cell migration and sensitivity to sorafenib treatment. Cell Adhes Migr. 2018;12(1):19–27. doi:10.1080/19336918.2017.1288789
74. Katada K, Tomonaga T, Satoh M, et al. Plectin promotes migration and invasion of cancer cells and is a novel prognostic marker for head and neck squamous cell carcinoma. J Proteomics. 2012;75(6):1803–1815. doi:10.1016/j.jprot.2011.12.018
75. Guo Q, Li L, Gao G, Liu R, Einaga Y, Zhi J. Nanodiamonds inhibit cancer cell migration by strengthening cell adhesion: implications for cancer treatment. ACS Appl Mater Inter. 2021;13(8):9620–9629. doi:10.1021/acsami.0c21332
76. Fišerová J, Maninová M, Sieger T, et al. Nuclear pore protein TPR associates with lamin B1 and affects nuclear lamina organization and nuclear pore distribution. Cell Mol Life Sci. 2019;76(11):2199–2216. doi:10.1007/s00018-019-03037-0
77. Lim SO, Park SJ, Kim W, et al. Proteome analysis of hepatocellular carcinoma. Biochem Bioph Res Co. 2002;291(4):1031–1037. doi:10.1006/bbrc.2002.6547
78. Roncato F, Regev O, Feigelson SW, et al. Nuclear lamin A/C promotes cancer cell survival and lung metastasis without restricting transendothelial migration. BioRxiv. 2020. doi:10.1101/2020.06.23.167130
79. Re OL, Mazza T, Giallongo S, et al. Loss of histone macroH2A1 in hepatocellular carcinoma cells promotes paracrine-mediated chemoresistance and CD4+ CD25+ FoxP3+ regulatory T cells activation. Theranostics. 2020;10(2):910. doi:10.7150/thno.35045
80. Massagué J. G1 cell-cycle control and cancer. Nature. 2004;432(7015):298–306. doi:10.1038/nature03094
81. Liu Z, Li J, Chen J, et al. MCM family in HCC: MCM6 indicates adverse tumor features and poor outcomes and promotes S/G2 cell cycle progression. BMC Cancer. 2018;18(1):1–10. doi:10.1186/s12885-018-4056-8
82. Cao S, Sun R, Wang W, et al. RNA helicase DHX9 may be a therapeutic target in lung cancer and inhibited by enoxacin. Am J Transl Res. 2017;9(2):674.
83. Sun F, Wu K, Yao Z, et al. Long noncoding RNA PVT1 promotes prostate cancer metastasis by increasing NOP2 expression via targeting tumor suppressor microRNAs. OncoTargets Ther. 2020;13:6755. doi:10.2147/OTT.S242441
84. Wen N, Bian L, Gon J, Meng Y. RPRD1B is a potentially molecular target for diagnosis and prevention of human papillomavirus E6/E7 infection‐induced cervical cancer: a case‐control study. Asia Pac J Clin Oncol. 2020;17:1–8. doi:10.1111/ajco.13439
85. Solaini G, Sgarbi G, Baracca A. Oxidative phosphorylation in cancer cells. BBA-Bioenergetics. 2011;1807(6):534–542. doi:10.1016/j.bbabio.2010.09.003
86. da Veiga Moreira J, Peres S, Steyaert JM, et al. Cell cycle progression is regulated by intertwined redox oscillators. Theor Biol Med Model. 2015;12(1):1–14. doi:10.1186/s12976-015-0005-2
87. Shin YK, Yoo BC, Chang HJ, et al. Down-regulation of mitochondrial F1F0-ATP synthase in human colon cancer cells with induced 5-fluorouracil resistance. Cancer Res. 2005;65(8):3162–3170. doi:10.1158/0008-5472.CAN-04-3300
88. Dallner G, Sindelar PJ. Regulation of ubiquinone metabolism. Free Radical Bio Med. 2000;29(3–4):285–294. doi:10.1016/S0891-5849(00)00307-5
89. Tian Y, Du W, Cao S, et al. Systematic analyses of glutamine and glutamate metabolisms across different cancer types. Chin J Cancer. 2017;36(1):1–14. doi:10.1186/s40880-017-0255-y
90. Ma HP, Chang HL, Bamodu OA, et al. Collagen 1A1 (COL1A1) is a reliable biomarker and putative therapeutic target for hepatocellular carcinogenesis and metastasis. Cancers. 2019;11(6):786. doi:10.3390/cancers11060786
91. Lee PP, Desai TA. Nitinol-based nanotubular arrays with controlled diameters upregulate human vascular cell ECM production. ACS Biomater Sci Eng. 2016;2(3):409–414. doi:10.1021/acsbiomaterials.5b00553
92. Carpenter SL, Mathew P. α2‐antiplasmin and its deficiency: fibrinolysis out of balance. Haemophilia. 2008;14(6):1250–1254. doi:10.1111/j.1365-2516.2008.01766.x
93. Noh CK, Kim SS, Kim DK, et al. Inter-alpha-trypsin inhibitor heavy chain H4 as a diagnostic and prognostic indicator in patients with hepatitis B virus-associated hepatocellular carcinoma. Clin Biochem. 2014;47(13–14):1257–1261. doi:10.1016/j.clinbiochem.2014.05.002
94. Hamm A, Veeck J, Bektas N, Wild PJ, Hartmann A, Heindrichs U. Frequent expression loss of Inter-alpha-trypsin inhibitor heavy chain (ITIH) genes in multiple human solid tumors: a systematic expression analysis. BMC Cancer. 2008;8(1):1–15. doi:10.1186/1471-2407-8-25
95. Singhal S, Nie S, Wang MD. Nanotechnology applications in surgical oncology. Annu Rev Med. 2010;61:359–373. doi:10.1146/annurev.med.60.052907.094936
96. Grauer O, Jaber M, Hess K, et al. Combined intracavitary thermotherapy with iron oxide nanoparticles and radiotherapy as local treatment modality in recurrent glioblastoma patients. J Neuro Oncol. 2019;141(1):83–94. doi:10.1007/s11060-018-03005-x
97. Baquerizo A, Bañares R, Foaouzi S. Current clinical status of the extracorporeal liver support devices. Transplant Liver. 2015;1463–1487. doi:10.1016/B978-1-4557-0268-8.00107-X
98. Luo X, Liu Y, Feng W, et al. NUP37, a positive regulator of YAP/TEAD signaling, promotes the progression of hepatocellular carcinoma. Oncotarget. 2017;8(58):98004. doi:10.18632/oncotarget.20336
99. McFarlane C, Kelvin AA, de la Vega M, et al. The deubiquitinating enzyme USP17 is highly expressed in tumor biopsies, is cell cycle regulated, and is required for G1-S progression. Cancer Res. 2010;70(8):3329–3339. doi:10.1158/0008-5472
100. Lee H, Yu DM, Um MJ, et al. Hepatocytic Prominin-1 protects liver fibrosis by stabilizing the SMAD7 protein. BioRxiv. 2019;846493. doi:10.1101/846493.
101. Mori S, Nada S, Kimura H, et al. The mTOR pathway controls cell proliferation by regulating the FoxO3a transcription factor via SGK1 kinase. PLoS One. 2014;9(2):e88891. doi:10.1371/journal.pone.0088891
102. Oussalah A, Rischer S, Bensenane M, et al. Plasma mSEPT9: a novel circulating cell-free DNA-based epigenetic biomarker to diagnose hepatocellular carcinoma. EBioMedicine. 2018;30:138–147. doi:10.1016/j.ebiom.2018.03.029
103. Liou GY, Storz P. Reactive oxygen species in cancer. Free Radical Res. 2010;44(5):479–496. doi:10.3109/10715761003667554
104. Chen P, Zheng X, Zhou Y, Xu Y, Zhu L, Qian Y. Talin-1 interaction network promotes hepatocellular carcinoma progression. Oncotarget. 2017;8(8):13003. doi:10.18632/oncotarget.14674
105. Cheng ZX, Huang XH, Wang Q, Chen JS, Zhang LJ, Chen XL. Clinical significance of decreased nidogen‐2 expression in the tumor tissue and serum of patients with hepatocellular carcinoma. J Surg Oncol. 2012;105(1):71–80. doi:10.1002/jso.22047
106. Alečković M, Wei Y, LeRoy G, et al. Identification of Nidogen 1 as a lung metastasis protein through secretome analysis. Gene Dev. 2017;31(14):1439–1455. doi:10.1101/gad.301937.117
107. Hollósi P, Váncza L, Karászi K, et al. Syndecan-1 promotes hepatocyte-like differentiation of hepatoma cells targeting Ets-1 and AP-1. Biomolecules. 2020;10(10):1356. doi:10.3390/biom10101356
 © 2021 The Author(s). This work is published and licensed by Dove Medical Press Limited. The
full terms of this license are available at https://www.dovepress.com/terms
and incorporate the Creative Commons Attribution
- Non Commercial (unported, 3.0) License.
By accessing the work you hereby accept the Terms. Non-commercial uses of the work are permitted
without any further permission from Dove Medical Press Limited, provided the work is properly
attributed. For permission for commercial use of this work, please see paragraphs 4.2 and 5 of our Terms.
© 2021 The Author(s). This work is published and licensed by Dove Medical Press Limited. The
full terms of this license are available at https://www.dovepress.com/terms
and incorporate the Creative Commons Attribution
- Non Commercial (unported, 3.0) License.
By accessing the work you hereby accept the Terms. Non-commercial uses of the work are permitted
without any further permission from Dove Medical Press Limited, provided the work is properly
attributed. For permission for commercial use of this work, please see paragraphs 4.2 and 5 of our Terms.