Back to Journals » OncoTargets and Therapy » Volume 12
Diagnostic value of multiple tumor-associated autoantibodies in lung cancer
Authors Zhang R, Ma L, Li W ![]() , Zhou S, Xu S
, Zhou S, Xu S
Received 16 September 2018
Accepted for publication 27 November 2018
Published 9 January 2019 Volume 2019:12 Pages 457—469
DOI https://doi.org/10.2147/OTT.S187734
Checked for plagiarism Yes
Review by Single anonymous peer review
Peer reviewer comments 2
Editor who approved publication: Dr Sanjeev K. Srivastava
Rui Zhang,1 Li Ma,2 Weiying Li,2 Shijie Zhou,1 Shaofa Xu1
1Department of Thoracic Surgery, Beijing Chest Hospital, Capital Medical University, Beijing, People’s Republic of China; 2Cell Biology Laboratory, Department of Cellular and Molecular Biology, Beijing Tuberculosis and Thoracic Tumor Research Institute, Beijing Chest Hospital, Capital Medical University, Beijing, People’s Republic of China
Background: Lung cancer is the leading cause of cancer-related deaths. Survival rate improves significantly with early detection of lung cancer. Effective methods of early detection can reduce lung cancer mortality to a large extent as well as benefit the whole public health. The diagnostic value of one single marker is relatively low. Combined autoantibodies (AABs) can improve the sensitivity significantly rather than rely on one AAB and serve as good reservoir for early detection of lung cancer.
Patients and methods: We designed three parts in our experiment. In training set we measured the expression levels of AABs in 100 non-small-cell lung cancer (NSCLC) patients and 60 healthy controls by using ELISA detection method. A blinded validation was subsequently performed in 254 NSCLC patients, 125 healthy controls, and 71 nodule patients. A prospective expansion set was performed to evaluate the diagnosis value of AABs combined detection.
Results: Both in training set and validation set, the concentrations of SOX2, GAGE 7, MAGE A1, and P53 in NSCLC group increased prominently when compared to the healthy group (P<0.05). The concentration of GBU4-5 in adenocarcinoma group was higher than in the squamous cell carcinoma (SCC) group (P<0.05); the PGP9.5, which was opposite, in SCC group was higher than in the adenocarcinoma group (P<0.05). The positive rate of each AAB did not show any bias with age, gender, smoking history, and tumor location. Most importantly, different choice of biomarkers led to different detection results.
Conclusion: Our study confirmed the diagnostic value of tumor-associated AABs. They may be useful as latent tumor markers to facilitate the detection of early lung cancer.
Keywords: tumor-associated antigen, non-small-cell lung cancer, tumor marker, ELISA method, diagnosis
Introduction
Lung cancer is the leading cause of cancer-related deaths.1,2 The stage and grade of lung cancer greatly influenced treatment options.3 It is well known that early diagnosis and treatment of lung cancer can prolong life span and improve prognosis of patients. The 10-year survival rate of stage Ia postoperative lung cancer has reached 92%.4 Low-dose computed tomography (LDCT) examination is an important method to identify early lung cancer, but it has a high false-positive rate and the cancer remains undiagnosed as malignant or benign.5 Studies show that humoral immune system can generate tumor-associated autoantibodies (AABs) long before the disease become symptomatic.6–9 Based on this viewpoint, AABs as early diagnosis markers of cancer have been a hot area for several years. But single AAB marker, which has satisfactory sensitivity and specificity in cancer diagnosis has not yet been found. The joint determination of various AABs in serum provided a new idea and method for the diagnosis of cancer.10,11
In the current study, we chose seven different AABs (SOX2, GAGE 7, CAGE, MAGE A1, P53, GBU4-5, and PGP9.5) to evaluate the diagnostic value and clinical meaning in non-small-cell lung cancer (NSCLC) patients. During the course of the experiment, we designed three parts to validate our results: the training set, the validation set, and the expansion set. The training set was to evaluate the expression levels of these seven AABs, whether any differences exist between the NSCLC patients and healthy controls; the validation set was to prove the results of the training set using bigger sample research; and the expansion set was to evaluate the diagnosis value of AABs combined detection.
Patients and methods
Serum and samples
The study protocol as well as the informed consent were approved by the Beijing Chest Hospital Medical Ethics Committee according to the legal regulations. Written informed consent was collected from all experimental subjects. Experimental design was as mentioned above in the introduction segment. In the training set, the serum samples were obtained from 100 NSCLC patients together with 60 age-matched healthy controls. The validation set serum sample was obtained from 254 NSCLC patients together with 125 age-matched healthy controls, and 71 people with lung nodules (the expansion set). NSCLC patient serum samples and healthy controls were obtained from the Beijing Chest Hospital Samples Bank from May 2012 to May 2015. The 71 lung nodules patients came from epidemiological screen study, which had been carried out in Beijing area through low-dose CT examination. The patients’ serum samples were collected at initial diagnosis. None of the patients had received preoperative chemotherapy or radiotherapy. The healthy controls were recruited during health examinations and nobody showed evidence of malignancy. Tumor histology was classified according to the World Health Organization guidelines for histologic type of lung tumors. Tumor-node-metastasis (TNM) stage was determined according to the American Joint Committee on Cancer staging manual (seventh edition). All nodule patients were followed up until the patients were diagnosed with malignant tumor, or it was concluded on 30th May 2018; the standard of follow-up was performed strictly according to the clinical guidelines.
The supernatants were obtained from the blood samples through the centrifugation at 3,000 g for 15 minutes at 4°C temperature and were immediately sub-packaged and stored at −80°C for further analysis.
Basic clinical data of lung cancer patients in validation set are shown in Table 1.
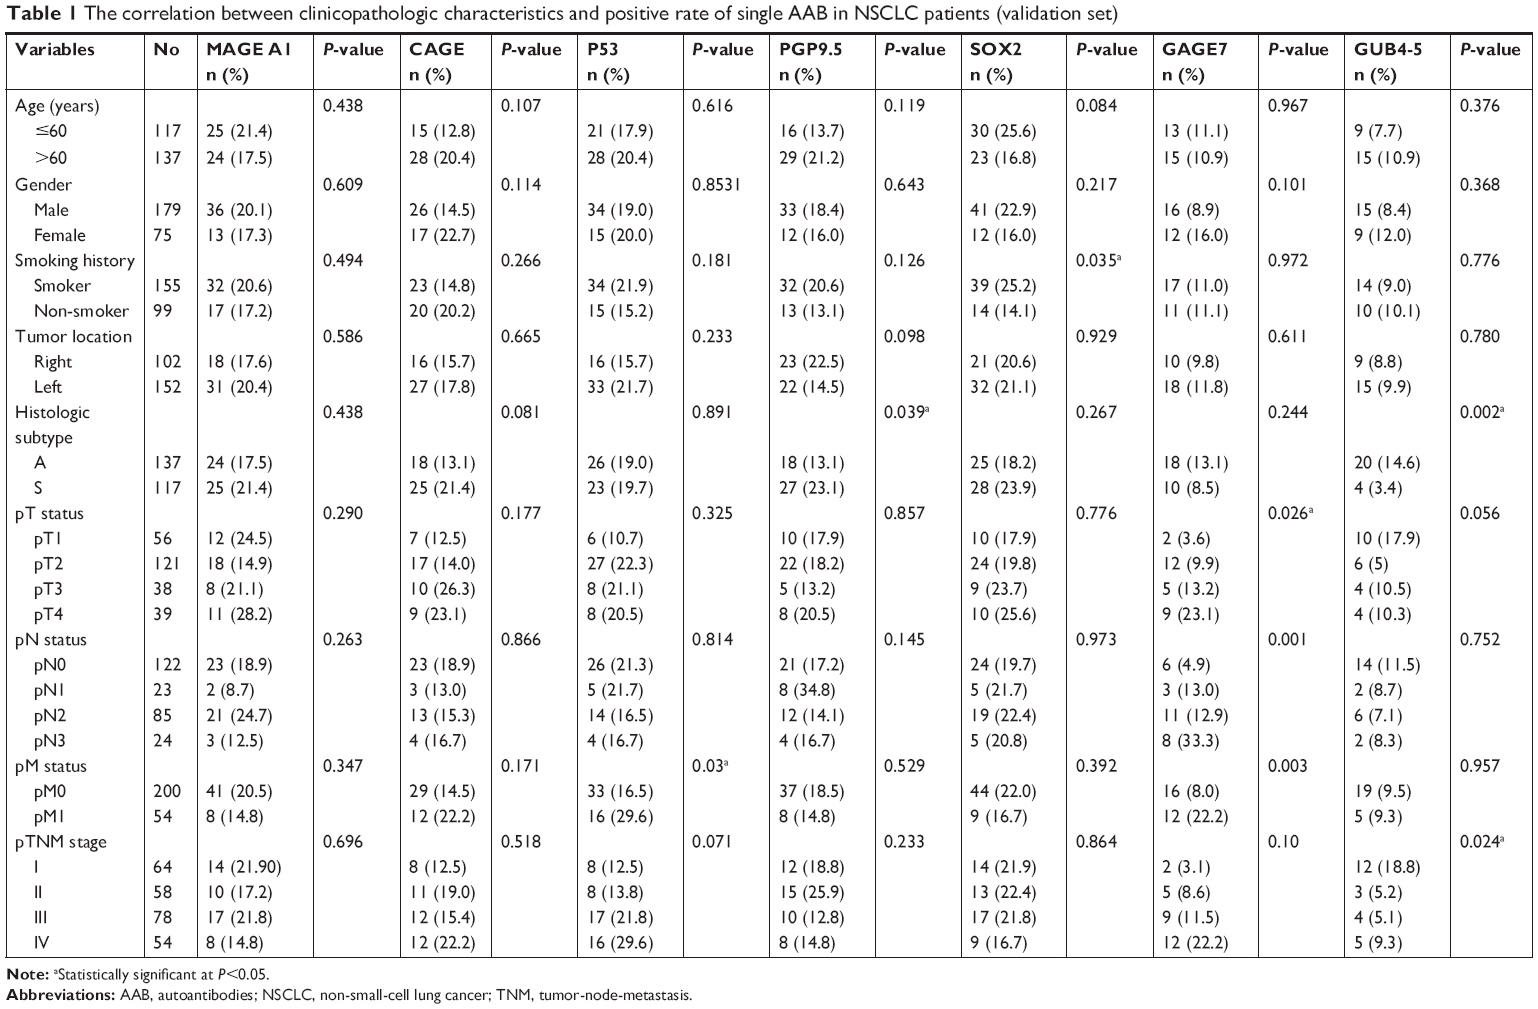 | Table 1 The correlation between clinicopathologic characteristics and positive rate of single AAB in NSCLC patients (validation set) |
AAB assay and cutoff
Before conducting this study, according to the publications, Cancer Probe identified seven antigens (SOX2, GAGE 7, CAGE, MAGE A1, P53, GBU4-5, and PGP9.5) from 43 tumor-associated antigens, and detected AABs targeting these antigens by ELISA. After laboratory studies, seven AABs (SOX2, GAGE 7, CAGE, MAGE A1, P53, GBU4-5, and PGP9.5) performed well in distinguishing lung cancer patients from non-cancer patients (lung cancer, n=155; healthy controls, n=145). Then we applied the seven-AAB assay panel test to validate its diagnostic value in the clinic. Detection kit of seven different AABs (Cancer Probe Biological Technology Co., Ltd, Hangzhou, China) was used according to the manufacturer’s recommendations. In brief, the serum samples and detection kit components were equilibrated to room temperature and were diluted based on the instructions. We washed the antigen-coated wells with 200–300 μL, 1× PBS, for 1 minute. Then 50-μL diluted serum samples, standards, and controls were added to the antigen-coated wells and incubated at room temperature for 1 hour. After washing the plate thrice with Microplate Washer using the standard procedure, 50 μL of diluted secondary antibodies antihuman IgG HRP was added, and then incubated for 30 minutes. Thereafter, the plate was once again washed thrice as above, and then 100 μL of substrate was added, followed by incubation for 15 minutes at room temperature. Subsequently, 50-μL stop solution was added to each well and mixed thoroughly. The OD at 450 nm was read using a spectrophotometer within 30 minutes.
The commercial Cancer Probe assay determined the cutoff values to get a specificity close to 90% in the matched controls (n=415) for the purpose of lung cancer screening in high-risk population. To complete this, a Monte Carlo direct search method12 was applied to achieve an optimized batch of cutoffs with the maximal sensitivity for the fixed specificity of 90%. Preset commercial cutoffs were applied in this research and no further optimization by receiver operating characteristic curves was performed.
Statistical analysis
The data were analyzed using SPSS 22.0 software package. Different degrees of differentiations of serum AAB levels between the healthy control and the NSCLC patient groups were presented as medians and ranges. Normality was validated by using the Kolmogorov-Smirnov test. For abnormal distribution of the concentrations of seven serum AABs, nonparametric tests (Mann–Whitney U test) were used to evaluate the differences among groups. Positivity rates were evaluated by mean of a standard χ2 tests with the respective degrees of freedom. All nodule patients were followed up until the patients were diagnosed with malignant tumor, or it was concluded on 30th May 2018. The standard of follow-up was performed strictly according to the clinical guidelines. P<0.05 indicated a statistically significant difference. If the AABs response to one of the panel candidates exceeded its cutoff, the sample was regarded positive.
Result
Expression serum levels of different AABs in NSCLC and healthy control groups in training set
In training set, the concentrations of SOX2 (P=0.043), GAGE 7 (P=0.040), MAGE A1 (P=0.0018), and P53 (P=0.017) were markedly increased in NSCLC group when compared to healthy group (Supplementary Tables S1 and S2). The CAGE expression level in serum of NSCLC group was similar to the healthy group (P=0.954). From the spot picture (Figure 1), we can see that the concentrations of GBU4-5 (P=0.141) and PGP9.5 (P=0.155) in NSCLC group were higher than the healthy group but the significances were not significant. For the pathological subtype analysis, the expression levels of SOX2, GAGE 7, MAGE A1, P53, and CAGE were not significantly different between adenocarcinoma and squamous cell carcinoma (SCC) groups (P>0.05) (Figure 1). The serum content of GBU4-5 was lower in SCC (P=0.042) and healthy (P=0.047) groups when compared to adenocarcinoma group, but there was no difference between SCC and healthy groups (P=0.954, Figure 1H). The concentration of PGP9.5 in SCC group was higher than in the adenocarcinoma group; the difference was significant (P=0.037). The expression level in adenocarcinoma (P=0.674) and SCC (P=0.0521) groups was not significant when compared to healthy group (Figure 1I).
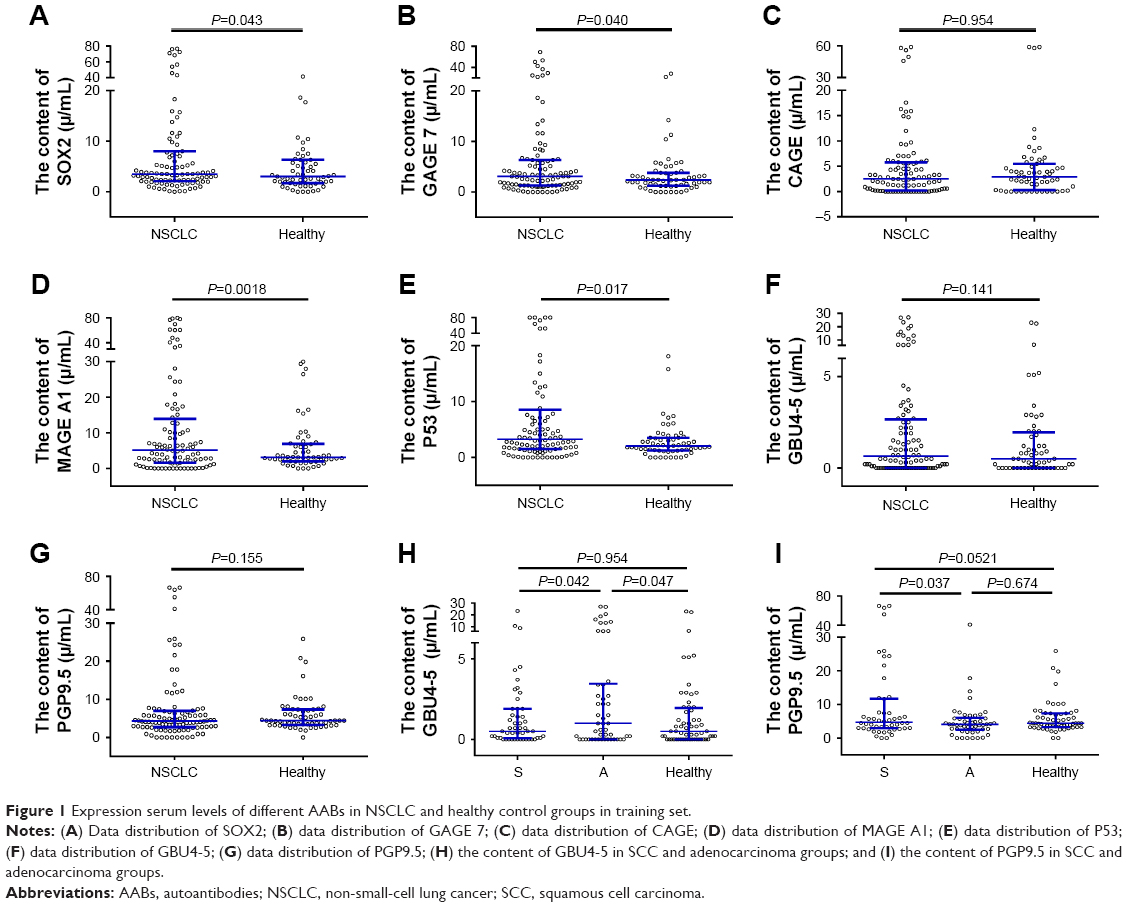 | Figure 1 Expression serum levels of different AABs in NSCLC and healthy control groups in training set. |
The results of validation set were similar to the results of training set
Consistent with the results in training set, in the validation set the concentrations of SOX2 (P=0.002), GAGE 7 (P=0.004), MAGE A1 (P<0.001), P53 (P<0.001), and GBU4-5 (P=0.041) were prominently increased in NSCLC group than in the healthy group with significant difference (Figure 2 and Supplementary Tables S3 and S5). From the spot picture, we can see that the concentrations of CAGE (P=0.5289) and PGP9.5 (P=0.058) in NSCLC group were higher than the healthy group but the differences were not significant; besides, similar to the results in training set, pathological subtype analysis showed that the expression of GBU4-5 in adenocarcinoma group was higher than in SCC (P=0.003) and healthy (P=0.006) groups. GBU4-5 level in SCC and healthy groups was not significantly different (P=0.733) (Figure 2H). The concentrations of PGP9.5 in SCC group were higher than adenocarcinoma (P=0.031) and healthy (P=0.014) groups, and the difference between adenocarcinoma and healthy groups was not significant (P=0.786) (Figure 2I).
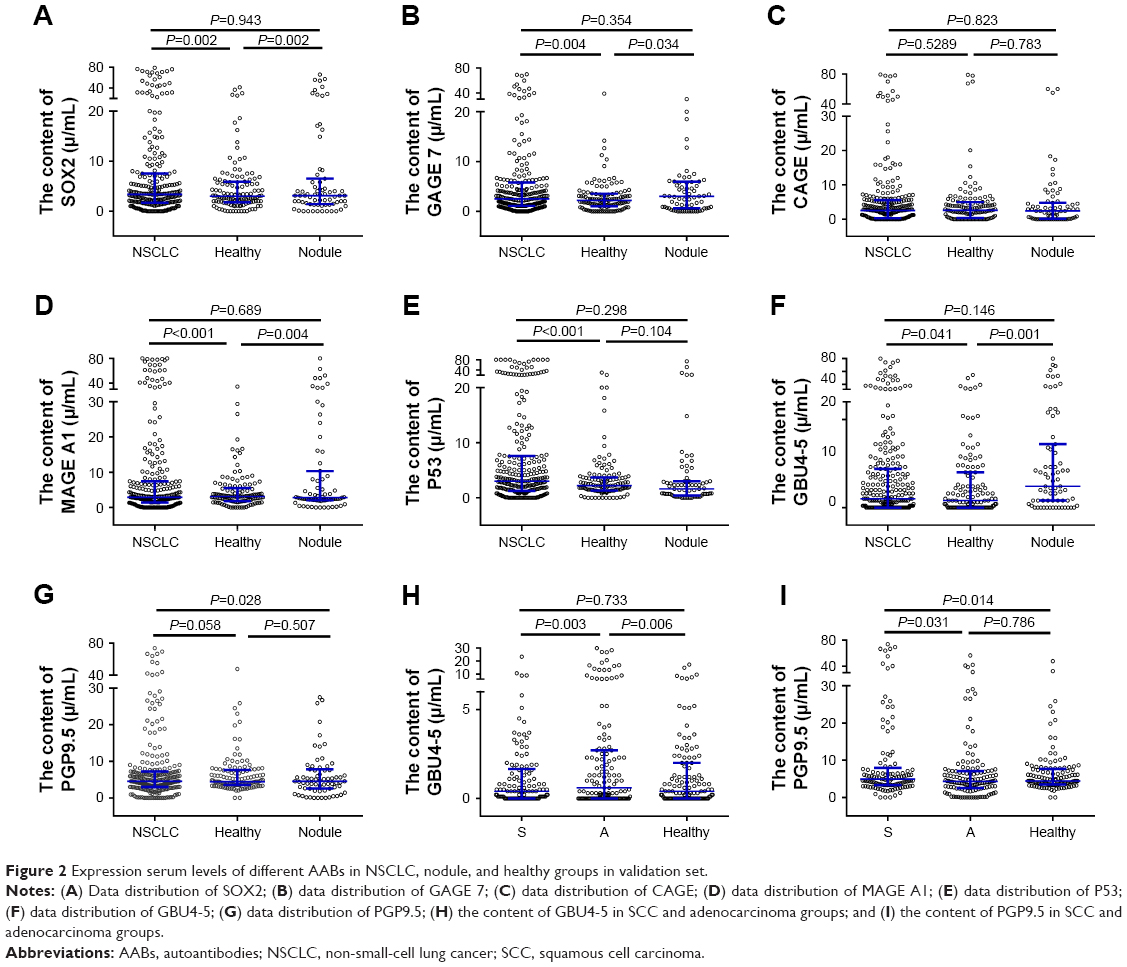 | Figure 2 Expression serum levels of different AABs in NSCLC, nodule, and healthy groups in validation set. |
The correlation between clinicopathologic characteristics and positive rate of single AABs in NSCLC patients (validation set)
The positive rate of different AABs did not correlate with gender, smoking history, pathological subtype, and tumor location. The positive rate of AAB PGP9.5 markedly increased in SCC group (23.1%) than in adenocarcinoma group (13.1%) (P=0.039). The positive rate of AAB GBU4-5 was higher in adenocarcinoma group (14.6%) than in SCC group (3.4%) (P=0.002).
The level of GAGE 7 was significantly different among different T (P=0.026) and N (P=0.001) stages. P53 (P=0.03) and GAGE 7 (P=0.003) were statistically significant among different M stages. In different TNM system classification, there was no statistical significance except for GBU4-5 (P=0.024). GBU4-5 was not significantly different among T (P=0.056), N (P=0.752), and M (P=0.957) stages, but it has a decreasing tendency that ran throughout the entire course of T-, N-, and M-staging. With the increase of TNM staging, the serum level of GBU4-5 tends to decrease, which suggested that AAB GBU4-5 may be more accurate in early stage lung cancer than in advanced disease (Table 1).
The levels of some AABs were significantly different between lung cancer group and benign nodule group in the expansion set
We screened 40,000 people in Beijing area through low-dose CT examination, and we finally got 71 people with lung nodules and assigned them to validation set. All nodule patients in validation set were followed up to the end of May 1, 2018. No patients were lost during the 2-year follow-up. Patients were confirmed with malignant tumor or benign nodule by pathological examination. Of all 71 nodule patients in validation set, 22 were confirmed with malignant tumors and others were confirmed with benign nodules. In expansion set, 22 malignant tumor patients were assigned to lung cancer group, and 49 benign nodule patients were assigned to benign group, and 125 healthy people were regarded as healthy group.
The expression level of SOX2 (P<0.001), GAGE 7 (P=0.024), MAGE A1 (P=0.0398), P53 (P<0.001), and GBU4-5 (P=0.002) in lung cancer group markedly increased when compared to benign nodule group (Supplementary Tables S4, S6, and S7). Compared to healthy group, the concentrations of SOX2 (P=0.035), GAGE 7 (P=0.033), MAGE A1 (P=0.008), P53 (P=0.002), and GBU4-5 (P=0.002) in lung cancer group were higher with statistical significance; the results in expansion set were similar to the results in validation set except for AAB CAGE. The CAGE level in cancer group was not significantly different compared to benign (P=0.467) and healthy (P=0.835) groups. The expression level of seven AABs SOX2, GAGE 7, CAGE, MAGE A1, P53, GBU4-5, and PGP9.5 was not significantly different between the benign and healthy groups (P>0.05) (Figure 3).
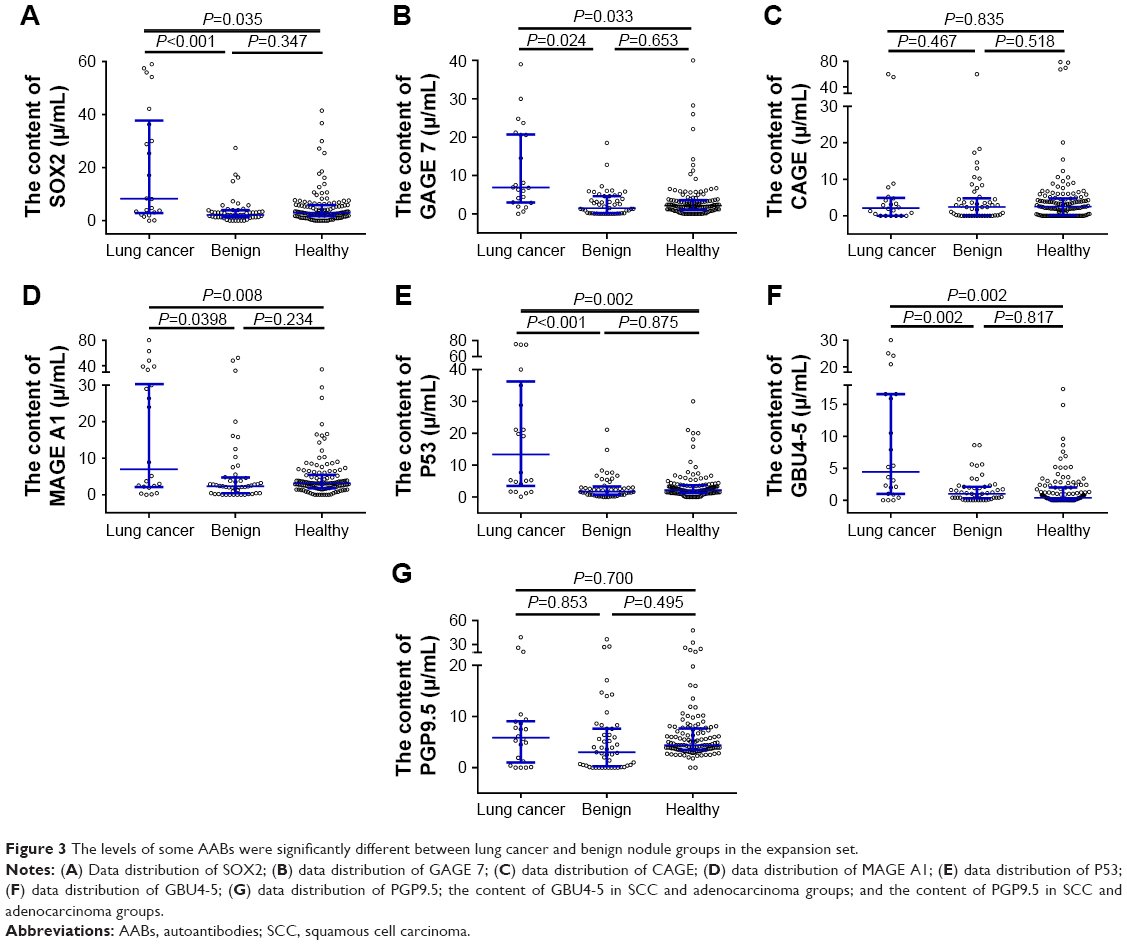 | Figure 3 The levels of some AABs were significantly different between lung cancer and benign nodule groups in the expansion set. |
Positive frequency and diagnostic values of single and combined AABs
In validation set, of all the AABs in NSCLC group, the positive rate of SOX2 is the highest (20.9%) and GBU4-5 is the lowest (9.4%); in healthy controls, the positive rate of CAGE is the highest (12.4%) and GAGE is the lowest (3.3%) (Table 2). Compared to the positive rate of each AAB in healthy controls, the positive rate of SOX2 (P=0.016), GAGE7 (P=0.012), MAGE A1 (P=0.037), P53 (P<0.001), and PGP9.5 (P=0.049) showed statistical increase in NSCLC group (Figure 4A). The positive rate of seven combined AABs was comparatively higher in NSCLC group (65.7%) than in healthy group (42.1%) (P<0.001). In the same batch of NSCLC patients, the expression level of traditional tumor markers including carcinoembryonic antigen (CEA), cytokeratin 19 fragment 21-1, and neuron-specific enolase (NSE) was refined from the medical records. The positive rate of the three combined traditional tumor markers (one of the traditional tumor markers exceeding its clinical cutoff is regarded as positive) is 58.7%, lower than the positive rate of seven combined AABs (65.7%). For pathological analysis, there was statistical difference in the positive rate in SCC (68.4%, P<0.001) and adenocarcinoma (63.5%, P<0.001) groups when compared to the healthy group. The positive rate of seven combined AABs in stage I, stage II, stage III, and stage IV were 64.1%, 66.7%, 60.5%, and 66.7%, respectively. In different clinical stages of NSCLC, the positive rate was quite close.
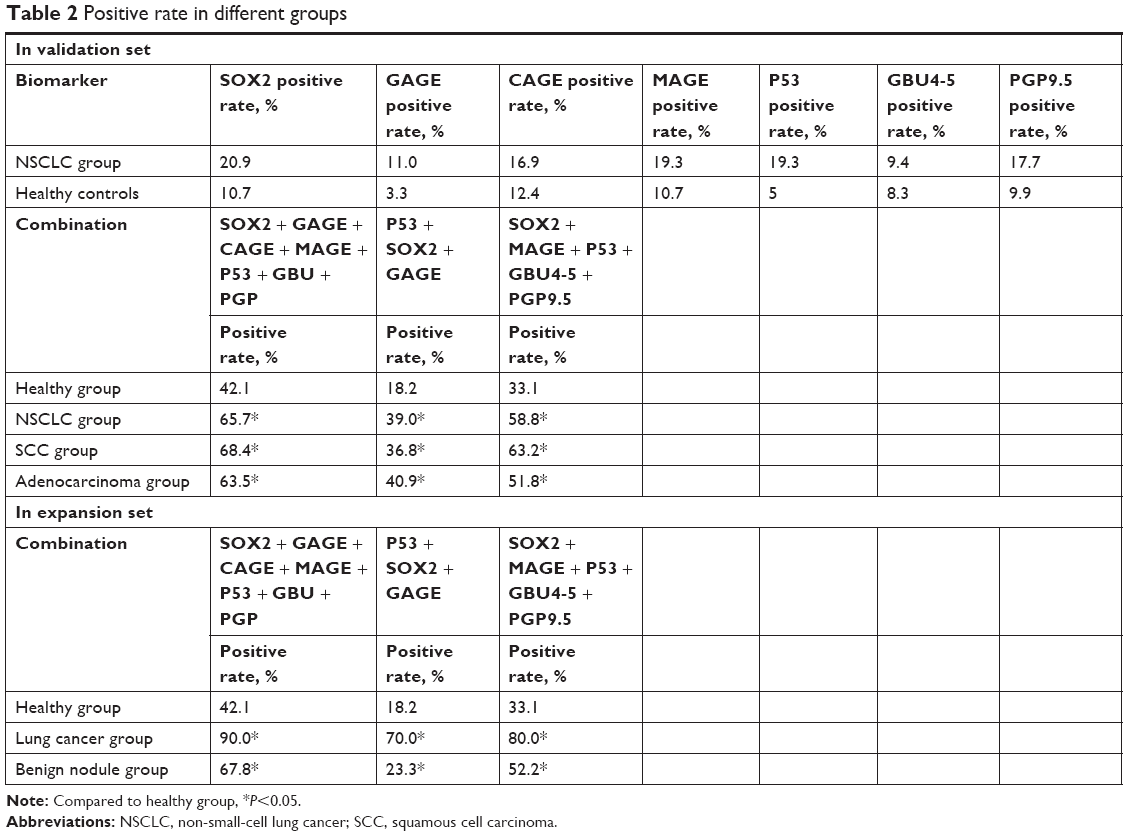 | Table 2 Positive rate in different groups |
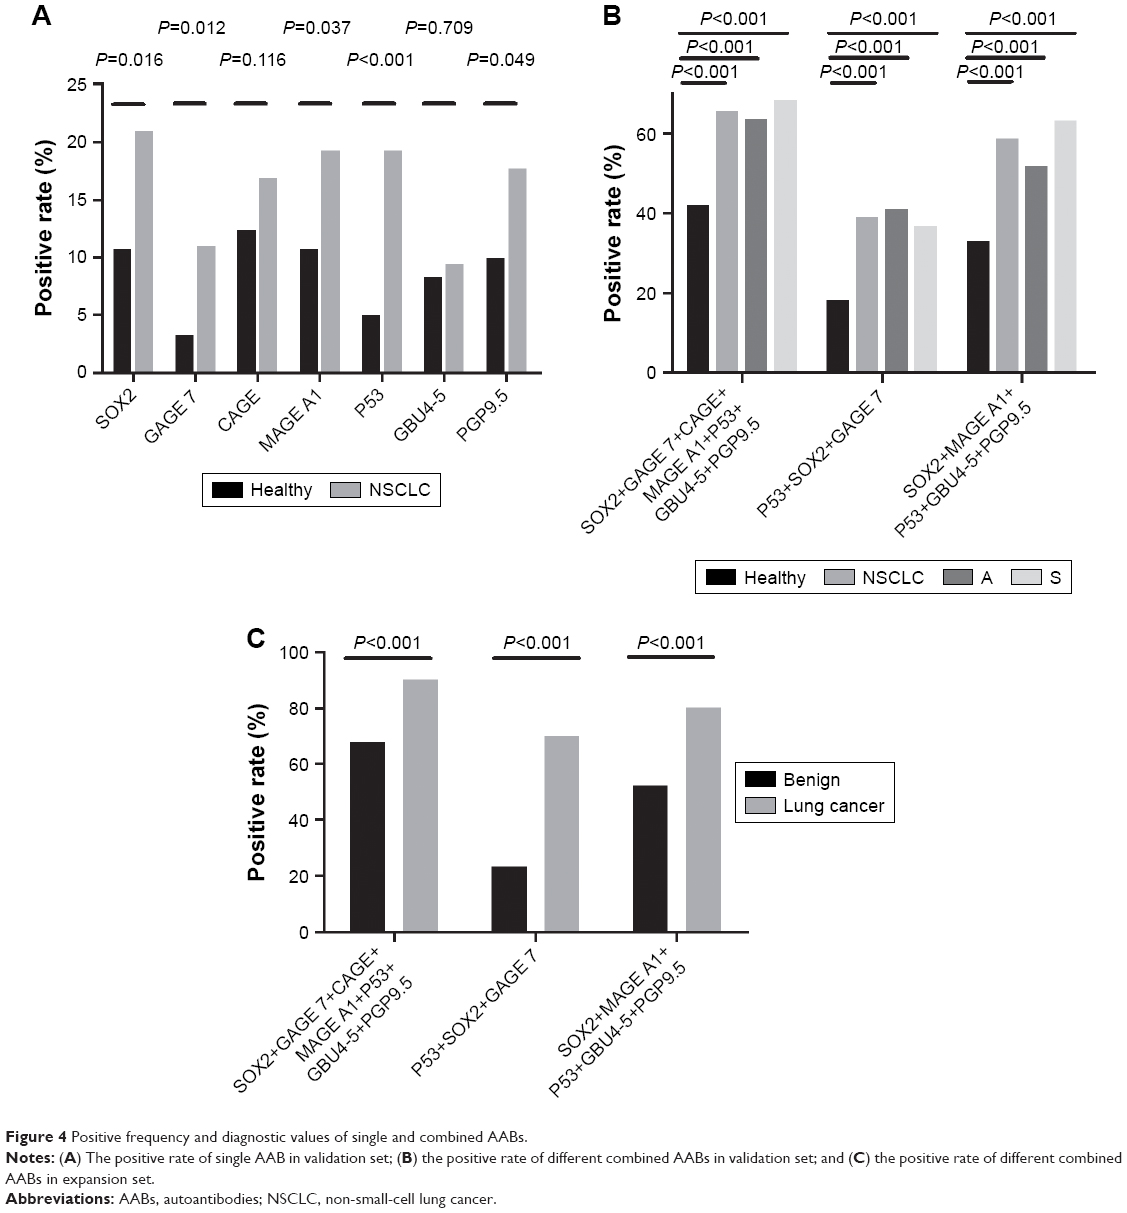 | Figure 4 Positive frequency and diagnostic values of single and combined AABs. |
We performed multivariate logistic regression (MLR) analysis for the full validation set, and we have drawn the conclusion that biomarkers P53, SOX2, and GAGE7 were more correlated with non-small lung cancer. Then we combined the above three AABs together and evaluated its diagnostic value. The positive rate was 39.0% in NSCLC group and the positive rate in healthy group was 18.2%, which means the specificity of the three combination AABs was 81.2%. High specificity is required for screening lung cancer to avoid false positivity. For pathological subtype analysis, the positive rate in SCC group was 36.8%, and the positive rate in adenocarcinoma group was 40.9%. Both the differences were significant when compared to the healthy group (P<0.001) (Figure 4B; Table 2).
We also performed MLR analysis only in the adenocarcinoma and SCC groups. In adenocarcinoma group, we got the same biomarkers P53, SOX2, and GAGE. However, in the SCC group, five different markers were obtained, SOX2, MAGE A1, P53, GBU4-5, and PGP9.5. Then we combined the SOX2, MAGE A1, P53, GBU4-5, and PGP9.5 together and evaluated its diagnostic value. The positive rate was 58.8%, 33.1%, 51.8%, and 63.2% in NSCLC, healthy, adenocarcinoma, and SCC groups, respectively. The sensitivity and specificity of the five combinations were 58.8% and 66.9%, respectively. (Figure 4B; Table 2).
In expansion set, the positive rate of seven combined AABs (SOX2, GAGE 7, CAGE, MAGE A1, P53, GBU4-5, and PGP9.5) was 90% in lung cancer group and 67.8% in benign group. The positive rate of three combined AABs (P53, SOX2, and GAGE) was 70% in lung cancer group and 23.3% in benign group. The positive rate of five combined AABs (SOX2, MAGE, P53, GBU4-5, and PGP9.5) was 80% in lung cancer group and 52.2% in benign group. (Figure 4C; Table 2).
Discussion
Lung cancer is one of the most common cancers as well as the leading cause of cancer-related death worldwide.1,2 As lung cancer in early stages lacks of clinical symptoms, more than 75% of patients have local or distant metastasis at the time of diagnosis,13 which leads to the low 5-year overall survival rate (16%).14 Following X-ray and computed tomography (CT) examinations can reduce the incidence of patients with late-stage lung cancer, however, CT scanning has a high rate of false-positive, which ultimately prove to be benign lesions after biopsy or surgical intervention. Besides, these follow-up procedures are costly and the radiation exposure may harm patients.15 Noninvasive blood-based biomarkers for diagnosis of lung cancer had been reported, including circulating tumor cells, circulating tumor DNA, circulating microRNA, and tumor-associated AAB.16–18 Detecting these AABs have diagnostic and prognostic values.19 As humoral immune responses exist several months or years prior to the clinical symptoms, AABs could be used for early detection of lung cancer.9,20 Combined AABs provide a more accurate result than the individual biomarker considered alone.10,11
In our study, we chose seven different AABs (SOX2, GAGE 7, CAGE, MAGE A1, P53, GBU4-5, and PGP9.5) to assess their diagnostic value. Mutant P53 proteins accumulate in cancer cells and induce circulating P53 antibodies in cancer patients.21 PGP9.5 is a ubiquitin hydrolase, widely expressed in neuronal tissues during neuronal differentiation. The increased expression of PGP9.5 is specifically correlated with lung cancer development and frequently overexpressed in primary NSCLC.22 SOX2 is amplified and overexpressed in SCC and SCLC.23 GAGE 7, GBU4-5, MAGE A1, and CAGE are cancer testis antigens, which do not express in other somatic tissues except the testis and a number of solid tumors.
In training set, we confirmed that this panel had the diagnostic value of NSCLC, however, not every expression level of single biomarker made a difference; only the concentrations of SOX2, GAGE 7, MAGE A1, P53, and GBU4-5 prominently increased in NSCLC group than in healthy group. To further confirm this result, we enlarged the samples and in validation set we got similar results. In the analysis of training set we found that the expression level of AABs GBU4-5 and PGP9.5 was statistically different between the SCC and adenocarcinoma groups. The concentration of GBU4-5 in adenocarcinoma group was higher than in the SCC group; the PGP9.5, which was opposite, in SCC group was higher than in the adenocarcinoma group. What we did next was to further analyze the concentrations of GBU4-5 and PGPP9.5 in validation set between SCC and adenocarcinoma groups, and finally we proved the differences indeed exist.
Most studies about AABs mainly concentrated on the diagnostic value of joint detection of AABs. Seldom did studies pay attention to the subtype analysis grouped by pathological classification, age, gender, and smoking history. In this study, we further clarified the clinical relationship between the positive rate of single AAB. The positive rate of different AABs did not correlate with age, gender, smoking history, and tumor location. All concentrations of AABs were similar in different groups except GAGE7, and statistically significant in pathological T classifications and pathological N classifications. In addition, AABs GAGE7 as well as P53 were both significantly different among different pathological M classifications. Most biomarkers correlated with tumor stage and pathological type, and the positive rate tended to increase in more advanced stages. In our study we found that the positive rate of AAB GBU4-5 in early T, N, and M stages decreased in late stages even though the differences were not statistically different. This indicated that GBU4-5 may be a useful biomarker for early screening. Previous study showed that AAB P53 significantly increased in lung cancer patients with larger tumor size.24 It is noticeable that positive rate of P53 is higher in advanced stages of NSCLC than in early stage disease with statistical significance, which suggested that P53 may be more sensitive in advanced stages of lung cancer. The positive rate of the combination of seven AABs was 64.1%, 66.7%, 60.5%, and 66.7% in stage I, II, III, and IV, which was quite similar among different clinical stages.
To prove the diagnostic value of different AABs, we performed a prospective experiment by surveying natural populations in Beijing area, and 40,000 people volunteered in this investigation. In the end, we got 71 nodule patients through LDCT examination. After following up, 22 were confirmed malignant and others were confirmed benign. Then we put these subjects into expansion set; 125 healthy people were also included in this set. In expansion set, the expression level of seven AABs SOX2, GAGE 7, CAGE, MAGE A1, P53, GBU4-5, and PGP9.5 had no significant difference between the benign and healthy groups. In lung cancer group, most of the biomarkers increased statistically when compared to benign and healthy groups. The results may be the key cues to explain why in the expression of AABs there was no difference, except PGP9.5, between the NSCLC and nodule groups in validation set.
Our study suggested that this panel of seven combined AABs had the sensitivity of 65.7% in NSCLC patients, higher than the traditional biomarkers (CEA, NSE, and SCC), which had a positive rate of 58.7% in the same batch of NSCLC patients. However, the specificity of this panel in our study was only 57.9%. Then we optimized the combinations through logistic regression analysis method. At first, regression logistic analysis was performed in all non-small lung cancers; three biomarkers including P53, SOX2, and GAGE 7 were selected. The combination of above three biomarkers had the sensitivity of 39% and specificity of 81.8%. High specificity is required for screening test to avoid false positivity.
Because of the difference between SCC and adenocarcinoma groups in the expressions of AABs, we performed logistic regression analysis only in the SCC group or in the adenocarcinoma group. We discovered that the biomarkers selected from adenocarcinoma group were the same as the biomarkers selected from NSCLC group. Unlikely, five biomarkers, SOX2, MAGE, P53, GBU4-5, and PGP9.5, were selected from SCC group. Different choice of biomarkers led to different detection results. Combining those five biomarkers together led to a sensitivity of 58.8% and specificity of 66.9% in validation set. Next, we used different combinations of AABs mentioned above in expansion set to verify its diagnostic value. Apparently, the combination of three AABs (P53, SOX2, and GAGE) had a high specificity (81.8%) as well as high sensitivity (70%), which is more advantageous than the seven combined AABs (sensitivity of 90% and specificity of 57.9%) or five combined AABs (sensitivity of 80% and specificity of 66.9%) in the diagnosis of lung cancer. Under the premise of satisfactory sensitivity and specificity, reducing some AABs to a new panel is more economic for lung cancer screening. On the other hand, future work is planned using an increased assay panel, which will include some AABs or tumor-related antigens in order to improve the accuracy of this panel in lung cancer detection.
The strength of this study is that the healthy group was matched well for age and gender both in training set and in validation set. The insufficiency in our research was that the sample were small, especially, the number of nodule patients included, which was only 71 patients. Another weakness of this study is that we did not choose other biomarkers like AABs or antigens to increase the sensitivity and/or specificity of this panel. Further studies are planned using an increased assay panel, which will include some AABs in order to be more accurate in the early detection of lung cancer.
Conclusion
Our study verified the diagnostic value of serum AABs in NSCLC and its application in early detection of lung cancer. Blood samples are accessible and the measurement to test these samples is repeatable and economic. Different choice of biomarkers led to different detection results. An optimized combination is urgently needed to facilitate detection in early lung cancer.
Acknowledgment
This study was financed by Beijing Municipal Science and Technology Committee (No. Z151100002115049) and Beijing Municipal Administration of Hospitals Incubating Program (code PX2016062).
Disclosure
The authors report no conflicts of interest in this work.
References
Jemal A, Siegel R, Xu J, Ward E. Cancer statistics, 2010. CA Cancer J Clin. 2010;60(5):277–300. | ||
Jemal A, Bray F, Center MM, Ferlay J, Ward E, Forman D. Global cancer statistics. CA Cancer J Clin. 2011;61(2):69–90. | ||
Travis WD, Giroux DJ, Chansky K, et al. The IASLC Lung Cancer Staging Project: proposals for the inclusion of broncho-pulmonary carcinoid tumors in the forthcoming (seventh) edition of the TNM Classification for Lung Cancer. J Thorac Oncol. 2008;3(11):1213–1223. | ||
International Early Lung Cancer Action Program Investigators, Henschke CI, Yankelevitz DF, et al. Survival of patients with stage I lung cancer detected on CT screening. N Engl J Med. 2006;355(17):1763–1771. | ||
Croswell JM, Baker SG, Marcus PM, Clapp JD, Kramer BS. Cumulative incidence of false-positive test results in lung cancer screening: a randomized trial. Ann Intern Med. 2010;152(8):505–512, W176–180. | ||
Storr SJ, Chakrabarti J, Barnes A, Murray A, Chapman CJ, Robertson JF. Use of autoantibodies in breast cancer screening and diagnosis. Expert Rev Anticancer Ther. 2006;6(8):1215–1223. | ||
Yao Y, Fan Y, Wu J, et al. Potential application of non-small cell lung cancer-associated autoantibodies to early cancer diagnosis. Biochem Biophys Res Commun. 2012;423(3):613–619. | ||
Zhang JY, Casiano CA, Peng XX, Koziol JA, Chan EK, Tan EM. Enhancement of antibody detection in cancer using panel of recombinant tumor-associated antigens. Cancer Epidemiol Biomarkers Prev. 2003;12(2):136–143. | ||
Zhong L, Coe SP, Stromberg AJ, Khattar NH, Jett JR, Hirschowitz EA. Profiling tumor-associated antibodies for early detection of non-small cell lung cancer. J Thorac Oncol. 2006;1(6):513–519. | ||
Mazzone PJ, Wang X-F, Han X, et al. Evaluation of a Serum Lung Cancer Biomarker Panel. Biomarker Insights. 2018;13:1177271917751608. | ||
Tang ZM, Ling ZG, Wang CM, Wu YB, Kong JL. Serum tumor-associated autoantibodies as diagnostic biomarkers for lung cancer: A systematic review and meta-analysis. PLoS One. 2017;12(7):e0182117. | ||
Geyer CJ. Estimation and optimization of functions. In: Gilks WR, Richardson S, Spiegelhalter DJ, editors. Markov Chain Monte Carlo in Practice. Chapman and Hall. 1996:241–258. | ||
Edwards BK, Ward E, Kohler BA, et al. Annual report to the nation on the status of cancer, 1975–2006, featuring colorectal cancer trends and impact of interventions (risk factors, screening, and treatment) to reduce future rates. Cancer. 2010;116(3):544–573. | ||
Siegel R, Naishadham D, Jemal A. Cancer statistics, 2012. CA Cancer J Clin. 2012;62(1):10–29. | ||
National Lung Screening Trial Research Team, Aberle DR, Adams AM, et al. Reduced lung-cancer mortality with low-dose computed tomographic screening. N Engl J Med. 2011;365(5):395–409. | ||
Hennessey PT, Sanford T, Choudhary A, et al. Serum microRNA biomarkers for detection of non-small cell lung cancer. PLoS One. 2012;7(2):e32307. | ||
Hofman V, Bonnetaud C, Ilie MI, et al. Preoperative circulating tumor cell detection using the isolation by size of epithelial tumor cell method for patients with lung cancer is a new prognostic biomarker. Clin Cancer Res. 2011;17(4):827–835. | ||
Krebs MG, Hou JM, Sloane R, et al. Analysis of circulating tumor cells in patients with non-small cell lung cancer using epithelial marker-dependent and -independent approaches. J Thorac Oncol. 2012;7(2):306–315. | ||
Tan EM. Autoantibodies as reporters identifying aberrant cellular mechanisms in tumorigenesis. J Clin Invest. 2001;108(10):1411–1415. | ||
Pereira-Faca SR, Kuick R, Puravs E, et al. Identification of 14-3-3 theta as an antigen that induces a humoral response in lung cancer. Cancer Res. 2007;67(24):12000–12006. | ||
Mattioni M, Soddu S, Prodosmo A, et al. Prognostic role of serum p53 antibodies in lung cancer. BMC Cancer. 2015;15:148. | ||
Hibi K, Westra WH, Borges M, Goodman S, Sidransky D, Jen J. PGP9.5 as a candidate tumor marker for non-small-cell lung cancer. Am J Pathol. 1999;155(3):711–715. | ||
Dogan I, Kawabata S, Bergbower E, et al. SOX2 expression is an early event in a murine model of EGFR mutant lung cancer and promotes proliferation of a subset of EGFR mutant lung adenocarcinoma cell lines. Lung Cancer. 2014;85(1):1–6. | ||
Li P, Shi J-X, Xing M-T, Dai L-P, Li J-T, Zhang J-Y. Evaluation of serum autoantibodies against tumor-associated antigens as biomarkers in lung cancer. Tumor Bio. 2017;39(10):1010428317711662. |
Supplementary materials
1. Expression serum levels of different AABs of NSCLC and healthy control groups in training set.
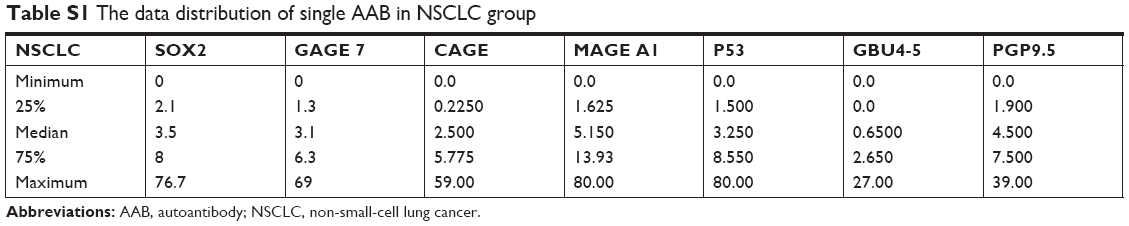 | Table S1 The data distribution of single AAB in NSCLC group |
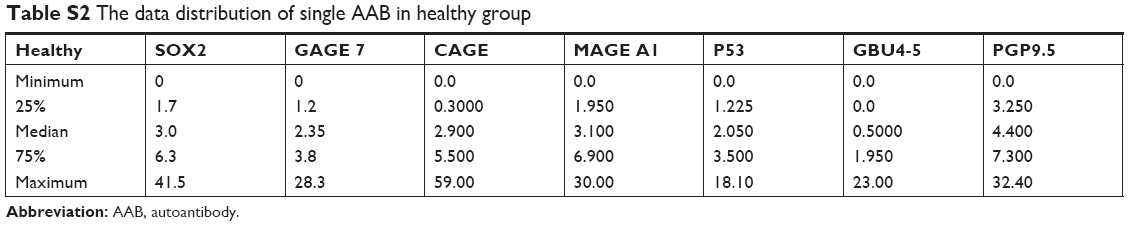 | Table S2 The data distribution of single AAB in healthy group |
2. The results of validation set were similar to the results of training set.
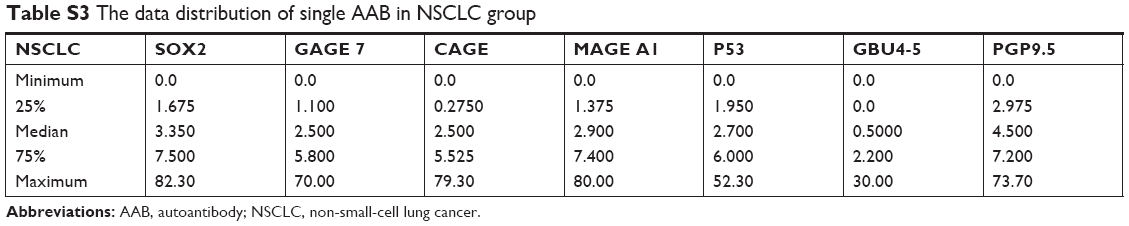 | Table S3 The data distribution of single AAB in NSCLC group |
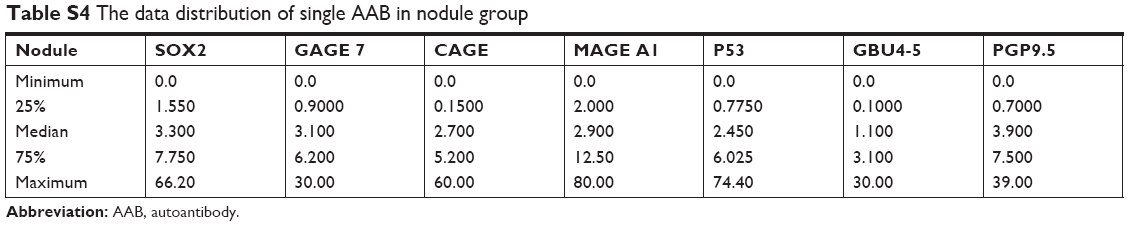 | Table S4 The data distribution of single AAB in nodule group |
 | Table S5 The data distribution of single AAB in healthy group |
3. The levels of some AABs were significantly different among lung cancer group, benign nodule group and healthy group in the expansion set.
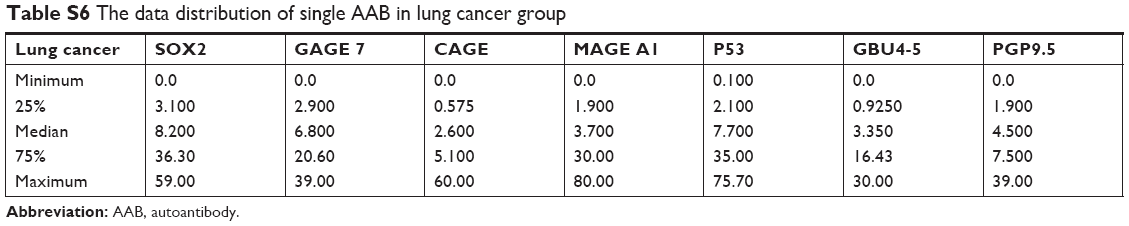 | Table S6 The data distribution of single AAB in lung cancer group |
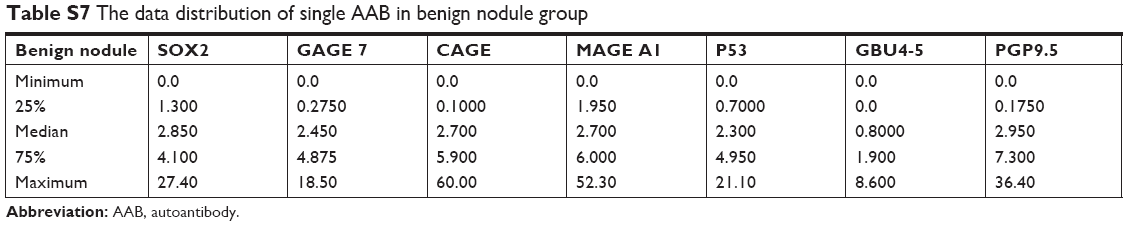 | Table S7 The data distribution of single AAB in benign nodule group |
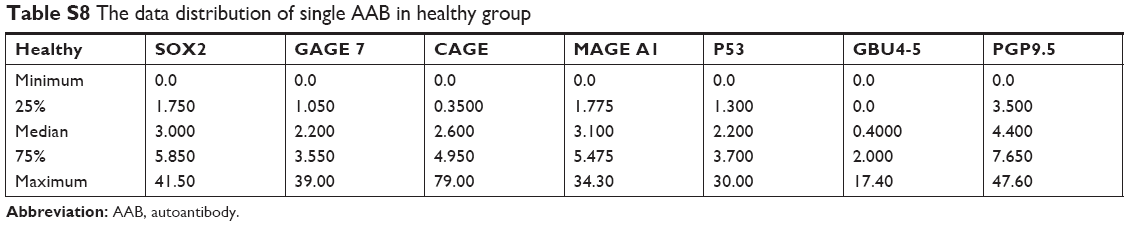 | Table S8 The data distribution of single AAB in healthy group |
 © 2019 The Author(s). This work is published and licensed by Dove Medical Press Limited. The
full terms of this license are available at https://www.dovepress.com/terms
and incorporate the Creative Commons Attribution
- Non Commercial (unported, 3.0) License.
By accessing the work you hereby accept the Terms. Non-commercial uses of the work are permitted
without any further permission from Dove Medical Press Limited, provided the work is properly
attributed. For permission for commercial use of this work, please see paragraphs 4.2 and 5 of our Terms.
© 2019 The Author(s). This work is published and licensed by Dove Medical Press Limited. The
full terms of this license are available at https://www.dovepress.com/terms
and incorporate the Creative Commons Attribution
- Non Commercial (unported, 3.0) License.
By accessing the work you hereby accept the Terms. Non-commercial uses of the work are permitted
without any further permission from Dove Medical Press Limited, provided the work is properly
attributed. For permission for commercial use of this work, please see paragraphs 4.2 and 5 of our Terms.