Back to Journals » Infection and Drug Resistance » Volume 15
Diagnostic Efficacy of T-SPOT.TB for Active Tuberculosis in Adult: A Retrospective Study
Authors Sun Y ![]() , Yao X, Ni Y, Peng Y, Shi G
, Yao X, Ni Y, Peng Y, Shi G
Received 3 September 2022
Accepted for publication 14 November 2022
Published 2 December 2022 Volume 2022:15 Pages 7077—7093
DOI https://doi.org/10.2147/IDR.S388568
Checked for plagiarism Yes
Review by Single anonymous peer review
Peer reviewer comments 2
Editor who approved publication: Professor Suresh Antony
Yidan Sun,1– 3,* Xiaozhou Yao,1– 3,* Yingmeng Ni,1– 3 Yibing Peng,4 Guochao Shi1– 3
1Department of Pulmonary and Critical Care Medicine, Ruijin Hospital, Shanghai Jiao Tong University School of Medicine, Shanghai, People’s Republic of China; 2Institute of Respiratory Diseases, Shanghai Jiao Tong University School of Medicine, Shanghai, People’s Republic of China; 3Shanghai Key Laboratory of Emergency Prevention, Diagnosis and Treatment of Respiratory Infectious Diseases, Shanghai, People’s Republic of China; 4Faculty of Medical Laboratory Science, Shanghai Jiao Tong University School of Medicine, Shanghai, People’s Republic of China
*These authors contributed equally to this work
Correspondence: Guochao Shi, Department of Respiratory and Critical Care Medicine, Ruijin Hospital, Shanghai Jiao Tong University School of Medicine, No. 197 Ruijin Er Road, Shanghai, 200025, People’s Republic of China, Tel +86-13918462035, Fax + 021-64314162, Email [email protected] Yibing Peng, Faculty of Medical Laboratory Science, Ruijin Hospital, Shanghai Jiao Tong University School of Medicine, No. 197 Ruijin Er Road, Shanghai, 200025, People’s Republic of China, Tel +86-13795243560, Email [email protected]
Purpose: To explore the diagnostic efficacy and optimal diagnosis threshold of T-SPOT.TB for active tuberculosis in adults and to evaluate the influential factors for T-SPOT.TB results.
Patients and Methods: A retrospective study of 1193 adult inpatients from April 2015 to March 2018 in Ruijin Hospital was conducted. All included patients underwent T-SPOT.TB assay, and were divided into two groups, active tuberculosis (ATB) and non-active tuberculosis (non-ATB) groups. Their demographic data, underlying diseases, personal history and laboratory findings were collected to calculate the diagnostic efficacy at different diagnosis thresholds and analyze the impact factors. Symptoms and imaging features of ATB patients were recorded and analyzed.
Results: A total of 114 ATB patients and 1079 non-ATB patients were included in the study, and ATB patients had a higher level of T-SPOT.TB than the non-ATB group. Sensitivity and specificity of T-SPOT.TB for diagnosing ATB are 78.95% and 68.58% as the threshold at 6sfu. In the diagnosis accordance curves, ESAT-6, CFP-10, and max (ESAT-6 or CFP-10) reached the plateau at 40sfu, while sum (ESAT-6 and CFP-10) reached the plateau at 70sfu. Multivariate logistic regression analysis showed that obsolescent tuberculosis (p=0.001), smoking history(p=0.005), diabetes(p=0.035) and advanced age (≥ 65 years old) (p=0.031) were risk factors for false-positive result of T-SPOT.TB. In terms of imaging features, logistic regression analysis suggested that the thin-wall cavitary lesion was the only feature associated with the result of T-SPOT.TB.
Conclusion: As for using T-SPOT.TB test to diagnose active tuberculosis, increased threshold could significantly elevate the diagnosis accordance. And we suggest that the threshold of T-SPOT.TB could be increased to 40sfu for diagnosing ATB. Attention should be paid when diagnose ATB in population with obsolescent tuberculosis, smoking history, diabetes and advanced age, for the risk of false-positive.
Keywords: T-SPOT.TB, active tuberculosis, diagnosis threshold
Introduction
Tuberculosis (TB) remains a critical public health concern and the leading cause of death worldwide. According to the WHO tuberculosis report, the COVID-19 pandemic resulted in under-diagnosed and under-reported tuberculosis. There remained about 9.87 million people newly diagnosed with tuberculosis, and tuberculosis had caused 1.28 million deaths worldwide among HIV-negative people in 2020.1 The number of tuberculosis patients in China ranks second in the world. As a high-incidence country of tuberculosis, early diagnosis of active tuberculosis (ATB) is essential for reducing the spread of tuberculosis.
Current methods for the diagnosis of tuberculosis suffer from numerous limitations. Acid-fast stain of pathogen has a low positive rate with a high false negative rate (FNR) and generates frequent false-positive results in several non-tuberculous mycobacteria. Although mycobacterium tuberculosis culture assay remains the gold standard for tuberculosis diagnosis, it is time-consuming for eight weeks and with low positive rate, which may cause delayed treatments. Histopathologic examination observing typical caseous necrosis can also confirm tuberculosis. But the invasive operation is not routinely used in diagnosis. Nontypical pathological features and negative acid-fast stains make it difficult to distinguish tuberculosis from sarcoidosis or non-tuberculosis mycobacteria (NTM) infection. Tuberculin skin test (TST) detects the tuberculosis infection by the immune response to tuberculin. But owing to cross-reactivity against other bacterial antigens and mass vaccination with Bacillus Calmette-Guerin (BCG) vaccine, TST is prone to present false positive result, and it takes 48–72 hours. Other methods such as detection of tuberculous antibody, PCR, Xpert MTB/RIF (Xpert) assay, and second-generation sequencing are insufficient for tuberculosis diagnosis or costly.
Interferon-gamma (IFN-γ) release assays (IGRAs) are based on the T-cell mediating IFN-γ release induced by specific M. tuberculosis (MTB) antigens. MTB-specific antigens mainly include early secretory antigenic target 6 (ESAT-6) and culture filtrate protein-10 (CFP-10). Genes that encode ESAT-6 and CFP-10 are located in the RD1 region, which is a deletion region in the BCG vaccine.2,3 Compared with TST, the largest advantage of IGRA is that the above two antigens are lacking in BCG and most non-tuberculous mycobacteria (NTM). Therefore, IGRA has higher specificity than TST in BCG vaccinated population, especially in BCG vaccinated children after 1 years old, and can exclude most NTM infections. QuantiFERON TB Gold in tube (QFT-Gold IT) (Cellestis, Carnegie, Australia), the QuantiFERON-TB Gold Plus (QFT-Plus) assay (Qiagen), and T-SPOT.TB (Oxford Immunotec, Abingdon, UK) are all commercial interferon-γ assays.4 Although the basic principles are similar, there remain differences between several commercial assays. QFT-Gold IT and QFT-Plus are both whole blood assay that use enzyme-linked immunosorbent (ELISA) to measure the IFN-γ release, but T-SPOT.TB is an enzyme-linked immunosorbent spot (ELISPOT) assay that uses peripheral blood mononuclear cells (PBMSs). Also, the antigens used to induce IFN-γ release are ESAT6 and CFP-10 in T-SPOT.TB, adding TB7.7 in QFT-Gold IT and TB2 in QFT-Plus.5 In China, T-SOPT.TB is approved and widely used for tuberculosis diagnosis. Nevertheless, the immune-based assay cannot distinguish ATB and latent infection. Therefore, considering the high prevalence of latent tuberculosis infection (LTBI), the WHO only recommends IGRA for the diagnosis of LTBI, not for the diagnosis of ATB.6 A meta-analysis also indicated that T-SOPT.TB and QFT-IT were both unstable in the diagnosis of tuberculosis.7 It has been observed that IGRAs showed moderately sensitive and highly specific to screen LITB within countries with low TB burden,8 but this finding was not generally applicable in high TB burden countries like China. In high TB burden areas, identification of ATB patients and treatment as early as possible is of particular importance.
However, simply dividing T-SPOT.TB results into two categories according to a single threshold would reduce its value as a continuous variable. The relationship among the results of T-SPOT.TB and tuberculosis activity has not been carefully investigated. It has been demonstrated that the T-SPOT.TB results of the ATB patients are significantly higher than that of the LTBI patients.9 Recent studies suggested that IGRA can distinguish ATB and non-ATB in the general population.10,11 We also observed that T-SPOT.TB had a high false positive rate for the diagnosis of ATB, for LTBI affecting the diagnostic efficacy of T-SPOT.TB due to the problematic diagnostic threshold (T-SPOT.TB >/=6 is positive, <6 is negative). More attention should be paid to the positive predictive value to diagnose ATB.
This study intended to select an optimal threshold for the diagnosis of ATB. And we further analyzed the relationship among T-SPOT.TB results and clinical features in ATB patients.
Materials and Methods
Study Population
A retrospective study of inpatient enrolled from the pulmonary and critical care medicine department, Ruijin Hospital, Shanghai Jiao Tong University between April 2015 and March 2018 were conducted. All the enrolled patients were required to meet the following inclusion criteria: older than 18 years, underwent T-SPOT.TB assay. Exclusion criteria were restricted to: unclear diagnosis, loss to follow-up, and in-hospital death with unidentified lesion. The initial T-SPOT.TB result is recorded.
Demographic (age and gender) and underlying disease, including diabetes, hypertension, cardiovascular and cerebrovascular diseases, pneumoconiosis, autoimmune diseases, asthma, COPD, pulmonary sarcoidosis, malignant tumors, venous thromboembolic diseases, hepatitis, cirrhosis, renal insufficiency, hypoproteinemia and HIV of enrolled patients were retrospectively collected. Venous thromboembolic diseases include pulmonary embolism and lower limb deep venous thrombosis, and autoimmune diseases mainly include ANCA-associated vasculitis, systemic lupus erythematosus, Sjogren’s syndrome, dermatomyositis, ankylosing spondylitis, rheumatoid syndrome, acute glomerulonephritis, hyperthyroidism, ulcerative colitis. Personal history included obsolescent tuberculosis, systemic corticosteroid usage or immunosuppressants, organ transplantation, radiotherapy and chemotherapy history, smoking history, and gastric surgery history. The use of systemic corticosteroid was defined as oral or intravenous glucocorticoid within 1 month. Immunosuppressants included: Cyclophosphamide, methotrexate, azathioprine, cyclosporine, tacrolimus, Mycophenolate Mofetil, leflunomide, and infliximab. Results of laboratory testing, including blood routine, CD cells and cytokines examination, were all taken from the results closest to the test date of T-SPOT.TB within one week before or after T-SPOT.TB.
Diagnosis Criteria and Classification
Confirmed active tuberculosis needed to meet one of the following criteria: (1) acid-fast stain test of sputum smears positive, (2) tuberculous culture positive, (3) molecular biological detection with tuberculous positive, and (4) pathological examination of lung tissue positive. If the patients did not meet the confirmed criteria, the clinical diagnosis could be made for active tuberculosis. Clinical diagnosis of active should meet all of the following criteria: (1) confirmed criteria were negative, (2) other diseases diagnosis was excluded, and (3) Anti-tuberculosis treatment is effective. Extrapulmonary tuberculosis only included lymph node tuberculosis in this study, and it was diagnosed according to local lymph node needle aspirated. And patient with the pathological examination of lymph node tissue by fine needle puncture confirmed tuberculosis or improved after anti-tuberculosis treatment was diagnosed with lymph node tuberculosis.
It should be noted that the term “non-ATB” refers to all patients except those with ATB, including non-tuberculosis patients, patients with obsolescent tuberculosis and LTBI. Patients with ATB should record whether they were bacteria-positive. Bacteria-positive tuberculosis was defined as positive acid-fast staining of sputum, bronchial brush or BALF smear, or positive mycobacterium culture. Obsolescent tuberculosis means patients with tuberculosis infection history, which included patients have previously been infected with tuberculosis and with stable image features indicated previous tuberculosis infection.
Systemic symptoms and pulmonary symptoms including fever, night sweats, poor appetite, wasting, cough, hemoptysis, and chest pain were recorded. The body temperature of the patient was measured upon admission, and imaging analysis was performed on patients who received chest CT in our hospital on the first visit.
T-SPOT.TB Test Technology
The T-SPOT.TB kit (T-SPOT.TB® produced by Oxford Immunotec Ltd) based on ELISpot was used to detect T cells secreting interferon-γ(IFN-γ) in peripheral blood of patients. The spot counts in A hole (ESAT-6) and B hole (CFP-10) were recorded respectively. The report of T-SPOT.TB contained: A hole result (spots count of A hole – spots count of negative control hole), B hole result (spots count of B hole – spots count of negative control hole), negative control hole result and positive control hole result. The threshold is set at 6sfu, as any of the spots count in A hole or B hole more than or equal to 6 was considered positive. If not indicated, T-SPOT.TB result refers to the larger one in A or B holes.
Chest Imaging
The chest images of pulmonary tuberculosis patients were analyzed by two experienced respiratory physicians using a double-blind method. Disagreements were resolved by discussion and consensus. Most of the patients were scanned by spiral CT with a layer thickness of 5mm and a layer distance of 5mm. One patient underwent HRCT (a layer thickness of 1mm and a layer distance of 5mm), and another underwent PET/CT. The range of involvement (lobar, unilateral/bilateral), consolidation, cavity, central lobular nodule, ground glass opacity, bronchiectasis, calcification, hilar/mediastinal lymph node enlargement, alveolar emphysema, atelectasis, fibrous cords, calcification and other imaging features were assessed. Four measurements of the diameter lines were shown in Figure 1.
 |
Figure 1 Illustration of measuring tuberculosis lesions on chest CT. (A) A 55-year-old male with nodules in the upper left lung and surrounding halo signs. The maximum measurable lesions were shown in the section. Long diameter was marked as blue line, and short diameter was marked as red line, as 2.620cm and 1.930cm respectively. (B) A 63-year-old male with large consolidation in the upper lobe of the right lung and air bronchogram. The maximum measurable lesions were shown in the section. Long diameter was marked as red line, and short diameter was marked as blue line, as 14.960cm and 10.280cm respectively. (C) A 25-year-old female with cavity tuberculosis in right lung, the size of the cavity was marked as green line, and the thinnest cavity wall was marked as Orange line, which is more than 3mm. (D) A 42-year-old male with cavity tuberculosis in left lung, the thinnest cavity wall was marked as Orange line, which is less than 3mm. |
Statistical Analysis
The following indicators were calculated to evaluating diagnosis effectiveness: true positives (TP), true negatives (TN), false negatives (FN), false positives (FP), sensitivity=TP/(TP+FN)*100%, specificity=TN/(TN+FP)*100%, positive predictive value (PPV)= TP/(TP+FP)*100%, and negative predictive value (NPV)=TN/(TN+FN)*100%, negative likelihood ratio (NLR)=(1-sensitivity)/specific, positive likelihood ratio (PLR)=sensitivity/(1-specificity), diagnosis accordance =(TP+TN)/(TP+FP+FN+TN)*100%. All statistical analyses were performed using SPSS 22.0. Qualitative data were represented by constituent ratio. Quantitative data were presented as median (P25, P75) or means ± standard deviations. T-test was used for data with normal distribution and homogeneity of variance. Mann–Whitney test was used for data that did not meet the above conditions or grade data. χ2 test was used to compare the rates, and if Fisher’s exact probability method was used, they were marked in the table Spearman correlation analysis was used for correlation analysis. The receiver operating characteristic curve (ROC curve) was drawn to evaluate the diagnostic efficacy of T-SPOT.TB in active tuberculosis. Binary Logistic regression was used to analyze the clinical features and indicators affecting the negative/positive risk of T-SPOT.TB. Odds ratio (OR) and 95% confidence interval (CI) were used to represent the relative risk. P values < 0.05 were considered to be statistically significant.
Results
Demographic Characteristics
Of all 1193 adult patients enrolled, 114 were active tuberculosis, and 1079 were non-active tuberculosis. The demographic and clinical characteristics of all enrolled patients were present in Table 1. Male (p=0.006), less than 65 years old (p=0.026), obsolescent tuberculosis (p=0.022), contact history with tuberculosis patients (p=0.025), smoking history (p=0.014) were observed more frequent, and hypertension (p<0.01), cancer (p<0.01), COPD (p=0.06) were observed less in ATB patients.
 |
Table 1 The Clinical Characteristic of All Enrolled Patients |
The T-SPOT.TB Result
The result of T-SPOT.TB: ESAT-6 and CFP-10 distributed extremely skewed (Figure 2A and B). The distribution range of ESAT-6 and CFP-10 were 0–98sfu and 0–121sfu respectively. The median of ESAT-6 and CFP-10 in ATB were 23(3.75, 38) sfu and 19(2, 55) sfu respectively, and in non-active tuberculosis were 0(0, 6) sfu and 0(0, 2) sfu. ESAT-6 and CFP-10 were observed higher in active tuberculosis than in non-active tuberculosis (p<0.001) (Figure 2C and D).
 |
Figure 2 Overview of T-SPOT.TB in diagnosis for tuberculosis. (A and B) The distribution of ESAT-6 and CFP-10 results of enrolled patients were shown, which is shewed extremely. (C and D) Spots count of ESAT-6 and CFP-10 are higher in ATB patients compare with non-ATB. The results of ESAT-6 and CFP-10 were both observed higher in active tuberculosis than non-active tuberculosis (p<0.001). (E) The ROC curve of ESAT-6 and CFP-10 for ATB. ESAT-6: AUC=0.788, 95% CI (0.739,0.837); CFP-10: AUC=0.794, 95% CI (0.744,0.844). (F) Max means the larger spots count in ESAT-6 or CFP-10: AUC=0.809, 95% CI (0.760 0.857). Min means the lowest spots count in ESAT-6 or CFP-10: AUC=0.788, 95% CI (0.737, 0.838). Sum means the spots count of ESAT-6 plus CFP-10: AUC=0.807, 95% CI (0.759, 0.856). Abbreviations: ATB, active tuberculosis; ESAT-6, early secretory antigenic target; CFP-10, culture filtrate protein-10; ROC, receiver operator characteristic; AUC, area under the curve; 95% CI, 95% confidence interval. |
Diagnostic Value of T-SPOT.TB for Active Tuberculosis
ROC curve for the diagnosis of active tuberculosis was drawn according to T-SPOT.TB (Figure 2E). The area under the curve (AUC) of ESAT-6 was 0.788, 95% CI (0.739, 0.837). Without following the threshold as 6sfu according to the kit, the optimal threshold calculated by the Youden index was 2.5sfu. The sensitivity, specificity and diagnostic accordance was 78.1%, 70.3% and 69.57% respectively. The area under the curve (AUC) of CFP-10 was 0.794, 95% CI (0.7440, 0.844). The optimal threshold calculated by the Youden index was 7.5sfu. The sensitivity, specificity and diagnostic accordance was 68.4%, 82.8% and 81.39% respectively.
To combine EAST-6 and CFP-10 for analysis, three additional indicators were set: max (ESAT-6 or CFP-10), min (ESAT-6 or CFP-10) and sum (ESAT-6+CFP-10), and the ROC curves were drawn (Figure 2F). The AUC and specificity of max were largest at the threshold of 18.5sfu calculated by the Youden index, with a diagnosis accordance of 83.07%, the sensitivity of 0.684, and the specificity of 0.846.
The current diagnostic criteria for T-SPOT.TB positive is ESAT-6 or CFP-10 ≥6sfu. The diagnostic sensitivity is high, although with a high false positive rate and suboptimal specificity. Several different integers thresholds were set, convenient for clinical application, to compare the sensitivity, specificity, positive predictive value, negative predictive value, and diagnostic accordance. As the threshold increases, the sensitivity decreases, the specificity increases, and the diagnosis accordance increases gradually, but the change was not obvious after the threshold reached 40sfu. The positive predictive value increased slowly when the threshold was between 40 and 80sfu and increased to 100% at the thresholds of 100sfu (Figure 3A and B). ESAT-6, CFP-10 and sum were also truncated at 20sfu intervals. The positive predictive value of ESAT-6 increased gradually from 21.76% to 50% but decreased to 44.44% at the threshold of 80sfu, and the diagnostic accordance reached 90.28% at the threshold of 40sfu, with little change after 40sfu (Figure 3C-H). The positive predictive value of CFP-10 kept rising, and the diagnostic accordance reached a plateau at 40sfu, reaching 90.28% (Figure 3).
 |
Figure 3 Positive predictive value and diagnose accordance rate changing with different thresholds of T-SPOT.TB. (A-H) positive predictive value and diagnose accordance rate changing with different cut-off value of T-SPOT.TB-max, ESAT-6, CFP-10, T-SPOT.TB-sum. (A and B) Max means the larger spots count in ESAT-6 or CFP-10. (C and D) The positive predictive value of ESAT-6 increased gradually from 21.76% to 50%, but decreased to 44.44% at 80sfu cutoff, and the diagnostic accordance rate reached 90.28% at 40sfu cutoff, with little change after 40sfu. (E and F) The positive predictive value of CFP-10 kept rising, and the diagnostic accordance rate reached a plateau at 40sfu, reaching 90.28%. (G and H) Sum means the spots count of ESAT-6 plus CFP-10. The diagnostic positive predictive value of sum was 58.62% at 120sfu cutoff, and the diagnostic accordance rate reached 90.78% at 80sfu. Abbreviation: PPV, positive predictive value. |
We further analyzed the relationship the sensitivity and specificity of T. SPOT.TB and the age or sex of the patients. As we calculated, the sensitivity and specificity were 0.11 and 0.69 in all population, 0.14 and 0.65 in male, and 0.07 and 0.74 in female respectively. We also divided the age into 9 groups, calculated the sensitivity and specificity of each group, respectively. The sensitivity and specificity of stratification by age were also analyzed using spearman test. The results indicated that sensitivity was significantly correlated with age (Spearman correlation: −0.908; p=0.01), but there was no significant correlation between specificity and age stratification (p=0.104).
Impact Factors of T-SPOT.TB Results
Among 1079 non-active tuberculosis patients, 339 were T-SPOT.TB positive and 740 were negative, as ESAT-6 or CFP-10 ≥6 was considered positive. Clinical features of T-SPOT.TB positive and negative groups were analyzed. Compared to the negative group, the T-SPOT.TB positive group had more male (p=0.002), advanced age (p=0.003), obsolescent tuberculosis (p<0.001=, smoking history(p=0.002), hypertension(p=0.009), and diabetes(p=0.009) (Table 2). Then ESAT-6 and CFP-10 were analyzed by the Mann–Whitney test respectively (Table 3). In addition, laboratory test results between the T-SPOT.TB positive and negative groups were analyzed (Table 4).
 |
Table 2 Clinical Characteristics of Non-Active Tuberculosis Patients |
 |
Table 3 The Relationship Between Clinical Features and Spot Count in Non-Active Tuberculosis Patients |
 |
Table 4 Laboratory Test Result of Non-Active Tuberculosis Patients |
With p<0.1 as the boundary, sex, age, previous tuberculosis infection, smoking history, hypertension, diabetes, cardiovascular and cerebrovascular diseases, autoimmune diseases, and hepatitis were included in the Logistic regression analysis. A total of 1079 patients were included in the Logistic regression analysis to evaluate the impact of the above factors on T-SPOT.TB results. The Logistic model was statistically significant (χ2=32.843, p<0.001=. Four independent variables were risk factors for T-SPOT.TB false positive: obsolescent tuberculosis, smoking history, diabetes, and age (Table 5).
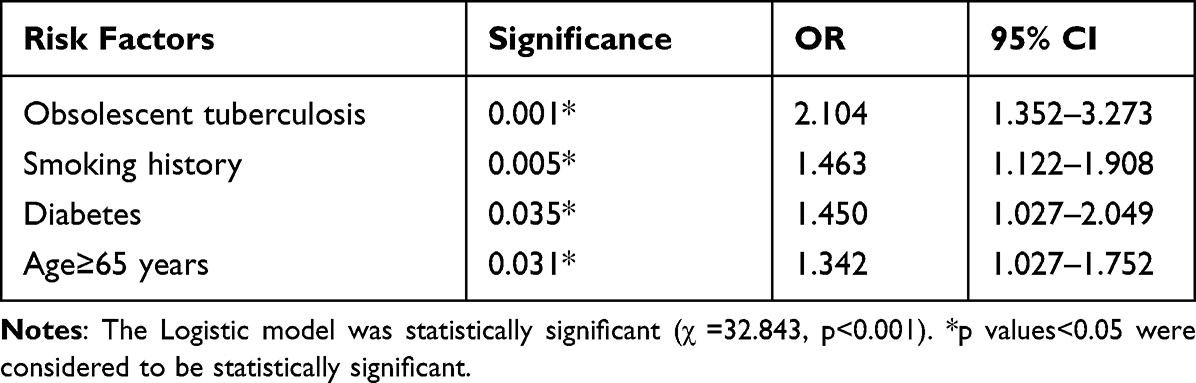 |
Table 5 Logistic Regression Analysis in Risk Factors of False Positive for T-SPOT.TB |
114 patients were active tuberculosis. Among them, 90 were T-SPOT.TB positive and 24 were negative, with no significant difference in age, sex, clinical diagnosis or confirmed, smear positive or negative between the two groups (Table 6). The Mann–Whitney test of ESAT-6 and CFP-10 suggested that the CFP-10 was lower in elderly, and previous tuberculosis infection patients. Patients with autoimmune diseases and using immunosuppressants were found to have lower ESAT-6 (p=0.050, p=0.049) or CFP-10 (p=0.047, p=0.053) results. The ESAT-6 of patients with hypoalbuminemia was lower (p=0.067) (Table 7). There was no significant difference between the T-SPOT.TB positive and negative groups in laboratory test results of active tuberculosis patients. Logistic regression analysis was conducted on 114 patients to evaluate the risk factors that lead to a false negative result, but there was no significance in the model (χ2=8.610, p=0.126).
 |
Table 6 Clinical Characteristics of Active Tuberculosis Patients |
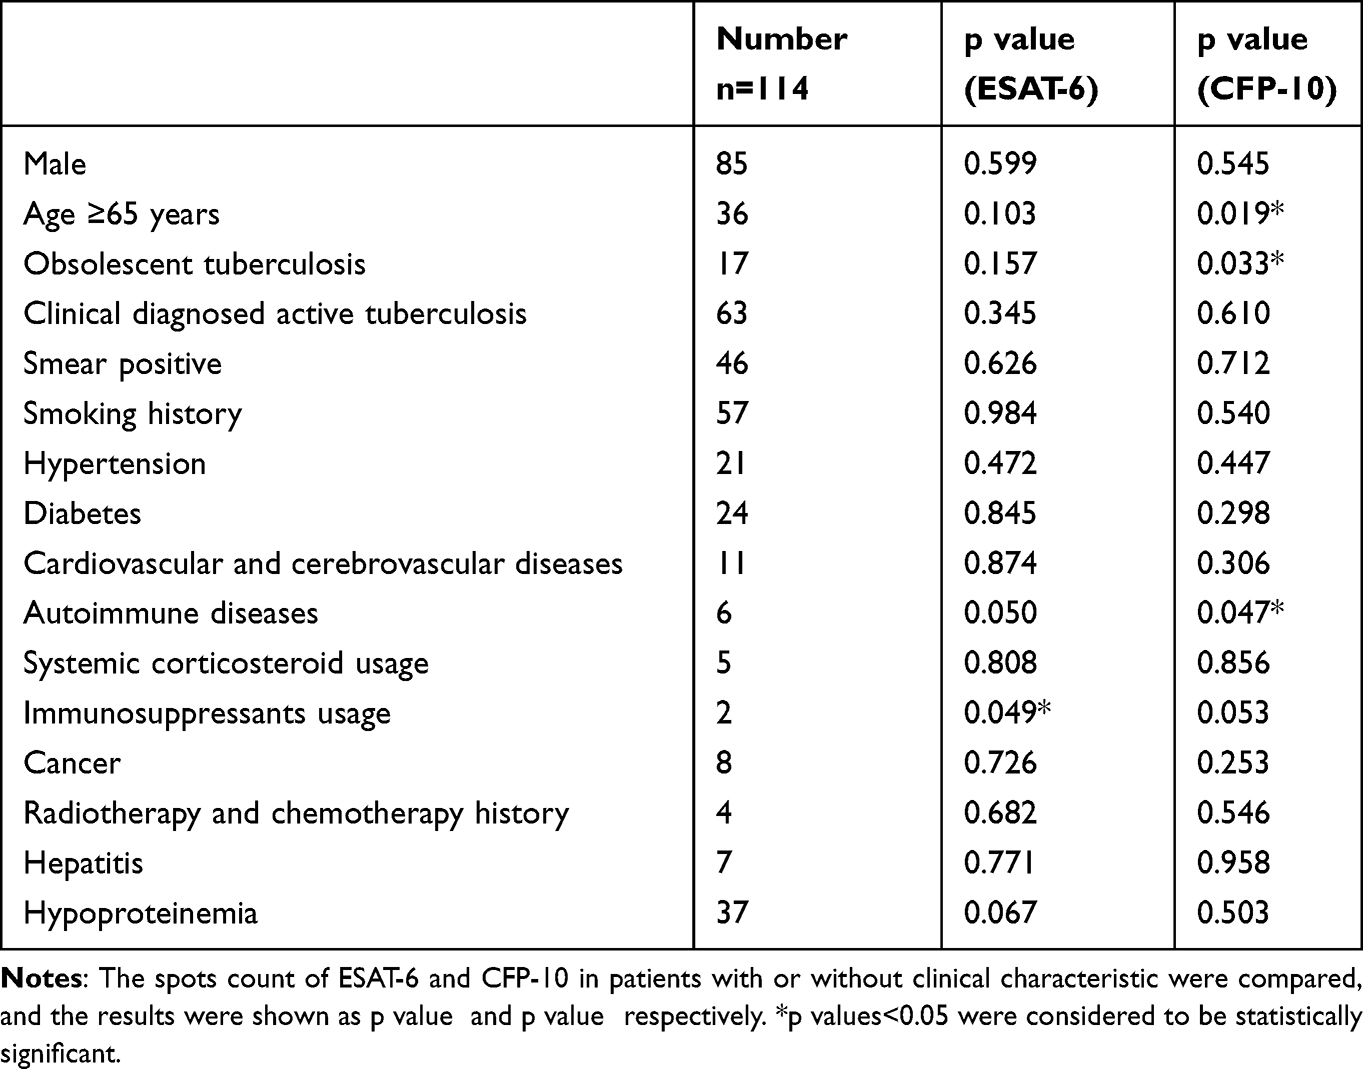 |
Table 7 The Relationship Between Clinical Features and Spots Count in Active Tuberculosis Patients |
Association Between T-SPOT.TB and Symptoms in Tuberculosis Patients
Among the 114 active tuberculosis patients, 103 of them had symptoms. The most common symptoms were cough (75 cases), hemoptysis or blood in the sputum (18 cases), chest tightness or chest pain (37 cases), fever (22 cases), night sweats (8 cases) and recent emaciation and anorexia (26 cases). There was no significant difference between the results of T-SPOT.TB in symptomatic patients and that in asymptomatic patients (p=0.060). The symptoms contained local symptoms (including cough, hemoptysis, chest tightness and chest pain) and systemic symptoms (including fever, night sweats, emaciation and anorexia). There were 93 people with local symptoms and 63 patients with systemic symptoms. Neither local nor systemic symptoms affected the result of T-SPOT.TB (Table 8 and Figure 4A).
 |
Table 8 The Relationship Between Symptoms and Spots Count in Active Tuberculosis Patients |
 |
Figure 4 The associations between clinical and image features and the results of T-SPOT.TB. (A) There was no significant difference between patients with or without symptoms and the results of T-SPOT.TB. (B) The number of patients involved 1–5 lobes were 36, 10, 8, 10, 22, respectively. Inter-group comparison showed no difference between 5 groups (p=0.965). (C) The 86 patients were divided into two groups according to the mean value of long and short diameter (D) of 3cm. There was no significant difference in T-SPOT.TB results between two groups of the mean value of long and short diameter (D) more than 3cm (n=20) or less than 3 cm (n=66) (p=0.168). (D) T-SPOT.TB in patients without thin-walled cavities is higher than patients with thin-walled cavities (p=0.024). |
Association Between T-SPOT.TB and Imaging in Tuberculosis Patients
Among the 114 active tuberculosis patients, except for military tuberculosis, tuberculous pleurisy and extrapulmonary tuberculosis, 92 patients were secondary pulmonary tuberculosis. For 6 patients without complete image data, 1 combined pulmonary fungal infection and 1 complicated pulmonary cancer, the evaluation of imaging features of tuberculosis infection were disturbed. Therefore, the chest images of 86 patients were analyzed. 42 of them had lesions involving the unilateral lungs, and 44 of them had lesions involving bilateral lungs. In addition, 36 cases involved 1 lobe, 10 cases involved 2 lobes, 8 cases involved 3 lobes, 10 cases involved 4 lobes, and 22 cases involved all 5 lobes. There was no relationship between T-SPOT.TB and number of diseased lung lobes or the size of lesion (Figure 4B and C).
The relationship between T-SPOT.TB and image features were analyzed (Table 9). The T-SPOT.TB results of patients with atelectasis were higher than patients without atelectasis (p=0.031), and no significant difference between patients with or without cavities (p=0.898). But further analysis of the wall thickness of cavities showed that T-SPOT.TB in patients without thin-walled cavities is higher than in patients with thin-walled cavities (p=0.024) (Figure 4D). In 35 patients with cavities, the size of cavities showed no relationship with TSPOT.TB (p=0.438). Logistic regression analysis included atelectasis, alveolar emphysema, and the thin-walled cavity was conducted (χ2=6.324, p=0.012), and only the thin-walled cavity was left in the model, p=0.025, OR=0.153, 95% CI (0.030–0.786).
 |
Table 9 The Relationship Between Image Features and Spots Count in Active Tuberculosis Patients |
Discussion
IFN-γ release assays as an immune-based assay to detect tuberculosis infection, only recommended by WHO as diagnosis criteria of LTBI. A study suggested that IGRA had a better predictive ability of LTBI than TST.12 However, a meta-analysis showed the pooled sensitivity of QFT-GIT, T-SPOT.TB and TST in the diagnosis of ATB was 0.842 (95% CI 0.811, 0.870), 0.840 (CI 0.814, 0.864) and 0.665 (CI 0.635, 0.693), and the specificity was 0.745 (95% CI 0.715, 0.775), 0.658 (CI 0.621, 0.693) and 0.633 (CI 0.605, 0.661), respectively.13 It can be seen that compared with TST, IGRAs had the advantage in the diagnosis of active tuberculosis. We acknowledged that unlike T-SPOT.TB only counted the spots number, QFT enabled quantification of the released IFN-γ by ELISA. So, QFT may have higher specificity than T-SPOT.TB. However, another study conducted in China proved that no significant difference was observed between QFT-Plus and T-SPOT.TB for diagnosing ATB in febrile patients.14 Also, T-SPOT.TB was approved for tuberculosis diagnosis in China. In this study, we focused on the T-SPOT.TB test and observed that the number of ESAT-6 and CFP-10 spots in ATB patients was significantly higher than that in non-ATB patients (p<0.001).
The recommendation of IGRA as diagnosis criteria of LTBI may be useful to screen LTBI in low-incidence areas of tuberculosis.15 Unlike ATB, which was contagious and required immediate treatment, LTBI patients did not need treatment. Therefore, in high-incidence areas of tuberculosis with a mass of LTBI patients, it is more valuable to distinguish ATB. However, the T-SPOT.TB test had a sensitivity of 73.9% (95% CI: 60–84%), specificity of 57.8% (95% CI: 47–67%), and accuracy of 63.2% to diagnose ATB.16 Our statistic also showed when T-SPOT.TB was used to diagnose ATB at the threshold at 6sfu, the sensitivity was 0.790, and the specificity was 0.686. However, the PPV was only 20.98%, with a medium diagnostic accordance of 69.57%. The low specificity and accuracy of T-SPOT test resulted in misdiagnosis of non-ATB patients to ATB. We assumed that the diagnostic thresholds of T-SPOT.TB should be adjusted, and we further analyzed the diagnostic efficacy at different thresholds.
We calculated the diagnostic threshold based on the Youden Index and found the ROC curves of max and sum were superior to min and ESAT-6/CFP-10. When max was used for diagnosis, good sensitivity and specificity were reached as threshold at 18.5sfu. However, in practical applications, more attention was paid to the specificity, positive predictive value and diagnostic accordance, and the thresholds determined by Youden Index were out of satisfaction. So, we further explored the optimal thresholds by setting different integers cut off, as to facilitate memory and clinical application. The diagnostic accordance curves of ESAT-6, CFP-10, max, min and sum to diagnose ATB were all observed to have steep rise, gentle rise and plateau stages. When thresholds of both ESAT-6 and CFP-10 at 40sFU, the diagnostic accordance reaches 90.28%, and then entered the plateau. At this point, increasing the thresholds had little effect on the accordance. The accordance of max and sum entered the plateau at 90.36% and 90.78% with thresholds at 40sfu and 70sfu, respectively. However, the determination of the diagnostic threshold is complicated. The higher the threshold was, the specificity, positive predictive value and diagnostic accordance were improved, but the sensitivity was lower, and more patients were diagnosed to be false negative. The positive value increased with the threshold increasing. But as the number of positive patients decreased with the higher threshold, the trend of the PPV in the latter part is unstable And we observed several PPV curves lack of plateau stage, so it was difficult to determine a reasonable threshold. Therefore, we selected the threshold as the diagnostic accordance entered the plateau, which minimized the damage to sensitivity and guaranteed a high diagnostic accordance, with high specificity and PPV. Therefore, we suggested that a threshold of ESAT-6 or CFP-10≥40sfu or the sum≥70sFU can replace the current diagnostic criteria and better distinguish ATB and non-ATB.
The main challenge in the diagnosis of tuberculosis is that traditional tests such as acid-fast stain test of sputum smears and tuberculous culture cannot detect positive cases with low bacillary load and subclinical. Other detection such as paracentesis and bronchoscopy are invasive. Indeed, the relationship between the bacillary load and T-SPOT.TB results is still unclear. And most subclinical patients were considered tuberculosis only owing to image abnormalities. However, the T-SPOT.TB test had a high sensitivity and low specificity to diagnose ATB. The low specificity and accuracy of T-SPOT.TB test resulted in misdiagnosis of non-ATB patients to ATB. As the threshold increased, the sensitivity may decrease and cause missed diagnosis. But it could increase the specificity to 95.09% and diagnosis accordance to 90.36%. Considering the high TB burden in China and the long duration and the risk of side effects of treatments for tuberculosis, the elevated specificity could help to better distinguish ATB from non-ATB patients, and avoid the inappropriate treatment for non-ATB patients. Such a non-invasive peripheral blood biomarker could be used to stratify patients to further intrusive investigations to find more definitive evidence for tuberculosis diagnosis.
In non-ATB patients, elderly patients had a higher positive rate, which is consistent with the previous study.17 Another study observed a positive rate of T-SPOT.TB was up to 41.91% in patients over 66 years old.18 The elder were more likely to be exposed to tubercule bacilli, and more latent infections. Although the immune level in elderly patients was lower, the T cell (especially CD8+ T) counts were less, weakening the immune response and reducing the proliferation activity of T cells,19 thus reducing the sensitivity of IGRA.20 However, due to more LTBI, the elder had higher T-SPOT.TB level as a whole. Several studies conducted in China observed elder as a risk factor for false-negative results of T-SPOT.TB, which could be complementary to our study.21–23 We also analyzed the risk factors for false-negative results using logistic regression analyses in ATB patients, but we got a negative result. This may be partly due to the limited sample size of ATB patient in our study. These together indicated that T-SPOT.TB was not recommended using to diagnose ATB in elder patients owing to both high risk for false-negative and false-positive results. High positive rate of T-SPOT.TB was also observed in patients with obsolescent tuberculosis. Obsolescent tuberculosis produced memory T cells, and the response of memory T cells to T-specific antigens would gradually decline over time,24 but still showed higher reactivity to tuberculosis-specific antigens than non-tuberculosis infection and LTBI. Smoking is a risk factor for LTBI, and countries with a high incidence of TB also have a high proportion of smokers.25 Several studies demonstrated that the function of T cells in smokers was impaired, the immune response ability of alveolar macrophages declined, and the proliferation of T cells secreting IFN-γ is inhibited.26 Those changes were not completely reversible after smoking cessation.27 Diabetes patients were prone to pulmonary infection, including tuberculosis, which is related to the damage of type 1 helper T cells (Th1).28 So, patients with a smoking history and diabetes had higher T-SPOT.TB level. The low immune response condition may bring these individual a very high risk of infecting tuberculosis, resulted in high prevalence of LTBI in them. The T-SPOT.TB test may be positive in LTBI patients. It has been proved that LTBI prevalence is highest in the older population, reflecting greater lifetime exposure to infection and TB incidence has been shown to increase with age.29,30 LTBI prevalence exceeds 25% in elderly patients with poorly controlled DM.31 Meanwhile elder patients may have higher prevalence of DM and obsolescent tuberculosis. Another study proved that the T-SPOT.TB had a high performance in the diagnosis of ATB in a lower risk of TB infection population such as the general population, but in the high risk of TB infection populations is not reliable due to the interference by LTBI.32 This finding is consistent with our result. Obsolescent tuberculosis, smoking history, diabetes, and advanced age were all found to be risk factors for false positive results of T-SPOT.TB. When T-SPOT.TB was used to diagnose ATB, the risk of false positives for T-SPOT.TB increased by 110.4% in patients with previous TB history, 46.3% in smokers, 45% in diabetes, and 34.2% in the elder. Therefore, the diagnosis of T-SPOT.TB in the elder, patients with a smoking history, diabetes, and obsolescent tuberculosis should be more cautious. When T-SPOT.TB test was used to diagnose ATB in these populations, attentions must be given to possible interference by LTBI.
There were some limitations in this study. Acid-fast staining could not identify the species, which may be mixed with NTM. T-SPOT.TB assay had cross-reaction with Mycobacterium kansasii, Mycobacterium marinum and Mycobacterium szulgai, which may cause false positives. 127 patients were not enrolled for failing to follow up or death before diagnosis was identified, which reduced the sample size. We did not correlate the results obtained with the results of another IGRA test or a tuberculin test. For the reason that we only conducted T-SPOT.TB test in our hospital, and rarely applied tuberculin test for its cross-reactivity against BCG vaccine. There was a significant correlation between the results of T-SPOT.TB and the immune status of patients. However, as a retrospective study, some patients had missing data on immune cell (CD3/4/8) counts. All enrolled patients were hospitalized in the pulmonary and critical care medicine department, so we mainly focused on pulmonary tuberculosis, which might cause biases. The concept of the maximum measurable lesion is introduced in imaging features analysis, but most of the tuberculosis lesions were an irregular shape, which may cause measurement errors.
As the threshold increased, the specificity of T-SPOT.TB to diagnose ATB was also higher. We found that it can better distinguish ATB from non-ATB when the threshold was set at ESAT-6≥40sfu or CFP-10≥40sfu or the sum≥70sfu. The new threshold would help the early diagnosis of ATB. Higher T-SPOT.TB results suggested that attention should be paid to finding diagnostic proof of ATB.
Conclusion
In summary, T-SPOT.TB is not only a diagnostic tool for LTBI but also had auxiliary diagnostic value for active tuberculosis. The threshold of T-SPOT.TB could be increased to 40sfu for diagnosing active tuberculosis, with elevated specificity and diagnosis accordance. When treated T-SPOT.TB positive patients with obsolescent tuberculosis, smoking history, diabetes, and advanced age (≥65 years old), more attention should be paid to distinguish ATB for the risk of false-positive. The diagnosis of T-SPOT.TB for ATB needs further research for verification.
Abbreviations
TB, tuberculosis; ATB, active tuberculosis; PTB, pulmonary tuberculosis; MTB, mycobacterium tuberculosis; NTM, nontuberculous mycobacteria; WHO, World Health Organization; BCG, Bacillus Calmette-Guerin; LTBI, latent tuberculosis infection; TST, tuberculin skin test; IGRA, interferon-γ release assay; ELISA, enzyme-linked immunosorbent assay; PBMCs, peripheral blood mononuclear cells; ESAT-6, early secretory antigenic target; CFP-10, culture filtrate protein-10; IFN-γ, Interferon-γ; Th1, Type 1 helper T cell; IL, Interleukin; M, Macrophage; PPV, positive predictive value; NPV, negative predictive value; Se, sensitivity; Sp, specificity; NLR, negative likelihood ratio; PLR, positive likelihood ratio; ROC, receiver operator characteristic; AUC, Area Under the Curve; OR, odds ratio.
Ethics Statement
The study was approved by The Research Ethics Commission of Ruijin Hospital. This study complied with the Declaration of Helsinki. Owing to the retrospective nature of the study, we only reviewed the medical records and all identifiable personal information was removed for privacy protection. So, patient consent for inclusion was waived.
Funding
This study was funded by Shanghai Municipal Key Clinical Specialty (shslczdzk02202); Shanghai Key Laboratory of Emergency Prevention, Diagnosis and Treatment of Respiratory Infectious Diseases (20dz2261100); Shanghai Municipal Health Commission (2019SY006); and National Natural Science Foundation of China (81970020, 8217010230).
Disclosure
The authors declare that they have no competing interests.
References
1. WHO. Global Tuberculosis Report. WHO; 2021.
2. Mahairas GG, Sabo PJ, Hickey MJ, et al. Molecular analysis of genetic differences between Mycobacterium bovis BCG and virulent M. bovis. J Bacteriol. 1996;178(5):1274–1282. doi:10.1128/jb.178.5.1274-1282.1996
3. Sørensen AL, Nagai S, Houen G, et al. Purification and characterization of a low-molecular-mass T-cell antigen secreted by Mycobacterium tuberculosis. Infect Immun. 1995;63(5):1710–1717. doi:10.1128/iai.63.5.1710-1717.1995
4. Pai M, Riley LW, Colford JM. Interferon-γ assays in the immunodiagnosis of tuberculosis: a systematic review. Lancet Infect Dis. 2004;4(12):761–776. doi:10.1016/S1473-3099(04)01206-X
5. Januarie KC, Uhuo OV, Iwuoha E, et al. Recent advances in the detection of interferon-gamma as a TB biomarker. Anal Bioanal Chem. 2021;414(2):907–921. doi:10.1007/s00216-021-03702-z
6. Dheda K, van Zyl Smit R, Badri M, et al. T-cell interferon-gamma release assays for the rapid immunodiagnosis of tuberculosis: clinical utility in high-burden vs. low-burden settings. Curr Opin Pulm Med. 2009;15(3):188–200. doi:10.1097/MCP.0b013e32832a0adc
7. Lu P, Chen X, Zhu LM, et al. Interferon-Gamma Release Assays for the Diagnosis of Tuberculosis: a Systematic Review and Meta-analysis. Lung. 2016;194(3):447–458. doi:10.1007/s00408-016-9872-5
8. Kahwati LC, Feltner C, Halpern M, et al. Primary Care Screening and Treatment for Latent Tuberculosis Infection in Adults: evidence Report and Systematic Review for the US Preventive Services Task Force. JAMA. 2016;316(9):970–983. doi:10.1001/jama.2016.10357
9. Janssens JP, Roux-Lombard P, Perneger T, et al. Quantitative scoring of an interferon-gamma assay for differentiating active from latent tuberculosis. Eur Respir J. 2007;30(4):722–728. doi:10.1183/09031936.00028507
10. Ai L, Feng P, Chen D, et al. Clinical value of interferon-γ release assay in the diagnosis of active tuberculosis. Exp Ther Med. 2019;18(2):1253–1257. doi:10.3892/etm.2019.7696
11. Haas MK, Belknap RW. Diagnostic Tests for Latent Tuberculosis Infection. Clin Chest Med. 2019;40(4):829–837. doi:10.1016/j.ccm.2019.07.007
12. Zhou G, Luo Q, Luo S, et al. Interferon-γ release assays or tuberculin skin test for detection and management of latent tuberculosis infection: a systematic review and meta-analysis. Lancet Infect Dis. 2020;20(12):1457–1469. doi:10.1016/S1473-3099(20)30276-0
13. Lu P, Chen X, Zhu LM, et al. Interferon-Gamma Release Assays for the Diagnosis of Tuberculosis: a Systematic Review and Meta-analysis. Lung. 2016;194(3):447–458.
14. Zhang L, Yang Z, Bao X, et al. Comparison of diagnostic accuracy of QuantiFERON-TB Gold Plus and T-SPOT.TB in the diagnosis of active tuberculosis in febrile patients. J Evid Based Med. 2022;15(2):97–105. doi:10.1111/jebm.12477
15. Kahwati LC, Feltner C, Halpern M, et al. Primary Care Screening and Treatment for Latent Tuberculosis Infection in Adults: evidence Report and Systematic Review for the US Preventive Services Task Force. JAMA. 2016;316(9):970–983.
16. Boyd AE, Ashcroft A, Lipman M, et al. Limited added value of T-SPOT.TB blood test in diagnosing active TB: a prospective Bayesian analysis. J Infect. 2011;62(6):456–461. doi:10.1016/j.jinf.2011.04.003
17. Gao L, Lu W, Bai L, et al. Latent tuberculosis infection in rural China: baseline results of a population-based, multicentre, prospective cohort study. Lancet Infect Dis. 2015;15(3):310–319. doi:10.1016/S1473-3099(14)71085-0
18. Ma Y, Li R, Shen J, et al. Clinical effect of T-SPOT.TB test for the diagnosis of tuberculosis. BMC Infect Dis. 2019;19(1):993. doi:10.1186/s12879-019-4597-8
19. Tavares SM, Junior Wde L, Lopes ESMR. Normal lymphocyte immunophenotype in an elderly population. Rev Bras Hematol Hemoter. 2014;36(3):180–183. doi:10.1016/j.bjhh.2014.03.021
20. Kamiya H, Ikushima S, Kondo K, et al. Diagnostic performance of interferon-gamma release assays in elderly populations in comparison with younger populations. J Infect Chemother. 2013;19(2):217–222. doi:10.1007/s10156-012-0480-x
21. Yang C, Zhang S, Yao L, et al. Evaluation of risk factors for false-negative results with an antigen-specific peripheral blood-based quantitative T cell assay (T-SPOT((R)). TB) in the diagnosis of active tuberculosis: a large-scale retrospective study in China. J Int Med Res. 2018;46(5):1815–1825. doi:10.1177/0300060518757381
22. Shangguan Y, Fang H, Wang S, et al. Risk factors for negative T-SPOT.TB assay results in patients with confirmed active tuberculosis: a retrospective study. J Infect Dev Ctries. 2020;14(11):1288–1295. doi:10.3855/jidc.12063
23. Pan L, Jia H, Liu F, et al. Risk factors for false-negative T-SPOT.TB assay results in patients with pulmonary and extra-pulmonary TB. J Infect. 2015;70(4):367–380. doi:10.1016/j.jinf.2014.12.018
24. Mori T, Harada N, Higuchi K, et al. Waning of the specific interferon-gamma response after years of tuberculosis infection. Int J Tuberc Lung Dis. 2007;11(9):1021–1025.
25. Bai X, Stitzel JA, Bai A, et al. Nicotine Impairs Macrophage Control of Mycobacterium tuberculosis. Am J Respir Cell Mol Biol. 2017;57(3):324–333. doi:10.1165/rcmb.2016-0270OC
26. Feng Y, Kong Y, Barnes PF, et al. Exposure to cigarette smoke inhibits the pulmonary T-cell response to influenza virus and Mycobacterium tuberculosis. Infect Immun. 2011;79(1):229–237. doi:10.1128/IAI.00709-10
27. O’Leary SM, Coleman MM, Chew WM, et al. Cigarette smoking impairs human pulmonary immunity to Mycobacterium tuberculosis. Am J Respir Crit Care Med. 2014;190(12):1430–1436. doi:10.1164/rccm.201407-1385OC
28. Yamashiro S, Kawakami K, Uezu K, et al. Lower expression of Th1-related cytokines and inducible nitric oxide synthase in mice with streptozotocin-induced diabetes mellitus infected with Mycobacterium tuberculosis. Clin Exp Immunol. 2005;139(1):57–64. doi:10.1111/j.1365-2249.2005.02677.x
29. Miramontes R, Hill AN, Yelk Woodruff RS, et al. Tuberculosis Infection in the United States: prevalence Estimates from the National Health and Nutrition Examination Survey, 2011-2012. PLoS One. 2015;10(11):e0140881. doi:10.1371/journal.pone.0140881
30. Hochberg NS, Horsburgh CR. Prevention of tuberculosis in older adults in the United States: obstacles and opportunities. Clin Infect Dis. 2013;56(9):1240–1247. doi:10.1093/cid/cit027
31. Huang HL, Huang WC, Lin KD, et al. Completion Rate and Safety of Programmatic Screening and Treatment for Latent Tuberculosis Infection in Elderly Patients With Poorly Controlled Diabetic Mellitus: a Prospective Multicenter Study. Clin Infect Dis. 2021;73(6):e1252–e1260. doi:10.1093/cid/ciab209
32. Zhu C, Liu Z, Li Z, et al. The performance and limitation of T-SPOT.TB for the diagnosis of TB in a high prevalence setting. J Thorac Dis. 2014;6(6):713–719. doi:10.3978/j.issn.2072-1439.2014.04.38
 © 2022 The Author(s). This work is published and licensed by Dove Medical Press Limited. The
full terms of this license are available at https://www.dovepress.com/terms
and incorporate the Creative Commons Attribution
- Non Commercial (unported, 3.0) License.
By accessing the work you hereby accept the Terms. Non-commercial uses of the work are permitted
without any further permission from Dove Medical Press Limited, provided the work is properly
attributed. For permission for commercial use of this work, please see paragraphs 4.2 and 5 of our Terms.
© 2022 The Author(s). This work is published and licensed by Dove Medical Press Limited. The
full terms of this license are available at https://www.dovepress.com/terms
and incorporate the Creative Commons Attribution
- Non Commercial (unported, 3.0) License.
By accessing the work you hereby accept the Terms. Non-commercial uses of the work are permitted
without any further permission from Dove Medical Press Limited, provided the work is properly
attributed. For permission for commercial use of this work, please see paragraphs 4.2 and 5 of our Terms.