Back to Journals » OncoTargets and Therapy » Volume 10
Diagnostic and prognostic values of contrast-enhanced ultrasound in breast cancer: a retrospective study
Authors Zhao YX, Liu S, Hu YB, Ge YY, Lv DM
Received 7 October 2016
Accepted for publication 17 December 2016
Published 22 February 2017 Volume 2017:10 Pages 1123—1129
DOI https://doi.org/10.2147/OTT.S124134
Checked for plagiarism Yes
Review by Single anonymous peer review
Peer reviewer comments 2
Editor who approved publication: Dr Samir Farghaly
Yi-Xuan Zhao, Shuang Liu, Yan-Bing Hu, Yan-Yan Ge, Dong-Mei Lv
Department of Ultrasound, Second Hospital, Jilin University, Changchun, People’s Republic of China
Abstract: This study aimed to explore the diagnostic and prognostic values of contrast-enhanced ultrasound (CEUS) in breast cancer. Between September 2009 and October 2011, a total of 143 breast cancer patients and 161 healthy people were selected as case group and control group, respectively. After the identification of lesions by conventional ultrasound, all patients underwent CEUS. The CEUS images were analyzed, and time–intensity curves (TICs) were obtained. Hematoxylin–eosin and immunohistochemistry staining was performed on tissue specimens, according to which the expressions of estrogen receptor (ER), c-erb-B2, p53, and Ki-67 were measured. Multivariate logistic regression analysis was used to compare CEUS and TIC parameters between the two groups. Compared with the control group, cancer patients showed high enhancement, heterogeneous enhancement or defects in the central region, expansion of lesion diameter after enhancement and crab-like blur lesion edges. The peak intensity (PI), relative start time of enhancement, relative PI, and relative area under the curve in the case group were significantly higher than those in the control group. Logistic analysis showed that the uniformity of enhancement, expansion of lesion diameter, and relative PI were significant diagnostic parameters of breast cancer, with area under the curve being 0.798, 0.776, and 0.919, respectively. There were strong associations between CEUS characteristics and expressions of prognostic factors in breast cancer: the heterogeneous enhancement was common in c-erb-B2-positive tumors; the centripetal enhancement occurred more in ER-negative tumors; perforator vessels were often seen in tumors at high histological grade; perfusion defects were common in ER-negative, c-erb-B2-positive, and Ki-67-positive tumors. CEUS is a useful tool for the early diagnosis and prognosis of breast cancer.
Keywords: contrast-enhanced ultrasound, breast cancer, diagnosis, prognosis
Introduction
Breast cancer is a heterogeneous disorder and currently is the most common malignancy in females.1 Systemic symptoms of breast cancer generally include hot flashes, insomnia, and mood changes, while its local symptoms include urogenital atrophy and vaginal dryness.2 So far, the etiology of breast cancer has not been fully understood, but it was discovered that the development of breast cancer is associated with genetic and environmental factors as well as obesity, while hormone replacement therapy may also lead to breast cancer.3–5 At present, traditional methods, such as sentinel lymph node biopsy, are typically used to determine the staging of breast cancer, but they are associated with high cost and technical complexity.6 A new technology named contrast-enhanced ultrasound (CEUS) provides an earlier assessment of intrahepatic cholangiocarcinoma and hepatocellular carcinoma, as well as providing a prediction of neoadjuvant chemotherapy efficiency.7
By using the first generation of contrast agents, CEUS increases the Doppler signal, the display of blood flow and reveals perfusion characteristics in tumor.8 In combination with high-resolution ultrasound equipment and improved ultrasound contrast agents, CEUS has been helpful in studies of tumor angiogenesis on the microcirculation level.8 CEUS is more sensitive to hypoperfusion in normal and abnormal tissues compared with conventional Doppler ultrasound, and is an effective, as well as noninvasive diagnostic tool for disease detection.9 CEUS uses abnormal blood perfusion or blood vessel filling patterns to diagnose a disease.10 It is also a topical drug delivery method and has been applied in the treatment of prostate cancer, in which CEUS could use the contrast imaging to timely evaluate treatment efficacy, guide the fiber placement, adjust to appropriate therapy, and ensure its safety and efficiency.11 However, there are few studies that have explored the application of CEUS in the diagnosis of breast cancer. This article studied whether CEUS can help the diagnosis and prognosis of breast cancer.
Materials and methods
Ethics statement
This study was performed in accordance with the approval and guidelines from Medicine Ethics Review Committee at Second Hospital, Jilin University, and all information was collected after written informed consents were obtained from all patients.
Study subjects
From September 2009 to October 2011, 143 breast cancer patients in Second Hospital, Jilin University, underwent ultrasonography or CEUS and a complete record of medical information was obtained from each patient. The patients had no blood relationship with each other. All breast cancer patients received their first confirmed histopathologic diagnosis at our department. The inclusion criteria were as follows: 1) newly diagnosed breast cancer with pathological verifications; 2) no history of cancer in other organs; 3) no antitumor therapy before the blood samples were collected; 4) a complete record of baseline information; 5) not restricted by age, pathological type, and stage of disease; and 6) no antitumor therapy prior to CEUS. The exclusion criteria were as follows: 1) allergic to sulfur hexafluoride; 2) pulmonary and heart diseases or respiratory distress; 3) severe liver and kidney dysfunctions; and 4) during the period of pregnancy or breastfeeding. A total of 161 healthy people with no history of cancer obtaining CEUS examination during the same period at the hospital were selected as the control group. The case and control groups were matched for overall age, age at menarche, age at menopause, fertility profiles, residence, ethnicity, and family history of diseases.
CEUS procedures
The detection procedures of CEUS were as follows. Patients were lying in a supine position with bilateral upper limbs pointing up to fully expose their breasts and bilateral axillae. The conventional ultrasound mode was first used to examine both breasts from the edge of breast to the nipple in a continuous scanning pattern. The nipple was considered as the center, followed by the entire breast being scanned in a clockwise direction starting from the outer quadrant. Multislice scanning was focused on suspicious lesions, and the results were compared with the contralateral breast. The lesion location, shape, size, border profile, and internal echo were recorded and compared with the surrounding tissues. CEUS of lesions were performed using two equipments: the iU22 color Doppler ultrasound machine (Philips, Amsterdam, the Netherlands) and the Mylab Twice color Doppler ultrasound machine (Esaote, Switzerland). The probe type and frequency of the iU22 machine were L9-3 linear array and 7.5 MHz, respectively, and pulse-inversion harmonic imaging with a mechanical index of 0.06–0.08 was used. The Mylab Twice machine used a linear array probe with a frequency of 7.5 MHz, in which contrast-tuned imaging with a mechanical index of 0.06–0.08 was adopted. After changing to the CEUS mode, the diluted SonoVue contrast agent (Bracco, Italy) was continuously shaken for 30 s, and 4.8 mL of which was injected into the median cubital vein of each patient. Next, 5 mL of normal saline was used to wash the injection syringe. Then the scanning direction was adjusted again so that the image could capture both the tumor and the surrounding normal tissues, followed by shaking of the diluted SonoVue, a second vein injection of 3 mL SonoVue to patients, washing with 5 mL of saline, and 3 min CEUS imaging. Finally, the SonoVue was transferred into the ultrasound machines.
Image analysis
At 120 s after SonoVue injection, the QLAB 8.1 software (Philips) was used for dynamic image analysis. After obtaining a suitable sample frame, tissue specimens were acquired at locations where there are significant enhancements at the edge and center of tumor. In addition, normal breast tissues at the edge of tumor, which were >5 mm in depth, were also obtained. The time–intensity curve (TIC) was acquired and analyzed. The relevant parameters were calculated, including rise time, which is the time required for perfusion and entry of contrast agent into tumor; peak intensity (PI), which is the maximum enhanced strength; time to peak, which is the time required to reach PI; wash-in slope, which is the maximum rate for microbubbles of contrast agent to enter into tumor; and mean transit time, which is the average time of contrast agent in tumor.
Immunohistochemistry
Tissue samples were collected in regions with no tumor necrosis. The specimens were fixed in 10% formalin, dehydrated with water extractor, transparentized with xylene, and embedded in paraffin. Hematoxylin–eosin staining and immunohistochemical staining were performed. Streptavidin-perosidase immunohistochemistry was performed using a two-step method. The primary and secondary antibodies used for determining the expressions of estrogen receptor (ER), p53, c-erbB-2, and Ki-67 were ready-to-use antibodies produced by Beijing Zhongshan Jinqiao Biotechnology Co., Ltd. (Beijing, People’s Republic of China), with a concentration of 1:100.
Staining results determination
The stained slides were observed by a professional pathologist under an optical microscope. ER- and p53-positive cells were confirmed by brown granules in nucleus, and c-erb-B2-positive cells were confirmed by brown granules in cell membrane or cytoplasm. The cells were determined as positive if the positive staining cells took up >10% of total cells; otherwise, the cells were determined as negative. For the determination of Ki-67 positivity, if >20% cells showed brown granules in nuclei after staining, the samples were denoted as Ki-67 positive; otherwise they were denoted as Ki-67 negative.12
Statistical analysis
All data analyses were performed using Statistical Product and Service Solutions 18.0 statistical software (SPSS Inc., Chicago, IL, USA). The measurement data were presented as mean ± standard deviation. The measurement data between different groups were compared using unpaired t-test. The differences of count data between different groups were analyzed using chi-square test. Using pathological results as a gold standard, multivariate logistic regression analysis was done for parameters obtained in CEUS and quantitative parameters of TIC, and constant value (B), standard error (SE), Wald chi-square value, degrees of freedom (df), P-value (significant), and odds ratio value were calculated. Using the control group and the case group as dependent variables, the above parameters showing significances were processed by forward stepwise binary logistic analyses. After obtaining the logistic regression equation, the predictive value of each parameter was determined. The optimal threshold was set by receiver operating characteristic (ROC) curve, the survival time of patients was analyzed using the Kaplan–Meier method and the survival rates of patients were compared by the log-rank test. The relative risk of clinical parameters to the prognosis was evaluated by multivariate Cox regression analysis. The intergroup comparisons of count data were done using Pearson χ2 or continuous calibration tests. A probability value of P<0.05 indicated that the difference was statistically significant.
Results
Comparisons of baseline characteristics between the case and control groups
The baseline information in the case and control groups was compared. The histological types in the case group were 126 cases (88.1%) of infiltrating ductal carcinoma and 17 cases (11.9%) of other carcinoma. There was no significant difference between the case and control groups with respect to overall age, menarche age, menopausal status, reproductive history, family history of cancer, and body mass index distribution (Table 1; all P>0.05).
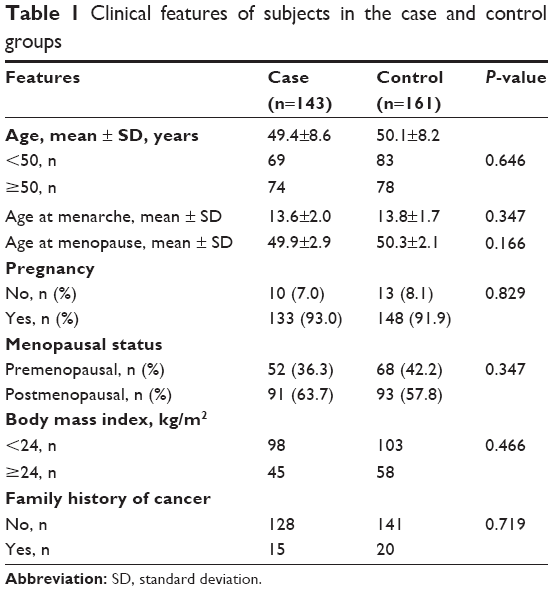 | Table 1 Clinical features of subjects in the case and control groups |
Comparisons of different CEUS parameters between the case and control groups
After CEUS imaging, the degree and uniformity of enhancement in the lesion, the enhancement characteristics of the lesion edge, and the lesion diameter at peak between the case group and the control group were compared and all parameters were significantly different between the two groups (all P<0.05). But the two groups showed no difference in the direction of enhancement (P=0.07). Most breast cancer patients showed high enhancement (105/143), heterogeneous enhancement or central defects (94/143), expansion of lesion diameter after enhancement (103/143), or crab-like blur lesion edge (107/143) (Table 2; Figure 1).
 | Table 2 Comparisons of contrast enhanced ultrasonography features between the case and control groups |
 | Figure 1 Contrast-enhanced ultrasound images in the case (A) and control groups (B). |
Comparisons of different TIC parameters between the case and control groups
The PI, relative start time, relative PI, and relative area under the curve between the case and control groups were significantly different (all P<0.05; Table 3). The logistic regression analysis of the CEUS and TIC parameters showed that the uniformity of lesion, the expansion of lesion diameter, and the relative PI were meaningful indicators in the diagnosis of breast cancer (Table 4). More specifically, the heterogeneous enhancement, the expanded lesion diameter after the enhancement, and the relatively high PI were all powerful diagnostic parameters for breast cancer.
 | Table 3 Comparisons of time–intensity curves between the case and control groups |
 | Table 4 Logistic regression analysis of contrast-enhanced ultrasound parameters on time–intensity curves |
Diagnostic values of different parameters in breast cancer evaluated by ROC curve
The uniformity of lesion enhancement (Figure 2), the expansion of lesion diameter (Figure 3), and the relative PI were used as test variables (Figure 4), and the ROC analyses of these variables were performed using pathological diagnosis as the gold standard. The results showed that the area under the curves of the uniformity of lesion enhancement, the expansion of lesion diameter, and the relative PI were 0.798, 0.776, and 0.919, respectively. This suggested that the diagnostic values of the above three parameters were higher than that of the TIC of conventional ultrasound.
 | Figure 2 Receiver operating characteristic (ROC) curve analysis of the diagnostic value of the uniformity of lesion enhancement in breast cancer. |
 | Figure 3 Receiver operating characteristic (ROC) curve analysis of the diagnostic value of the expansion of lesion diameter in breast cancer. |
 | Figure 4 Receiver operating characteristic (ROC) curve analysis of the diagnostic value of the relative peak intensity in breast cancer. |
Associations between CEUS parameters and prognostic factors in breast cancer
The CEUS parameters and the expressions of prognostic factors of breast cancer were analyzed. The results showed that c-erb-B2 expression was related to the uniformity of lesion enhancement, while positive c-erb-B2 was more likely to present heterogeneous enhancement and be seen in high histological grade. Centripetal enhancement pattern was more common in ER-negative tumors. The perforator vessels occurred mainly in tumors in high histological grade, and perfusion defects commonly occurred in ER-negative, c-erb-B2-positive, and Ki-67-positive tumors in high or medium histological grades whose diameter was >2 cm. The enhancement shape and enhancement margin of tumors were not related to prognostic factors (all P>0.05). The distributions of CEUS characteristics and prognostic factors in breast cancer are displayed in Table 5.
 | Table 5 Contrast-enhanced parameters and the prognostic factors in breast cancer |
Discussion
Breast cancers usually consist of a diversity of phenotypic cancer cells and are likely to metastasize to regional lymph nodes, bone marrow, lungs, and liver.13 It was a main mortality cause for women from late 30 s to early 50 s.14 Therefore, a more sophisticated ultrasound imaging technique may be of clinical significance in the diagnosis and prognosis of breast cancer.
This study found that the lesions of breast cancer were highly and heterogeneously enhanced, sometimes with central defects, whose diameters were enlarged and edges became crab-like and blurry. CEUS is a functional imaging technique that provides important diagnostic information and has become an alternative method of enhanced computed tomography and other imaging methods.15 In combination with SonoVue, CEUS has shown high performance in detecting both large and small vascularities.16 It has been shown that CEUS can illustrate the vascular perfusion inside and around the breast cancer tissues as well as showing small defects undetected by magnetic resonance imaging.17 Furthermore, CEUS was found to provide a high diagnostic accuracy in detecting metastatic sentinel lymph node in breast cancer.18 In addition, Saracco has shown that CEUS can help distinguish benign from malignant tumors, taking shorter time to reach PI in tumors with higher histological grades and quicker transit of contrast agent.19 In this study, the logistic regression analysis and relevant ROC evaluation found that heterogeneous enhancement, lesion diameter expansion, and relatively high enhancement were all significant diagnostic factors for breast cancer. In addition, the diagnostic values of ultrasound imaging were superior to conventional ultrasound time–intensity analysis for breast cancer, as suggested by the ROC results.
This study also found that CEUS parameters were related to the expressions of prognostic factors, including c-erb-B2, ER, and Ki-67. c-erb-B2 (also known as HER-2/neu) is a proto-oncogene located on chromosome 17q, whose overexpression and amplification is related to neoplastic transformation, progression, and poor prognosis in breast cancer.20,21 The ER-positive cases in all breast cancers are ~60% and the prognosis of ER-negative breast cancer is poor.22 Ki-67 is a prognostic indicator in early breast cancer, is a nuclear antigen present in all proliferating cells, and its positive expression indicates an active proliferation of tumor cells; its high expression is also correlated with lymph node metastasis.23 It was shown that c-erb-B2 was positive in 50.96% of malignant breast lesions, and the positive expression of this gene was associated with high enhancement in imaging.24 The defects in vascular perfusion are common in ER-negative tumors.24 Another study has shown that the concentric mode of enhancement was common in ER-negative tumors, and perfusion defects were generally seen in tumors with negative ER expression, positive c-erb-B2 expression, and positive Ki-67 expression,25 which were consistent with this study.
This study confirmed that high and heterogeneous enhancement and lesion diameter expansion were significant diagnostic factors for breast cancer, and some CEUS parameters had strong correlations with the expressions of prognostic factors of breast cancer, indicating that CEUS had certain diagnostic and prognostic values for breast cancer. Taking the successful application of CEUS in various disease diagnoses – from liver cancer to prostate and kidney diseases – in recent years into consideration, our results may be beneficial to finding clinical application of this new imaging method in the future regarding the diagnosis and prognosis evaluation of more illnesses, particularly gynecological diseases, including endometrial cancer and myoma of uterus. However, the research results should be verified in studies with more sample cases to ensure the reliability and accuracy.
Acknowledgments
We would like to acknowledge the helpful comments on this paper received from our reviewers.
Disclosure
The authors report no conflicts of interest in this work.
References
Cancer Genome Atlas Network. Comprehensive molecular portraits of human breast tumours. Nature. 2012;490(7418):61–70. | ||
Lupo M, Dains JE, Madsen LT. Hormone replacement therapy: an increased risk of recurrence and mortality for breast cancer patients? J Adv Pract Oncol. 2015;6(4):322–330. | ||
Farzaneh F, Noghabaei G, Barouti E, et al. Analysis of CYP17, CYP19 and CYP1A1 Gene polymorphisms in Iranian Women with breast cancer. Asian Pac J Cancer Prev. 2016;17 Spec No:23–26. | ||
Toro AL, Costantino NS, Shriver CD, Ellsworth DL, Ellsworth RE. Effect of obesity on molecular characteristics of invasive breast tumors: gene expression analysis in a large cohort of female patients. BMC Obes. 2016;3:22. | ||
Rossouw JE, Anderson GL, Prentice RL, et al; Writing Group for the Women’s Health Initiative. Risks and benefits of estrogen plus progestin in healthy postmenopausal women: principal results from the women’s health initiative randomized controlled trial. JAMA. 2002;288(3):321–333. | ||
Veronesi U, Viale G, Paganelli G, et al. Sentinel lymph node biopsy in breast cancer: ten-year results of a randomized controlled study. Ann Surg. 2010;251(4):595–600. | ||
Chen LD, Xu HX, Xie XY, et al. Intrahepatic cholangiocarcinoma and hepatocellular carcinoma: differential diagnosis with contrast-enhanced ultrasound. Eur Radiol. 2010;20(3):743–753. | ||
Li K, Su ZZ, Xu EJ, Ju JX, Meng XC, Zheng RQ. Improvement of ablative margins by the intraoperative use of CEUS-CT/MR image fusion in hepatocellular carcinoma. BMC Cancer. 2016;16:277. | ||
Garcia-Criado A, Gilabert R, Bianchi L, et al. Impact of contrast-enhanced ultrasound in the study of hepatic artery hypoperfusion shortly after liver transplantation: contribution to the diagnosis of artery steal syndrome. Eur Radiol. 2015;25(1):196–202. | ||
Westwood M, Joore M, Grutters J, et al. Contrast-enhanced ultrasound using SonoVue® (sulphur hexafluoride microbubbles) compared with contrast-enhanced computed tomography and contrast-enhanced magnetic resonance imaging for the characterisation of focal liver lesions and detection of liver metastases: a systematic review and cost-effectiveness analysis. Health Technol Assess. 2013;17(16):1–243. | ||
Atri M, Gertner MR, Haider MA, Weersink RA, Trachtenberg J. Contrast-enhanced ultrasonography for real-time monitoring of interstitial laser thermal therapy in the focal treatment of prostate cancer. Can Urol Assoc J. 2009;3(2):125–130. | ||
Elston CW, Ellis IO. Pathological prognostic factors in breast cancer. I. The value of histological grade in breast cancer: experience from a large study with long-term follow-up. C. W. Elston & I. O. Ellis. Histopathology 1991;19:403–410. Histopathology. 2002;41(3A):151–152, discussion 152–153. | ||
Kennecke H, Yerushalmi R, Woods R, et al. Metastatic behavior of breast cancer subtypes. J Clin Oncol. 2010;28(20):3271–3277. | ||
Rudel RA, Ackerman JM, Attfield KR, Brody JG. New exposure biomarkers as tools for breast cancer epidemiology, biomonitoring, and prevention: a systematic approach based on animal evidence. Environ Health Perspect. 2014;122(9):881–895. | ||
Yang W, Chen MH, Wu W, Dai Y, Fan ZH. Effects of gray-scale ultrasonography immediate post-contrast on characterization of focal liver lesions. Biomed Res Int. 2015;2015:193178. | ||
Mandai M, Koda M, Matono T, et al. Assessment of hepatocellular carcinoma by contrast-enhanced ultrasound with perfluorobutane microbubbles: comparison with dynamic CT. Br J Radiol. 2011;84(1002):499–507. | ||
Kanazawa S, Mitsuzuka Y, Ogata H, et al. Comparison of CEUS with enhanced MR-mammography in patients with breast cancer. Ultrasound Med Biol. 2011;37(8):S47. | ||
Zhang YX, Wang XM, Kang S, Li X, Geng J. Contrast-enhanced ultrasonography in qualitative diagnosis of sentinel lymph node metastasis in breast cancer: a meta-analysis. J Cancer Res Ther. 2015;11(4):697–703. | ||
Saracco A. Contrast enhanced ultrasound (CEUS) in breast tumors. Karolinska Institutet; 2013. Available at: https://openarchive.ki.se/xmlui/handle/10616/41777. Accessed October 10, 2016. | ||
Lonn U, Lonn S, Friberg S, Nilsson B, Silfversward C, Stenkvist B. Prognostic value of amplification of c-erb-B2 in bladder carcinoma. Clin Cancer Res. 1995;1(10):1189–1194. | ||
Bassullu N, Turkmen I, Dayangac M, et al. The predictive and prognostic significance of c-erb-B2, EGFR, PTEN, mTOR, PI3K, p27, and ERCC1 expression in hepatocellular carcinoma. Hepat Mon. 2012;12(10 HCC):e7492. | ||
Nizamutdinova IT, Lee GW, Son KH, et al. Tanshinone I effectively induces apoptosis in estrogen receptor-positive (MCF-7) and estrogen receptor-negative (MDA-MB-231) breast cancer cells. Int J Oncol. 2008;33(3):485–491. | ||
de Azambuja E, Cardoso F, de Castro G Jr, et al. Ki-67 as prognostic marker in early breast cancer: a meta-analysis of published studies involving 12,155 patients. Br J Cancer. 2007;96(10):1504–1513. | ||
Zhao LX, Liu H, Wei Q, et al. Contrast-enhanced ultrasonography features of breast malignancies with different sizes: correlation with prognostic factors. Biomed Res Int. 2015;2015:613831. | ||
Cao XL, Bao W, Zhu SG, et al. Contrast-enhanced ultrasound characteristics of breast cancer: correlation with prognostic factors. Ultrasound Med Biol. 2014;40(1):11–17. |
 © 2017 The Author(s). This work is published and licensed by Dove Medical Press Limited. The
full terms of this license are available at https://www.dovepress.com/terms
and incorporate the Creative Commons Attribution
- Non Commercial (unported, 3.0) License.
By accessing the work you hereby accept the Terms. Non-commercial uses of the work are permitted
without any further permission from Dove Medical Press Limited, provided the work is properly
attributed. For permission for commercial use of this work, please see paragraphs 4.2 and 5 of our Terms.
© 2017 The Author(s). This work is published and licensed by Dove Medical Press Limited. The
full terms of this license are available at https://www.dovepress.com/terms
and incorporate the Creative Commons Attribution
- Non Commercial (unported, 3.0) License.
By accessing the work you hereby accept the Terms. Non-commercial uses of the work are permitted
without any further permission from Dove Medical Press Limited, provided the work is properly
attributed. For permission for commercial use of this work, please see paragraphs 4.2 and 5 of our Terms.