Back to Journals » Clinical Ophthalmology » Volume 16
Diagnostic Ability of Barrett’s Index and Presence of Intracranial Fat Prolapse in Dysthyroid Optic Neuropathy
Authors Kemchoknatee P ![]() , Chenkhumwongse A
, Chenkhumwongse A ![]() , Dheeradilok T, Srisombut T
, Dheeradilok T, Srisombut T ![]()
Received 10 March 2022
Accepted for publication 1 August 2022
Published 12 August 2022 Volume 2022:16 Pages 2569—2578
DOI https://doi.org/10.2147/OPTH.S364987
Checked for plagiarism Yes
Review by Single anonymous peer review
Peer reviewer comments 2
Editor who approved publication: Dr Scott Fraser
Parinee Kemchoknatee,1 Alisa Chenkhumwongse,2 Thanchanok Dheeradilok,1 Thansit Srisombut3
1Department of Ophthalmology, Rajavithi Hospital, Rangsit University, Bangkok, Thailand; 2Department of Diagnostic Radiology, Rajavithi Hospital, Rangsit University, Bangkok, Thailand; 3Faculty of Medicine, Rajavithi Hospital, Rangsit University, Bangkok, Thailand
Correspondence: Parinee Kemchoknatee, Department of Ophthalmology, Rajavithi Hospital, Bangkok, 10400, Thailand, Email [email protected]
Background: Dysthyroid optic neuropathy (DON) is one of the most serious visual loss threats for patients with Graves’ ophthalmopathy (GO). Barrett’s index (BI) and intracranial-fat prolapse have been used in diagnosing DON. However, these parameters are rarely used in Southeast Asian populations with a variety of cut-off values.
Objective: To evaluate the performance of BI and fat prolapse in diagnosing of DON, and to study the correlation between their parametric values with visual acuity (VA) and visual field defect (VF).
Methods: Between January 2011 and December 2020, orbits affected by GO were retrospectively reviewed and classified into 2 groups based on the presence or absence of DON. All orbital-computed-tomography (CT) scans were measured for BI and fat prolapse. Diagnostic performance of BI and fat prolapse was analyzed and evaluated in relation to visual outcome.
Results: We included orbits with DON (23 orbits) and the absence of DON (61 orbits). BI was significantly higher in patients in the DON group (47.68 ± 12.52%) compared to the absence of DON (37.55 ± 10.88%), p < 0.001. The presence of fat prolapse was significantly higher in the DON group (p = 0.003). BI at 40% provided best diagnostic performance with sensitivity of 78.3%/specificity of 63.9%. The presence of fat prolapse 4.5 mm via the superior-ophthalmic-fissure (SOF) had a lower sensitivity compared with fat prolapse 2.5 mm. Comparison between area under the curve (AUC) of BI and fat prolapse revealed no statistically significant difference (AUC 0.742 and 0.705 in BI and fat prolapse, respectively, p = 0.607). A negative correlation between the BI and fat prolapse with VA and VF was observed (p < 0.001).
Conclusion: Measurement of BI is a simple diagnostic method for detecting DON in Thai populations. The presence of fat prolapse (2.5 mm) provides a lower sensitivity compared with a BI at 40%. A slightly larger BI or fat prolapse should be suspected of DON for early treatment.
Keywords: dysthyroid optic neuropathy, Graves’ ophthalmopathy, thyroid eye disease, muscle index, Barrett’s index, fat prolapse, orbital CT scan
A Letter to the Editor has been published for this article.
Introduction
Graves’ ophthalmopathy is a common autoimmune disease of the orbit. It presents with a variety of manifestations such as proptosis, lid retraction, diplopia, and optic neuropathy.1 One of the most serious visual loss threats for patients with GO is dysthyroid optic neuropathy (DON),2 the diagnosis of which includes clinical characteristics such as decreased visual acuity, presence of relative afferent pupillary defect, color defect, and visual field defect.3 The most common pathology of DON is enlargement of extraocular muscles causing compression of the optic nerve.4,5
Orbital Computed Tomography (CT) is useful in the assessment of crowding of the ocular muscle and swelling of soft tissue. The Barrett’ index (BI), proposed by Barrett et al, is an assessment of muscle expansion as a percentage of horizontal or vertical extraocular muscles occupied by the height or width axis.4 It is a good indicator of DON detection, with high sensitivity and specificity at BI 67%.4 Several researchers have reproduced those findings in many studies using different BI values and revealing a variety of performances with BI values ranging from 50% to 60%.6–10 Most of those studies were conducted in western countries. In the Asian population, Jeon et al found that almost half of DON patients had a BI greater than 67% and none had a BI below 50%.10 Similarly, Yu et al suggested that the optimal BI was 52% in the Chinese population.9
Some researchers previously reported that fat prolapse through superior ophthalmic fissure is a good indicator for diagnosing DON,6,7 However, Giaconi et al suggested a lower sensitivity compared to the results of Birchall et al.7 Many researchers have found that there is no difference in intracranial fat prolapse, whether with or without DON.9,11,12
It is generally accepted that anatomical muscle and orbital size can vary with gender, age, and ethnicity,4,11,13 and reports of the use of BI and fat prolapse as an indicator for diagnosis of DON in Southeast Asian populations are very limited. There has also been insufficient research into the association between BI and the presence of fat prolapse with visual status, including BCVA and visual field.
The purposes of the present study were to evaluate and compare the performance of BI and fat prolapse in detecting dysthyroid optic neuropathy, and to study the correlation of BI and fat prolapse with visual status.
Method
Between January 2011 and December 2020, patients diagnosed with GO were based on criteria used in a study by Bartley et al1 who underwent orbital computed tomography and were included in our analysis. They were categorized into 2 groups (presence and absence of DON) according to criteria proposed by Dayan et al with at least two of the following criteria:2 (i) reduced BCVA of two lines or more; (ii) loss of color vision; (iii) optic disc swelling; and (iv) relative afferent pupillary defect.
All participants had a complete ophthalmic evaluation including visual acuity, tested on a Snellen chart converted to Logarithm of the Minimum Angle of Resolution (LogMAR) for statistical purposes. Color vision was evaluated using Ishihara test, and the presence of relative afferent pupillary defect (RAPD) was also investigated. Fundus examination was performed, and automated visual field was tested with Humphrey Field Analyzer HFA II 750 (Carl Zeiss Meditec Inc, Dublin, CA) using a 30–2 threshold program with the Swedish Interactive Threshold Algorithm (SITA) Fast strategy. All participants underwent thyroid function test (thyroid stimulating hormone (TSH), free triiodothyronine (FT3), and free thyroxine (FT4)). Patients diagnosed with GO received orbital computed tomography (CT) scan for various reasons, including evaluation of the degree of apical crowding, exclusion of mass pathology, and pre-operative planning of surgical decompression. During the orbital CT scan (MDCT: Somatom Definition AS 128 slices and GE Light Speed VCT 128 slices), patient’s eyes were instructed to close and gaze straight at the ceiling. The CT scan slice thickness was 1.25 to 1.5 mm in ranges of axial scan with coronal reconstruction 1.0–1.25 mm. All orbital CT scans were retrospectively evaluated, and measurement of BI and the presence of fat prolapse were calculated by a single radiologist (A.J.) with more than 10 years’ experience in our center, who was blinded to the patient’s condition and unaware of which group (presence or absence of DON) each patient was in. The BI was measured according to the method proposed by Barrett et al into vertical and horizontal axis.4 Each axis was measured at the point centrally between the posterior globe and the orbital apex in plane perpendicular to the axis of the optic nerve. Vertical index is the percentage of orbital height occupied by the superior muscle group, including superior rectus and levator muscle (A) and inferior rectus (B) muscle along a line drawn through the optic nerve (C). Horizontal index is the percentage of orbital width occupied by the medial rectus (E) and lateral rectus (F) along a horizontal line through the optic nerve (D). The larger value was represented as a BI in each orbit and were defined as BI (Figure 1). Intracranial fat prolapse or posterior extension of orbital fat was measured on axial view of CT scans (Figure 2). As described by Birchall et al, the measurement of intracranial fat prolapse is defined as a distance of orbital fat behind the boundary of superior ophthalmic fissure (red line) on axial CT image.6 The lateral margin of the SOF is identified at the innermost border of the sphenoid wing (green arrow), while the medial margin is indicated at the most anterior border of sphenoid body groove (yellow arrow). The presence of intracranial fat prolapse was confirmed when orbital fat extended 2 mm or more behind the posterior border of superior ophthalmic fissure. Inclusion criteria were as follows: 1) Age between 18 and 80 years; 2) Diagnosis of GO;1 3) Dysthyroid optic neuropathy according to Dayan criteria;2 and 4) Having undergone complete orbital computed tomography at our institute. Exclusion criteria were as follows: 1) History of prior orbital radiation or decompression; 2) Visual loss from other eye disease; 3) Abnormality of liver or renal function; 4) History of prior intravenous glucocorticoids within the previous 6 months; 5) Unavailability of visual field data; 6) Poor quality imaging of orbital CT; 7) Previous ocular muscle surgery; and 8) Having symptoms of GO for more than 6 months.
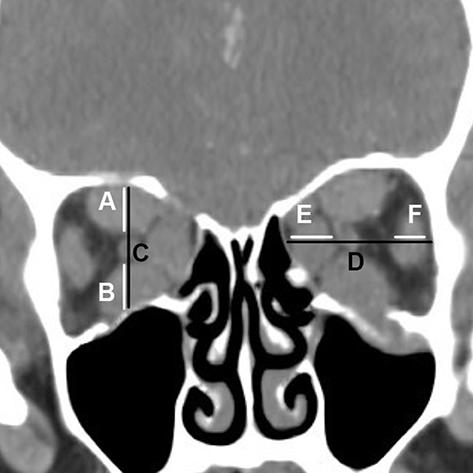 |
Figure 1 Measurements of BI. The coronal plane of the CT scan described the method used to measure BI vertically ([(A)+(B)]/(C) x100) and horizontal axis ([(E)+(F)]/(D) x100). The larger value of each orbit was represented as BI. (A) A superior muscles group including superior rectus and levator muscle. (B) Inferior rectus. (C) A vertical line drawn from the superior muscle group to the inferior rectus in plane perpendicular to the axis of optic nerve. (D) A horizontal line drawn from the medial rectus to the lateral rectus in plane perpendicular to the axis of optic nerve. (E) Medial rectus. (F) Lateral rectus. |
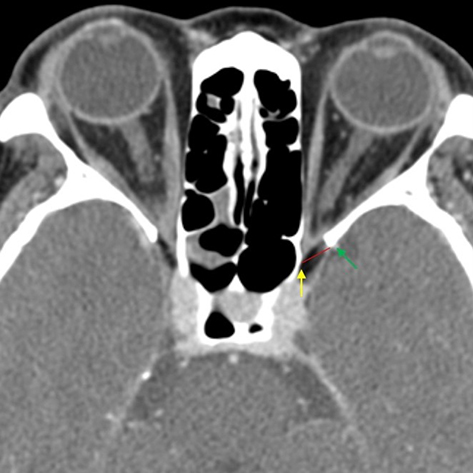 |
Figure 2 Measurements of intracranial fat prolapse. According to Birchall et al,6 intracranial fat prolapse is defined as a distance of orbital fat behind the boundary of superior ophthalmic fissure (red line) on axial CT image. The lateral margin of the SOF is identified at the most inner border of the sphenoid wing (green arrow), while the medial margin is indicated at the most anterior border of sphenoid body groove (yellow arrow). |
Statistical Analysis
Shapiro–Wilk test and histogram were employed to evaluate normally distributed data, while mean and standard deviation were expressed as normally distributed variables. Interquartile ranges at the 25th and 75th percentiles (IQR), and min–max were expressed as non-normally-distributed variables. Comparison of categorical data including gender, the presence of relative afferent pupillary defect (RAPD) and smoking status in the 2 groups was performed with Chi-square or Fisher's Exact test. Student’s t-test and Mann–Whitney U-test were used to analyse and compare continuous data. Spearman’s rank correlation was employed to evaluate the association between muscle indices and BCVA and VF. For each Barrett’s index and fat prolapse value, we calculated sensitivity, specificity, positive predictive value (PPV), negative predictive value (NPV), Likelihood-ratio (LR) and accuracy for diagnosis of DON. Area under the receiver operating characteristic (ROC) curve with 95% confidence interval was used to measure the success of the classification in the presence or absence of dysthyroid optic neuropathy, and a p-value lower than 0.05 was considered significant. All statistical analyses were computed using SPSS ver. 25 (SPSS Inc., Chicago, IL, USA), and diagnostic performance and ROC were performed with STATA ver. 16 (StataCorp., Texas, USA).
Ethical Issues
This retrospective study, which followed the tenets of the Declaration of Helsinki and was approved by the Ethics Committee on Human Rights, related to research involving human subjects, College of Medicine Rajavithi hospital, Rangsit University (Trial number 232/2564). All participants were given written informed consent before participating in the study recruitment.
Results
In all, 120 orbits of 60 patients with GO were recruited for our study. Of these, 36 orbits were excluded because they did not meet the inclusion criteria: 10 had previously received orbital decompression (OD); 3 had prior orbital radiation (ORT); 15 had other causes of optic neuropathy; 2 had poor-quality scans; and 6 had received intravenous glucocorticoids in the 6 months preceding the scan.
A total of 84 orbits from 42 patients met our inclusion criteria and were enrolled for analysis. Three patients had bilateral dysthyroid optic neuropathy (DON). The 84 orbits were categorized into 2 groups: patients with DON, and those without it. Mean age years ±(SD) were 41.36 ± 11.5 and 50.9 ± 13.34 in DON and without DON groups respectively, with a statistical significance (p = 0.018). A female predominance was observed in both groups but without statistical significance (p = 0.625). Although there was a slightly higher proportion of tobacco use in the DON group, the difference was not significant (p = 0.123).
The majority of cases in both groups had a thyroid abnormality (55% and 63.6% in the DON and without DON groups, respectively, p = 0.569), 14 had hyperthyroidism, and 11 had hypothyroidism. There were no differences between the levels of TSH, FT3, or FT4 in the 2 groups (p = 0.935, p = 0.744, and p = 0.948 respectively) (Table 1).
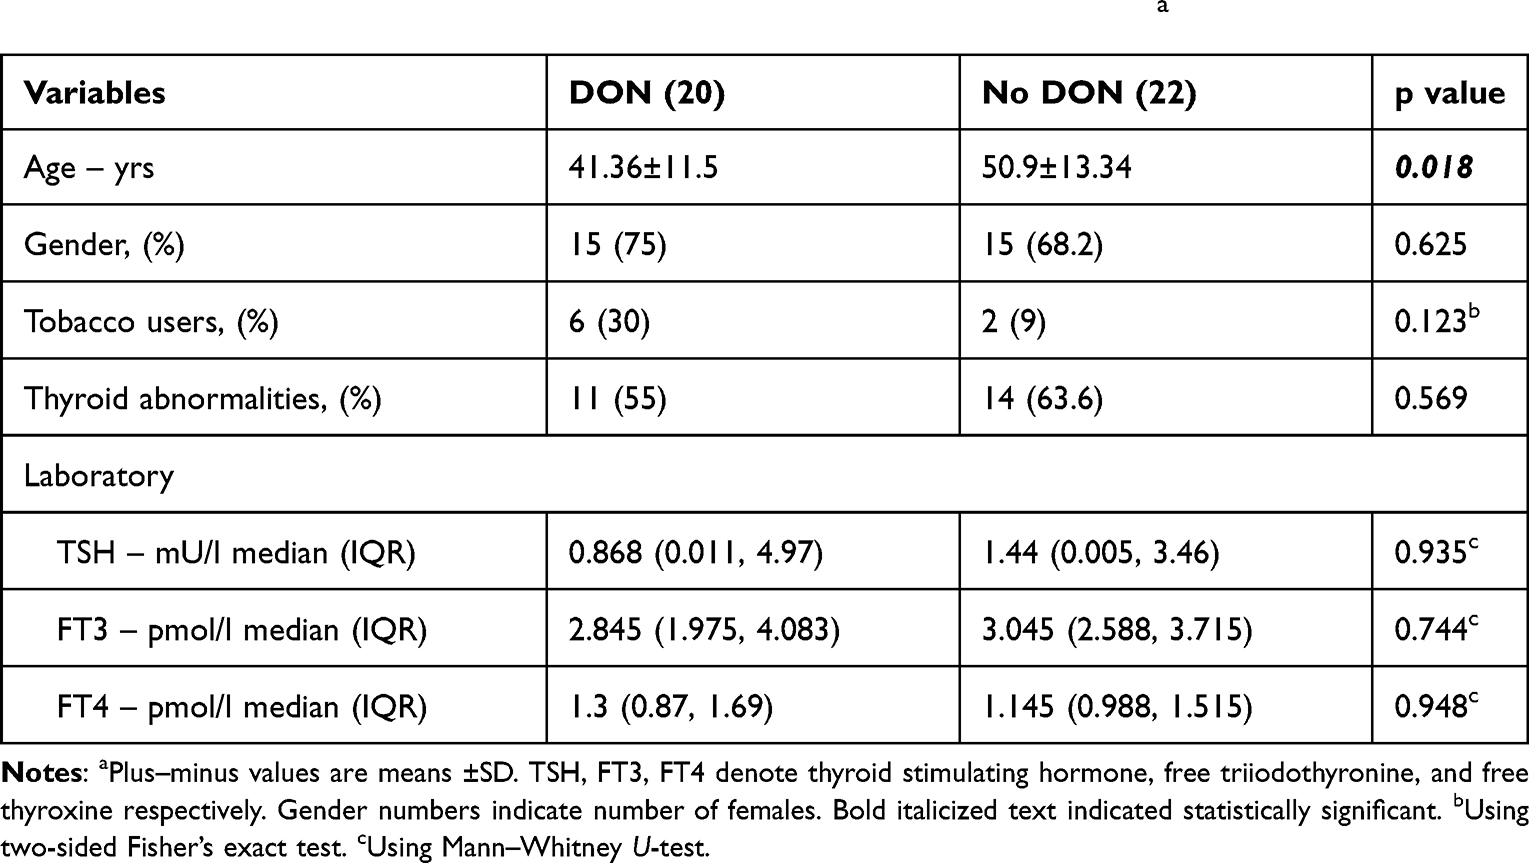 |
Table 1 Baseline Characteristics of Each Patient with Thyroid Eye Disease.a |
The median best-corrected visual acuity (BCVA) was 0.7 logMAR (IQR 0.3 to 2.6) in the DON group and 0.1 logMAR (IQR 0 to 0.3) in the absence of DON group and this difference was statistically significant (p < 0.001). In the DON group, the median decrease in decibels of standard perimetry was −10 dB (range minimal −20 dB to maximal −2 dB) compared with 0 dB in the absence group, and this was statistically significant (p < 0.001). In the DON group, the median Ishihara plates that could be read were 5 (range 0 to 9 plates). All cases with absence of optic neuropathy had normal color vision. The difference between the disc morphology in the 2 groups was statistically significant with a p-value <0.001 with the presence of abnormal disc in 21 (91.3%) orbits in the DON group and none in the group without the disease. Of the 21 abnormal discs in the DON group, 10 were pale, and the remaining 11 were disc swelling. There was a statistically significant difference between the BI of the two groups. Mean BI in the DON group was 47.68 ± 12.52% compared with 37.55 ± 10.88% in the group without DON (p < 0.001). The fat prolapse value was significantly higher in DON compared to No DON group (p = 0.003) as shown in Table 2.
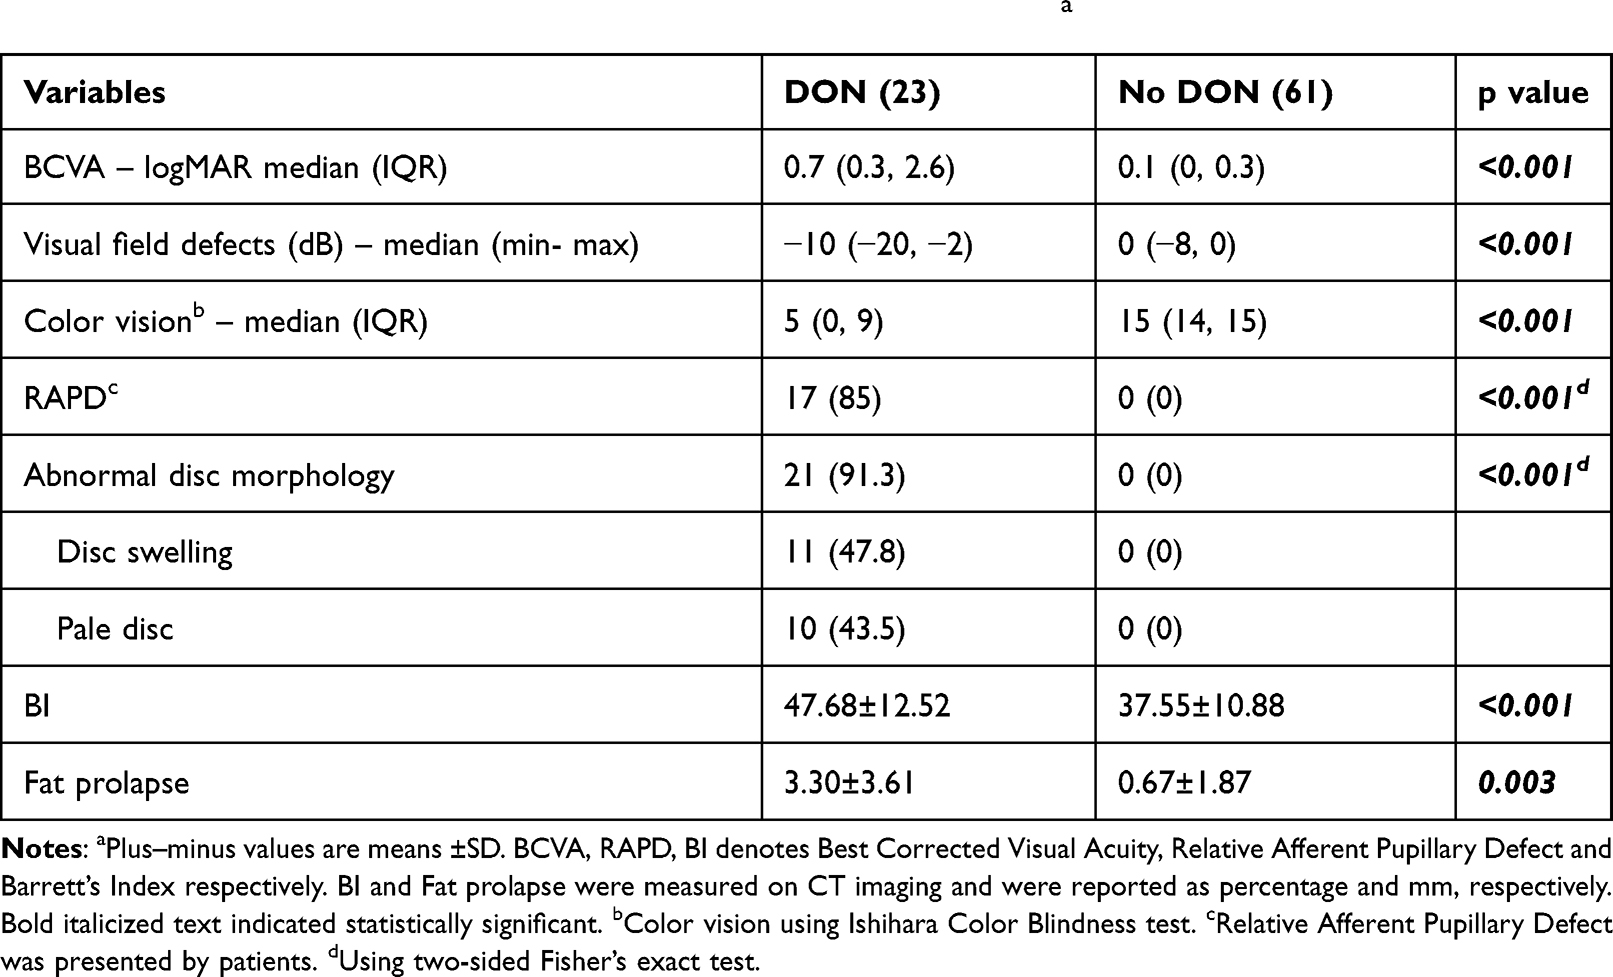 |
Table 2 Baseline Characteristics of Visual Parameters of Each Orbit.a |
An analysis of BI values is shown in Table 3. Employing BI at 67% based on recommendations by Barrett et al,4 we found a sensitivity of 13% (2.78, 33.6; 95% CI) and a specificity 98.4% (91.2, 100; 95% CI) with positive predictive value 75% (19.4, 99.4 95% CI), negative predictive value 75% (64.1, 84; 95% CI) and accuracy of 75%.
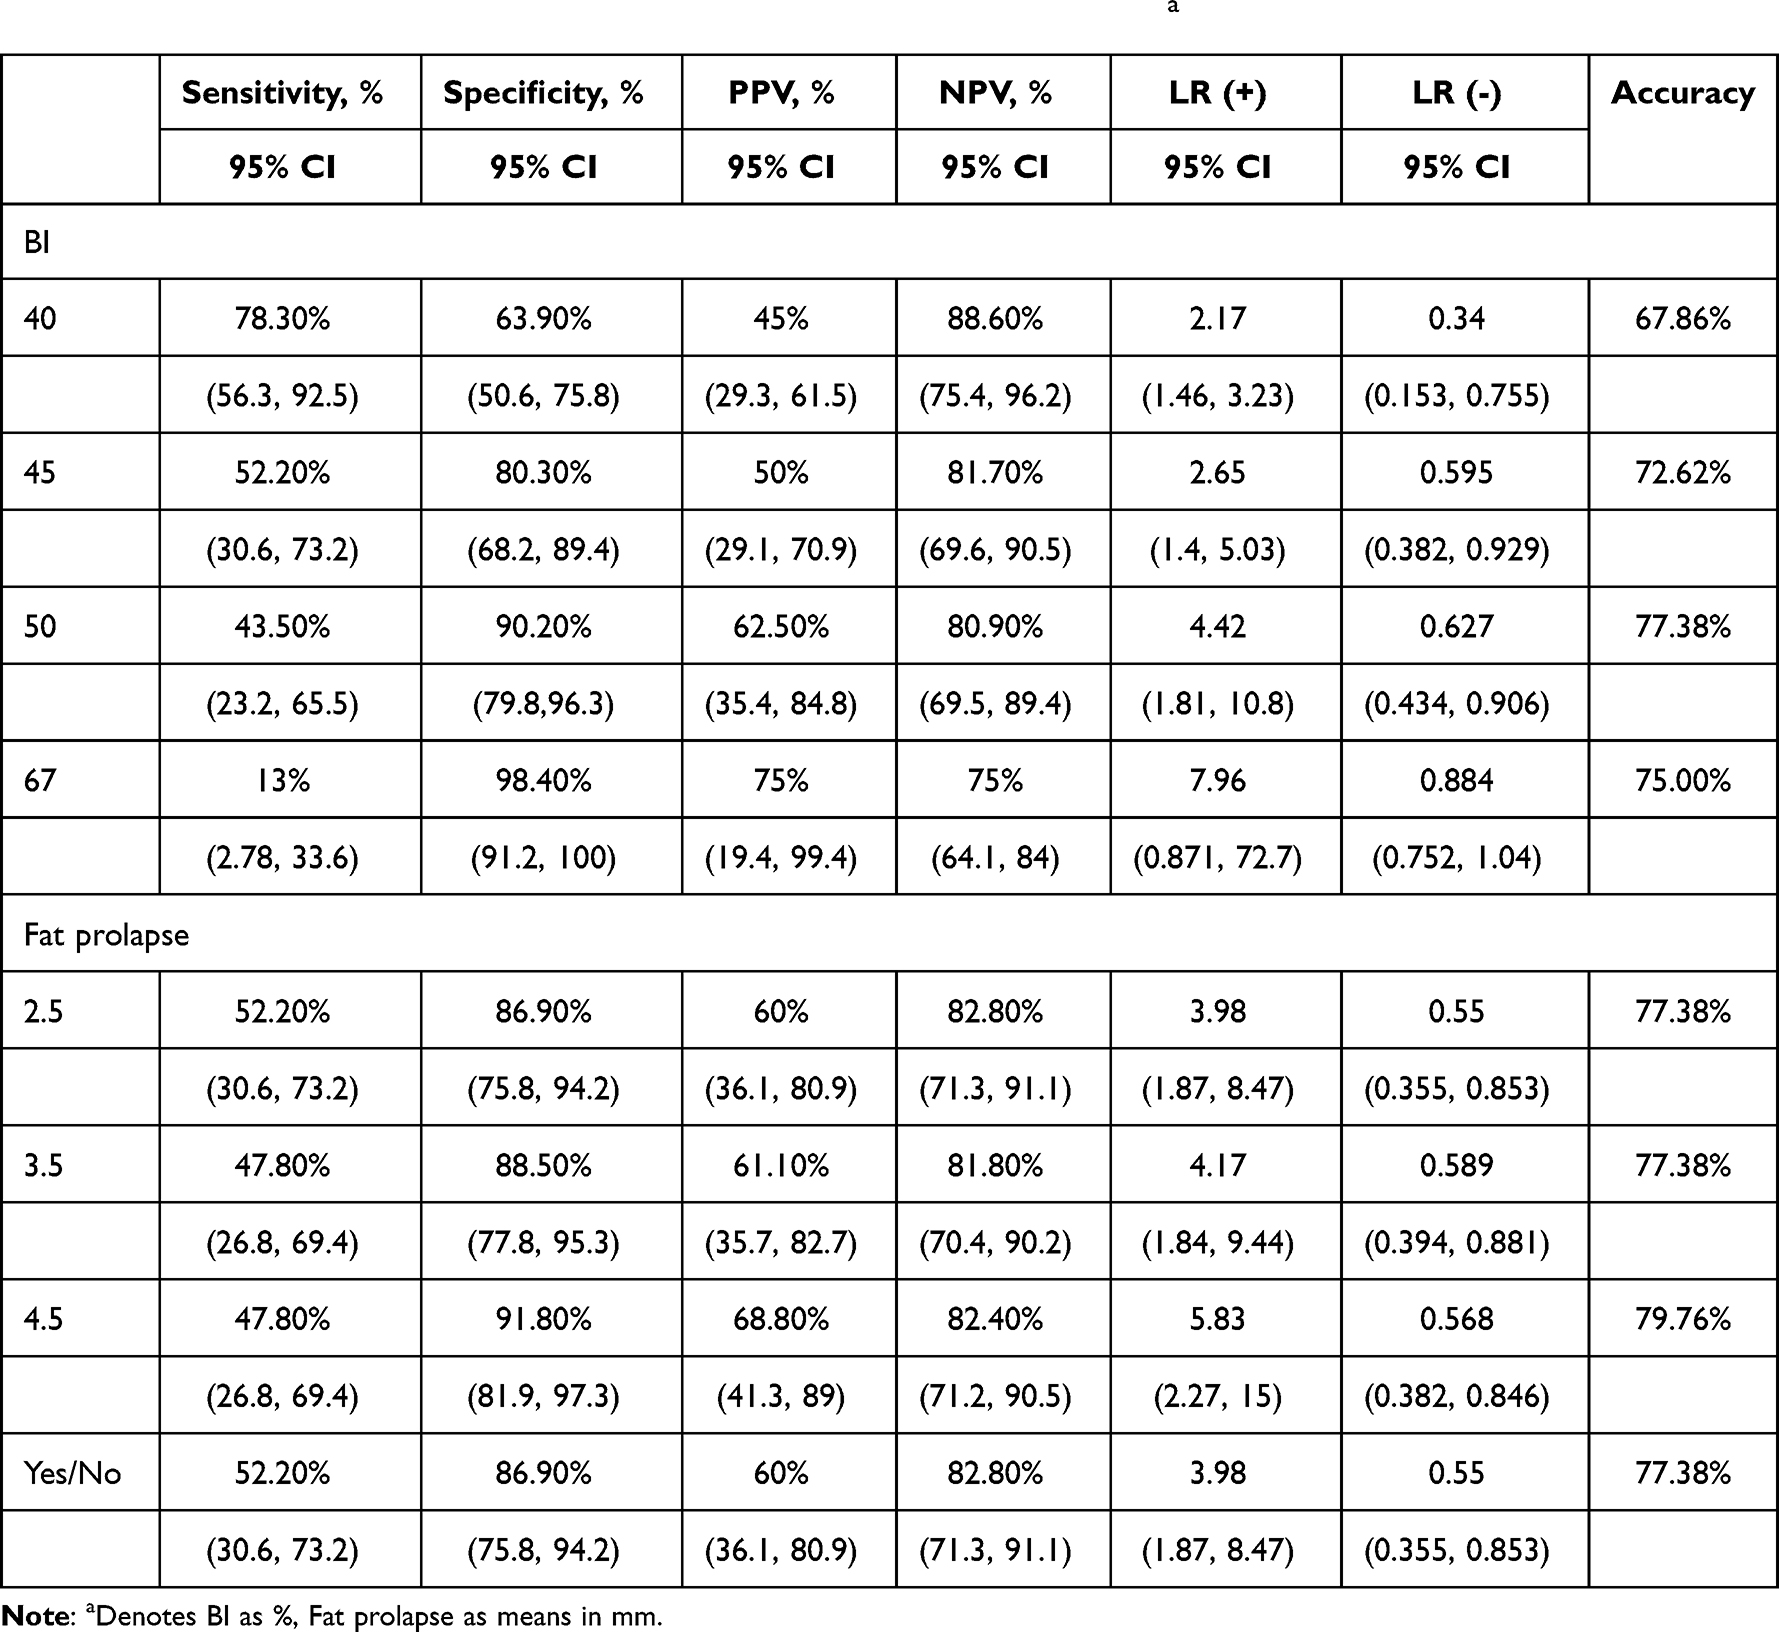 |
Table 3 Diagnostic Performance of BI and Fat Prolapse in Predicting DON.a |
Lowering BI to 50%, as in several recent studies,9,12,14 improved the diagnostic ability to detect DON, with a sensitivity of 43.5% (23.2, 65.5; 95% CI) and a specificity of 90.2% (79.8, 96.3; 95% CI). Adjusting BI to 45% yielded a sensitivity of 52.2% (30.6, 73.2; 95% CI) and specificity of 80.3% (68.2, 89.4; 95% CI). Setting BI at 40% produced the best diagnostic performance in our series, with sensitivity of 78.3% (56.3, 92.5; 95% CI), specificity 63.9% (50.6, 75.8; 95% CI), PPV 45% (29.3, 61.5; 96% CI), NPV 88.6% (75.4, 96.2; 95% CI), and accuracy of 67.86%.
Fat prolapse via SOF was measured and analyzed by tailoring the value in millimeters (mm) to calculate its diagnostic performance in detecting the disease. Presence of fat prolapse of 4.5 mm in SOF had the best specificity at 91.8% (81.9, 97.3; 95% CI) but low sensitivity at 47.8% (26.8, 69.4; 95% CI). Decreasing the value to 2.5 mm produced the best performance in detecting DON with a sensitivity 52.2% (30.6, 73.2; 95% CI), a specificity 86.9% (75.8, 94.2; 95% CI), PPV 60% (36.1, 80.9; 95% CI), and NPV of 82.8% (71.3, 91.1; 95% CI). Employing other cut-off points for the presence of fat prolapse via SOF yielded a performance similar to that of 2.5 mm as shown in Table 3.
There was no difference between AUC in ROC measurements of BI and fat prolapse in the present study (p = 0.607). BI had AUC 0.742 (0.623, 0.861; 95% CI), while fat prolapse had AUC of 0.705 (0.589, 0.820; 95% CI), as shown in Table 4 and Figure 3.
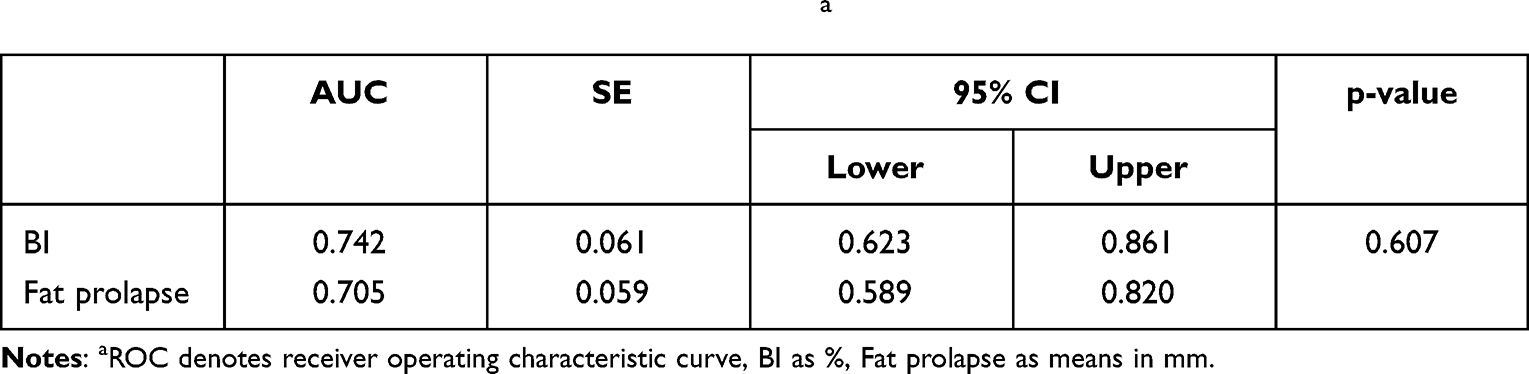 |
Table 4 Comparison of ROC of BI and Fat Prolapse.a |
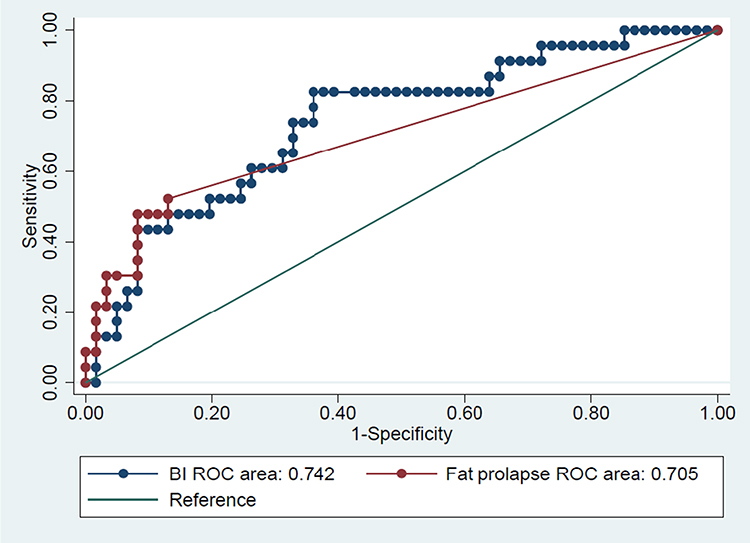 |
Figure 3 Comparison between the ROC of Barrett’s index and fat prolapse in diagnosing DON. Receiver Operating Characteristic (ROC) Curves Comparing BI and Fat prolapse for the diagnosing of DON. The area under the ROC curve was 0.742 for the BI and 0.705 for fat prolapse with no difference in area of ROC between BI and fat prolapse (p=0.607). aROC denotes receiver operating characteristic curve, BI as %, Fat prolapse as means in mm. |
The present study discovered a Spearman coefficient correlation between orbital parametric values (BI and fat prolapse) and visual status (BCVA log MAR, VF). BI had a moderate correlation with VA (r = 0.486, p < 0.001) and a medium negative correlation with VF (r = −0.452, p < 0.001). Similarly, there was a correlation between both fat prolapse and VA (r = 0.472, p < 0.001) and fat prolapse and VF (r = −0.480, p < 0.001), as shown in Table 5.
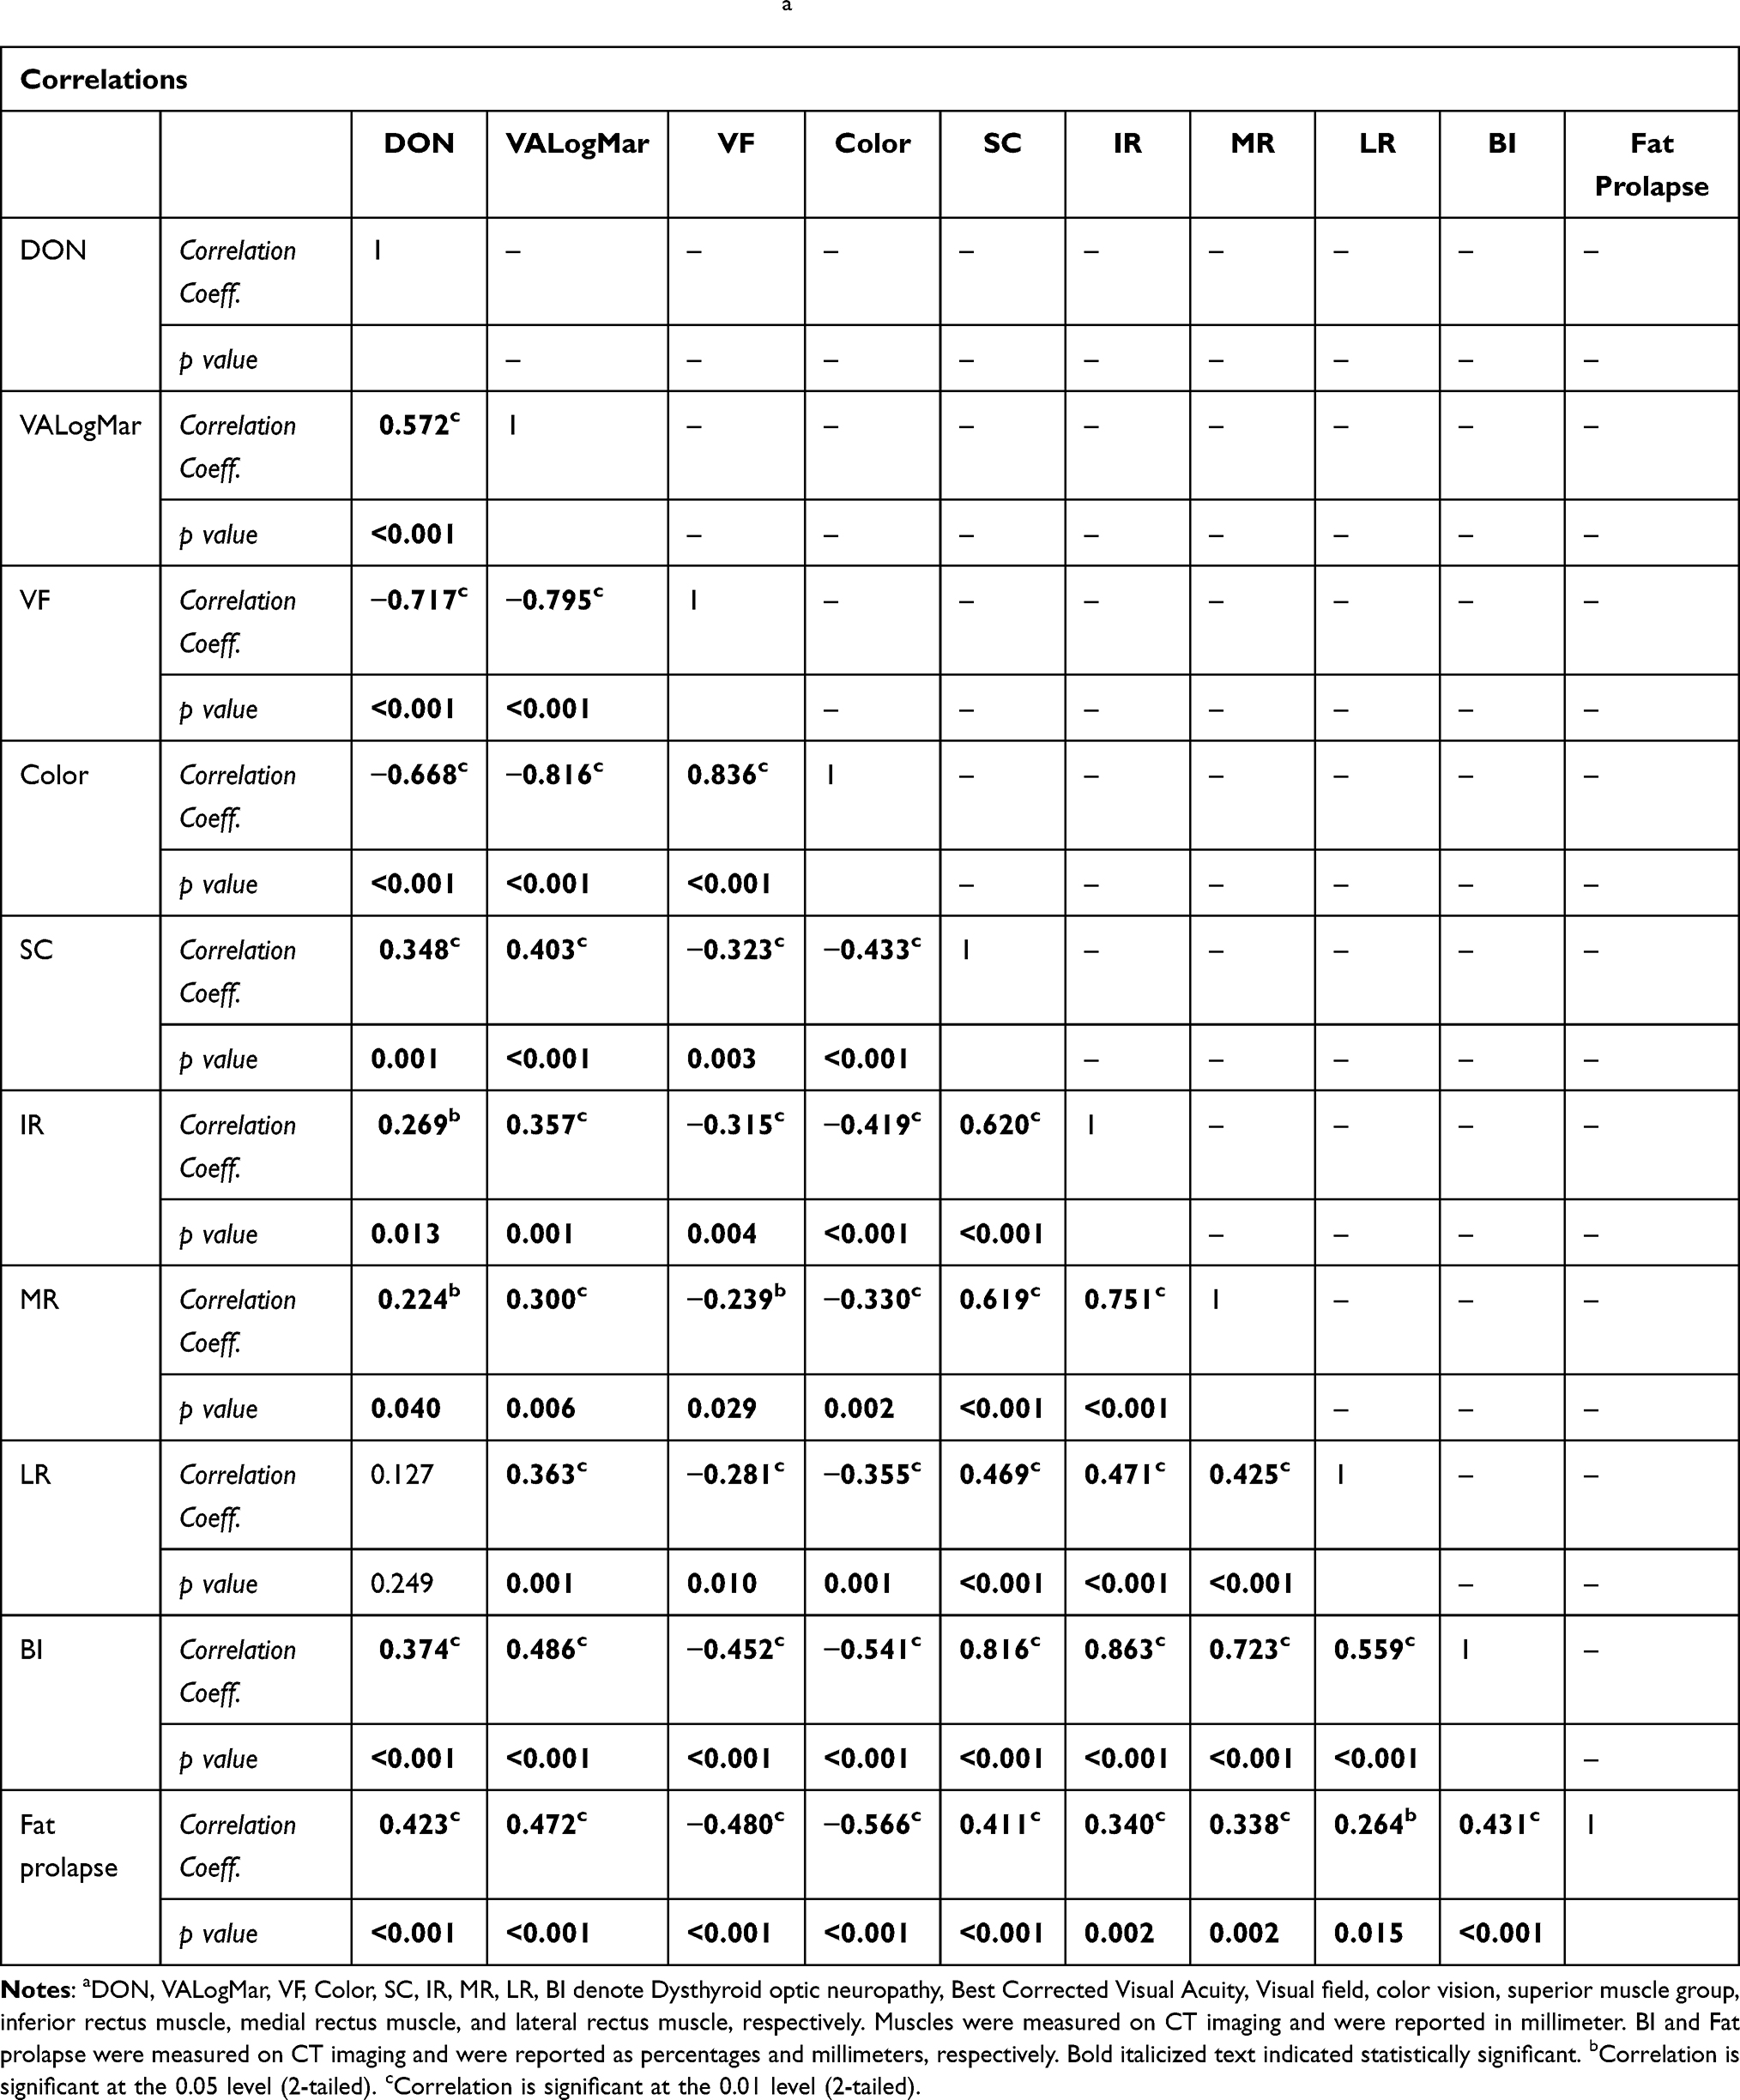 |
Table 5 Spearman Correlation of Variables in the Analysis.a |
Discussion
Currently, there are no definite diagnostic criteria for dysthyroid optic neuropathy, but orbital parametric values are useful in detecting it. Several previous authors have proposed apical crowding as a useful indicator in European populations.7 Some researchers have found orbital muscle volume to be a predictor of the disease,15,16 the present study highlighted the importance of employing Barrett’s index in identifying DON. A significant difference was found between BI values of patients with and without optic neuropathy, and this was similar to findings of several previous reports.7–10,14 Although Barrett et al presented the benefits of setting a 67% BI as a predictive factor for dysthyroid optic neuropathy, some researchers have disagreed with this conclusion. Monteiro et al opined that a BI of 67% should not be considered a rigid number for detecting the disease.4,8 In concordance with this, our cohort study revealed the best diagnostic value to be a BI of 40%, which yielded sensitivity/specificity of 78.3%/63.9% compared to 13/98.4% when setting the index at 67%. Interestingly, our optimal BI value is significantly lower than those of several other studies which mostly employed an index of greater than 50%.4,7–10,14 This shows that it is important for physicians not to rule out the possibility of DON in patients without muscle enlargement on orbital CT scan or rely solely on employing a larger BI in supporting diagnosis. In fact, BI should be used in conjunction with an ophthalmologist’s clinical assessment. In this series, if we had employed a BI of greater than 50%, we would have missed diagnosing DON in 13 orbits (56.5%); moreover, when using the BI of 67%, we achieved a diagnosis sensitivity of only 13%. There are some possible explanations for this. First, the current study enrolled patients who had lower disease severity and were in earlier stages of the disease compared with subjects in other studies; for instance, we excluded any cases having Grave’s ophthalmopathy for more than 6 months, as those patients would have received prior intravenous glucocorticoids, orbital decompression, or muscle surgery based on the theory that muscle enlargement caused by the promotion of hyaluronan accumulation between muscle fibers and muscle fibrosis is due to the activation of orbital fibroblast, and these processes develop in later stage of disease while there are still intact of muscle cell in early or active stage.17 Second, Regensburg et al proposed that there are 4 types of GO: presence of either muscle or fat enlargement alone; presence of both; or presence of neither.13 Most of our patients did not present solely with muscle enlargement but rather with fat enlargement alone or with a combination of fat and muscle enlargement which was supported by Kazim et al that found a recovery of the disease after orbital fat decompression or another case series of Anderson et al that revealed no or a little muscle enlargement in their patients.18,19 Third, our number of cases affected by DON was small, and this may have lowered discrimination ability.Birchall et al proposed that the presence of fat prolapse in the superior ophthalmic fissure (SOF) is an indicator of the presence of DON, while ACP Goncalves and several studies reached the opposite conclusion.6,9,11,12 In our series, a significant presence of fat prolapse was observed in optic neuropathy; however, fat prolapse is not a sensitive indicator for the disease with a sensitivity of only 52.2% when using a cut point of 2.5 mm (absence or presence). On the other hand, it has a high specificity in Thai populations which is in contrast to the results of a study by Yu et al which proposed that there is no difference of presence of fat prolapse in the disease.9 The current study demonstrated that the measurement at cut point 4.5 mm of fat prolapse had the greatest specificity at 91.8%. In contrast, it is not appropriate for screening for the disease, as it yielded a low sensitivity of just 47.8%. Our findings were supported by those of Giaconi et al who proposed that fat prolapse is a less sensitive predictor than BI or apical crowding.7 We proposed some reasons for this. First, the very small sample size of fat prolapse orbits weakens the discriminatory ability of the test. Second, some researchers have suggested that fat prolapse might appear in normal orbits or thyroid eye disease before the development of DON.9 Third, Anderson et al proposed that fat enlargement is a late process mostly present in patients with more than 1 year’s disease duration due to late adipogenesis.19 Fourth, in the previous report by Peyster et al, an increase in orbital fat volume has been described in Graves ophthalmopathy, Cushing’s disease/syndrome, and with obesity resulting in exophthalmos (CT scan of 15 patients with proptosis).20,21 Fifth, according to Forbes et al, proposed younger age (40 years) has a trend of fat predominance, whereas older age (60 years) has muscle enlargement characters.22 Correspondingly, Regensburg et al observed a tiny of fat increase with their age in patients with GO and this may support our results since DON group was significantly younger than without DON group (41 vs 51 years) in the present study.13 We believe that other causes such as obesity might be a factor that is associated with fat prolapse via SOF. We suggest that these inconclusive theories should be prospectively studied in normal, GO and DON orbits, including accounting for variable of patient age, body weight and BMI (Body mass index).
No specific predominant enlargement of any ocular muscle group was observed in our series. In contrast, some previous studies found that the medial rectus or superior muscle group could be a crucial predictor of DON.15,16,23 However, the present study found a significantly negative correlation between muscle index and the presence of fat prolapse with visual status (VA, VF in decibels). We observed that the larger the muscle size, the worse the vision, and this is in agreement with the findings of previous studies.9,24,25 It could be explained by the well-accepted fact that compressive optic neuropathy occurs due to crowding of the orbital apex caused by increased muscle size.4,11 In addition, our series revealed a stronger correlation between color vision and VF than VA in diagnosing DON, and this is supported by the results of a study by JM. Neigel et al who proposed that color vision is the most sensitive indicator of optic neuropathy in patients with GO.5
The main strength of our series is the fact that it is the first study to compare the diagnostic ability of muscle index and fat prolapse in detection of dysthyroid optic neuropathy in Thai population; furthermore, it reveals significant associations between these parametric values and visual status (VA, VF). Some limitations were also observed in the current study. First, the small sample size of DON orbits might have diluted its power of analysis, such as our finding that the diagnostic performance of fat prolapse is lower than that of muscle measurement, as we had only a few cases. Second, this was a retrospective study; since the disease is a rare condition in Asian populations, we could not analyze the validity and reliability of each observer in reading those orbital parameters. Finally, some incomplete data may have been included due to the research’s retrospective nature.
This study highlighted the benefit of measurement of muscle index as a simple diagnostic method. In addition, most appropriate BI in our study was lower than those employed in western studies. Ophthalmologists should suspect DON based on clinical ophthalmic findings in combination with the presence of fat prolapse with or without increase BI on orbital CT scan. Slightly larger BI and the presence of fat prolapse in GO patients without a clinical of DON should be closely monitored as those may have a higher risk of optic neuropathy for early treatment.
Conclusions
Measurement of muscle index (BI) is a simple diagnostic tool for detecting DON in Thai populations using a BI of 40%, yielding a sensitivity 78.3% and a specificity 63.9%. The presence of fat prolapse (2.5 mm) provides a lower sensitivity (52.2%) compared with a BI at 40% in Thai population. Patients with slightly larger muscle size or fat prolapse through SOF should be suspected of dysthyroid optic neuropathy for early treatment.
Acknowledgments
The authors would like to acknowledge the assistance of Professor Chulaluk Komoltri, PhD, statistician at the Clinical Epidemiology and Biostatistics Unit, Siriraj Hospital, Mahidol University, Thailand, in diagnostic performance statistical analysis. The authors would also like to extend special thanks to Duanghatai Tangon, MD., for contributing in critically scrutinizing the quality of this paper. The authors would like to thank all the subjects in this study and to acknowledge the assistance of the staff of the ethics committee and the research center of Rajavithi Hospital for providing their facilities.
Disclosure
The authors declare no conflicts of interest in relation to this work.
References
1. Bartley GB, Gorman CA. Diagnostic criteria for Graves’ ophthalmopathy. Am J Ophthalmol. 1995;119(6):792–795.
2. Dayan CM, Dayan MR. Dysthyroid optic neuropathy: a clinical diagnosis or a definable entity? Br J Ophthalmol. 2007;91(4):409–410.
3. McKeag D, Lane C, Lazarus JH, et al. Clinical features of dysthyroid optic neuropathy: a European Group on Graves’ Orbitopathy (EUGOGO) survey. Br J Ophthalmol. 2007;91(4):455–458.
4. Barrett L, Glatt HJ, Burde RM, Gado MH. Optic nerve dysfunction in thyroid eye disease: CT. Radiology. 1988;167(2):503–507.
5. Neigel JM, Rootman J, Belkin RI, et al. Dysthyroid optic neuropathy. The crowded orbital apex syndrome. Ophthalmology. 1988;95(11):1515–1521.
6. Birchall D, Goodall KL, Noble JL, Jackson A. Graves ophthalmopathy: intracranial fat prolapse on CT images as an indicator of optic nerve compression. Radiology. 1996;200(1):123–127.
7. Giaconi JA, Kazim M, Rho T, Pfaff C. CT scan evidence of dysthyroid optic neuropathy. Ophthalmic Plast Reconstr Surg. 2002;18(3):177–182.
8. Monteiro ML, Gonçalves AC, Silva CT, Moura JP, Ribeiro CS, Gebrim EM. Diagnostic ability of Barrett’s index to detect dysthyroid optic neuropathy using multidetector computed tomography. Clinics. 2008;63(3):301–306.
9. Yu B, Gong C, Ji YF, Xia Y, Tu YH, Wu WC. Predictive parameters on CT scan for dysthyroid optic neuropathy. Int J Ophthalmol. 2020;13(8):1266–1271.
10. Jeon C, Shin JH, Woo KI, Kim YD. Clinical profile and visual outcomes after treatment in patients with dysthyroid optic neuropathy. Korean J Ophthalmol. 2012;26(2):73–79.
11. Gonçalves AC, Gebrim EM, Monteiro ML. Imaging studies for diagnosing Graves’ orbitopathy and dysthyroid optic neuropathy. Clinics. 2012;67(11):1327–1334.
12. Rutkowska-Hinc B, Maj E, Jabłońska A, Milczarek-Banach J, Bednarczuk T, Miśkiewicz P. Prevalence of radiological signs of dysthyroid optic neuropathy in magnetic resonance imaging in patients with active, moderate-to-severe, and very severe graves orbitopathy. Eur Thyroid J. 2018;7(2):88–94.
13. Regensburg NI, Wiersinga WM, van Velthoven ME, et al. Age and gender-specific reference values of orbital fat and muscle volumes in Caucasians. Br J Ophthalmol. 2011;95(12):1660–1663.
14. Lima Bda R, Perry JD. Superior ophthalmic vein enlargement and increased muscle index in dysthyroid optic neuropathy. Ophthalmic Plast Reconstr Surg. 2013;29(3):147–149.
15. Weis E, Heran MK, Jhamb A, et al. Quantitative computed tomographic predictors of compressive optic neuropathy in patients with thyroid orbitopathy: a volumetric analysis. Ophthalmology. 2012;119(10):2174–2178.
16. Chan LL, Tan HE, Fook-Chong S, Teo TH, Lim LH, Seah LL. Graves ophthalmopathy: the bony orbit in optic neuropathy, its apical angular capacity, and impact on prediction of risk. AJNR Am J Neuroradiol. 2009;30(3):597–602.
17. Bahn RS, Heufelder AE. Pathogenesis of Graves’ ophthalmopathy. N Engl J Med. 1993;329(20):1468–1475.
18. Kazim M, Trokel SL, Acaroglu G, Elliott A. Reversal of dysthyroid optic neuropathy following orbital fat decompression. Br J Ophthamol. 2000;84(6):600.
19. Anderson RL, Tweeten JP, Patrinely JR, Garland PE, Thiese SM. Dysthyroid optic neuropathy without extraocular muscle involvement. Ophthalmic Surg. 1989;20(8):568–574.
20. Peyster RG, Ginsberg F, Silber JH, Adler LP. Exophthalmos caused by excessive fat: CT volumetric analysis and differential diagnosis. AJR Am J Roentgenol. 1986;146(3):459–464.
21. Seedat A, Seedat S, Moosa SEI. Proptosis with increased orbital fat in an obese patient. Case Rep Radiol. 2020;2020:8832704.
22. Forbes G, Gorman CA, Brennan MD, Gehring DG, Ilstrup DM, Earnest F. Ophthalmopathy of Graves’ disease: computerized volume measurements of the orbital fat and muscle. AJNR Am J Neuroradiol. 1986;7(4):651–656.
23. Starks VS, Reinshagen KL, Lee NG, Freitag SK. Visual field and orbital computed tomography correlation in dysthyroid optic neuropathy due to thyroid eye disease. Orbit. 2020;39(2):77–83.
24. Nugent RA, Belkin RI, Neigel JM, et al. Graves orbitopathy: correlation of CT and clinical findings. Radiology. 1990;177(3):675–682.
25. Chaganti S, Mundy K, DeLisi MP, et al. Assessment of orbital computed tomography (CT) imaging biomarkers in patients with thyroid eye disease. J Digit Imaging. 2019;32(6):987–994.
 © 2022 The Author(s). This work is published and licensed by Dove Medical Press Limited. The
full terms of this license are available at https://www.dovepress.com/terms
and incorporate the Creative Commons Attribution
- Non Commercial (unported, 3.0) License.
By accessing the work you hereby accept the Terms. Non-commercial uses of the work are permitted
without any further permission from Dove Medical Press Limited, provided the work is properly
attributed. For permission for commercial use of this work, please see paragraphs 4.2 and 5 of our Terms.
© 2022 The Author(s). This work is published and licensed by Dove Medical Press Limited. The
full terms of this license are available at https://www.dovepress.com/terms
and incorporate the Creative Commons Attribution
- Non Commercial (unported, 3.0) License.
By accessing the work you hereby accept the Terms. Non-commercial uses of the work are permitted
without any further permission from Dove Medical Press Limited, provided the work is properly
attributed. For permission for commercial use of this work, please see paragraphs 4.2 and 5 of our Terms.