Back to Journals » Diabetes, Metabolic Syndrome and Obesity » Volume 18
Development of Predictive Models for Progression from Diabetic Kidney Disease to End-Stage Renal Disease in Type 2 Diabetes Mellitus: A Retrospective Cohort Study
Authors Hu H ![]() , Mu X, Zhao S, Yang M, Zhou H
, Mu X, Zhao S, Yang M, Zhou H ![]()
Received 15 October 2024
Accepted for publication 22 January 2025
Published 10 February 2025 Volume 2025:18 Pages 383—398
DOI https://doi.org/10.2147/DMSO.S500992
Checked for plagiarism Yes
Review by Single anonymous peer review
Peer reviewer comments 2
Editor who approved publication: Dr Rebecca Baqiyyah Conway
Huiyue Hu, Xiaodie Mu, Shuya Zhao, Min Yang, Hua Zhou
Department of Nephrology, The Third Affiliated Hospital of Soochow University, Changzhou, People’s Republic of China
Correspondence: Hua Zhou; Min Yang, Department of Nephrology, The Third Affiliated Hospital of Soochow University, Changzhou, 213003, People’s Republic of China, Email [email protected]; [email protected]
Aim: The aim of this study was to develop a predictive model for the progression of diabetic kidney disease (DKD) to end-stage renal disease (ESRD) and to evaluate the effectiveness of renal pathology and the kidney failure risk equation (KFRE) in this context.
Methods: The study comprised two parts. The first part involved 555 patients with clinically diagnosed DKD, while the second part focused on 85 patients with biopsy-proven DKD. Cox regression analysis and competing risk regression were employed to identify independent predictors. Time-dependent receiver operating characteristic (ROC) was used to evaluate prediction performance, and the area under the curve (AUC) was calculated to assess the model’s accuracy.
Results: The Cox regression model developed for the 555 patients clinically diagnosed with DKD identified 5 predictors (body mass index (BMI), estimated glomerular filtration rate (eGFR), 24-hour urinary total protein (UTP), systemic immune-inflammatory index (SII), and controlling nutritional status (CONUT), whereas the Competing risks model included 4 predictors (BMI, eGFR, UTP, CONUT). Among 85 patients with biopsy-proven diabetic DKD, the combined prognostic model integrating KFRE, interstitial fibrosis and tubular atrophy (IFTA), SII and BMI demonstrated enhanced predictive ability at 5 years. The developed models offer improved accuracy over existing methods by incorporating renal pathology and novel inflammatory indices, making them more applicable in clinical settings.
Conclusion: The predictive model proved to be effective in assessing the progression of DKD to ESRD. Additionally, the combined model of KFRE, IFTA, SII, and BMI demonstrates high predictive performance. Future studies should validate these models in larger cohorts and explore their integration into routine clinical practice to enhance personalized risk assessment and management.
Keywords: diabetic kidney disease, end-stage renal disease, pathologies, risk assessment
Introduction
The latest edition of the International Diabetes Federation (IDF) Diabetes Atlas (10th edition) highlights that diabetes mellitus (DM) is a major contributor to kidney disease globally, with almost 40% of type 2 DM (T2DM) patients developing diabetic kidney disease (DKD). Global trends indicate a growing prevalence of DM and its associated chronic kidney disease (CKD), presenting a significant challenge to global health.1 The increasing incidence of CKD highlights the urgency for effective prediction and prevention strategies, especially in high-risk populations. DKD is described as CKD resulting from diabetes, characterized by albumin loss in urine, structural changes in the kidneys (glomerular damage), and reduced glomerular filtration rate (GFR).2 It also encompasses a newly recognized type of diabetes-related CKD where GFR decreases without significant albuminuria.3 DKD is the primary cause of end-stage renal disease (ESRD), marked by a subtle onset. Once it progresses to notable proteinuria, the transition to ESRD occurs at a much quicker pace compared to other kidney ailments.4 Patients with ESRD necessitate dialysis or kidney transplantation for extended survival, leading to considerable challenges for patients and society. Hence, the development of a comprehensive prediction model for ESRD risk in high-risk DKD patients, allowing for early intervention to delay deterioration in renal function, is essential.
Prognostic studies on DKD advancing to ESRD have pinpointed independent risk factors such as blood pressure (BP), uric acid (UA), diabetic retinopathy, cystatin-C, serum albumin (ALB), hemoglobin (Hb), 24-hour urinary total protein (UTP), estimated glomerular filtration rate (eGFR),5,6 mesangial proliferation,7 basement membrane thickening,8 nodular sclerosis,9 and interstitial fibrosis and tubular atrophy (IFTA).10 Given that the pathogenesis of DKD predominantly involves oxidative stress and ischemic inflammation,11 chronic hyperglycemia induce oxidative stress,12 promoting the excessive production of reactive oxygen species (ROS) and reducing antioxidant capacity. This, in turn, leads to oxidative damage to DNA and proteins, stimulating the immune system to release inflammatory mediators and cytokines that affect the structure and function of glomerular capillaries and renal tubules. This initiates a cascade of chronic inflammation, further aggravating kidney and systemic damage.13 Early identification of non-traditional risk factors is therefore essential for evaluating the prognosis of DKD. Presently, there is a lack of reliable prognostic models incorporating clinical indicators, pathological indicators, immune responses, inflammation, and nutritional status in DKD progression research, and acquiring substantial sample data poses challenges. Therefore, we introduced the kidney failure risk equation (KFRE), designed to forecast progression to ESRD in CKD stages 3–5 among Canadian populations.14 KFRE stands as a widely validated risk assessment tool that is user-friendly and has received validation across various international cohorts,15 rendering it a dependable predictive model. Our goal is to preliminarily investigate the combined effectiveness of KFRE, immune inflammation and nutritional indicators, and pathological indicators in DKD prognosis. While KFRE has proven effective in predicting ESRD risk, its scope is limited to clinical indicators such as age, sex, and kidney function. Incorporating immune-inflammatory, nutritional, and pathological markers alongside KFRE represents an innovative approach, addressing the complex interplay of DKD’s pathogenesis and improving its prognostic accuracy.
Materials and Methods
Study Population
We conducted a retrospective analysis, recruiting 1115 patients clinically diagnosed with DKD at the Department of Nephrology, Third Affiliated Hospital of Soochow University, between January12010and March 31 2023, and followed-up until March 31, 2024.
Inclusion criteria: (1) age ≥ 18 years; (2) meeting the clinical diagnostic criteria for DKD in patients with T2DM according to the National Kidney Foundation-Kidney Disease Outcomes Quality Initiative (NKF-KDOQI).
Exclusion criteria: (1) presence of other types of kidney diseases or having a solitary kidney; (2) DKD in patients with type 1 diabetes mellitus (T1DM); (3) eGFR < 15 mL/min/1.73 m² (CKD-EPI) during hospitalization or before admission, and/or undergoing renal replacement therapy; (4) death during hospital stay; (5) acute kidney injury, severe infection, or malignant tumor; (6) significant baseline data incompleteness and/or being lost to follow-up.
The endpoint event was defined as progression to ESRD (including eGFR < 15 mL/min/1.73 m² (CKD-EPI)) and/or initiation of renal replacement therapy. Patients were followed until the endpoint event occurred. For patients without the endpoint event, follow-up continued until March 31, 2024. Figure 1 illustrates the process of subject inclusion for clinically diagnosed DKD. Among the 555 patients, 85 underwent renal biopsy during hospitalization, confirming the pathological diagnosis of DKD. Furthermore, in the Non-ESRD group, 38 patients died during follow-up.
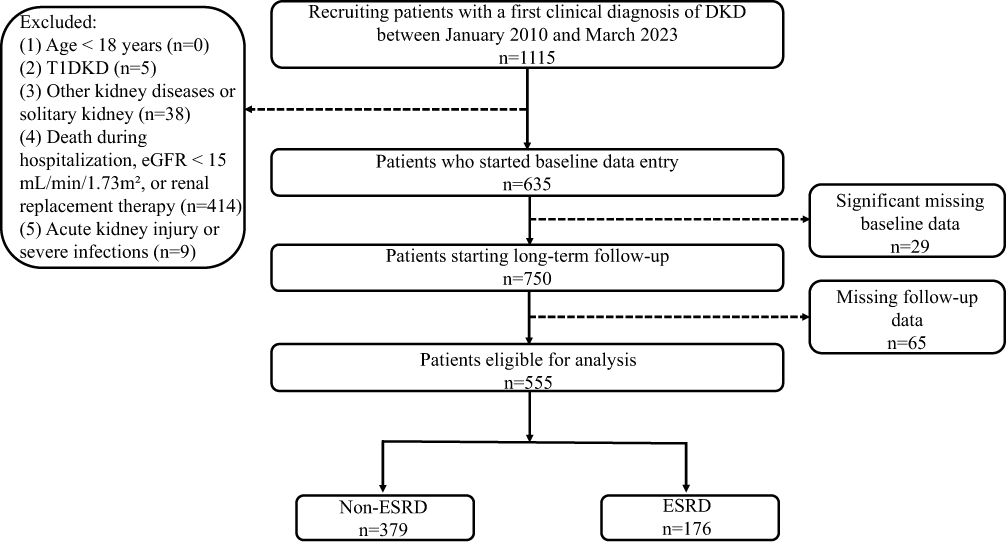 |
Figure 1 Flowchart of participants with clinically diagnosed DKD. Abbreviations: DKD, diabetic kidney disease; eGFR, estimated glomerular filtration rate; ESRD, end-stage renal disease; T1DKD, type 1 diabetic kidney disease; T2DKD, type 2 diabetic kidney disease. Note: The flowchart shows the entire research process. |
Data Collection
Demographic and clinical baseline data were extracted from electronic medical records, encompassing parameters such as age, gender, body mass index (BMI), smoking and drinking history, hypertension and diabetes duration, use of diabetes and hypertension medications, previous cardiovascular events, anticoagulant and/or antiplatelet agent usage, systolic blood pressure (SBP), average fasting blood glucose (ΔFBG), average postprandial blood glucose (ΔPBG), HbA1c, Hb, platelet count (PLT), neutrophil count (NEU), lymphocyte count (LYM), D-dimer, bicarbonate, ALB, blood urea nitrogen (BUN), serum creatinine (Scr), eGFR, UA, serum potassium (K), corrected serum calcium (Ca), serum phosphorus (P), UTP, and urine albumin-to-creatinine ratio (UACR). These baseline data were utilized to calculate the controlling nutritional status (CONUT) score and systemic immune-inflammatory index (SII) following the respective formulas.
SII= PLT (10^9/L) × NEU (10^9/L)/ LYM (10^9/L)16
FBG values were used as proxies to estimate HbA1c levels. A linear regression model was used to define the relationship between FBG and HbA1c.17 According to established criteria from the literature,18 the estimated HbA1c levels were classified into two categories: Grade 1 for predicted HbA1c < 8.0%, Grade 2 for predicted HbA1c ≥ 8.0%.
For the 85 patients diagnosed with DKD through renal biopsy, we gathered information such as Tervaert classification,19 grade of glomerular lesions, presence of Kimmelstiel-Wilson (K-W) nodules, exudative lesions (including fibrin caps and mesangial droplets), IFTA, glomerulosclerosis grade, and interstitial inflammatory cell infiltration grade.9 The specific grading criteria for pathological evaluation are as follows: The grading of glomerular lesions was based on the Tervaert classification. Glomerular lesion grades were classified as follows: Grade 1 corresponds to Tervaert stage I, Grade 2 to stage IIa, Grade 3 to stage IIb, Grade 4 to stage III, and Grade 5 to stage IV. Glomerulosclerosis was graded as: Grade 0 (no sclerosis), Grade 1 (<25% sclerosis), Grade 2 (25–50% sclerosis), and Grade 3 (>50% sclerosis). Interstitial inflammatory cell infiltration was graded as: Grade 0 (none), Grade 1 (minimal, focal), and Grade 2 (extensive, diffuse). K-W nodules and exudative lesions (fibrin caps, mesangial droplets) were each classified as Grade 0 (absent) or Grade 1 (present). IFTA were graded as: Grade 0 (no atrophy), Grade 1 (<25% atrophy), Grade 2 (25–50% atrophy), and Grade 3 (>50% atrophy). The pathological score was independently evaluated by two pathologists. Although inter-rater agreement was not formally assessed in this study (eg, using Cohen’s Kappa), any discrepancies in scoring were resolved through discussion between the pathologists to reach a consensus.
Furthermore, we calculated the KFRE scores for the patients using the original scoring algorithm. The KFRE, which incorporates age, gender, UACR, eGFR, bicarbonate levels, ALB, Ca, and P, estimates the 2-year and 5-year risk of progression to ESRD. The KFRE scores range from −83 to 29, with lower scores indicating a higher risk of ESRD progression.14
Statistical Analysis
Statistical analyses were conducted using SPSS software version 26.0, R software version 4.4.0, and GraphPad Prism software version 9.0.0. Continuous variables with a normal distribution were presented as mean ± standard deviation and compared between groups using the t-test. Non-normally distributed continuous variables were expressed as median (interquartile range) and compared using the Mann–Whitney U-test. Categorical variables were described as percentages (%) and analyzed using the χ2 test or Fisher’s exact test. To develop the competing risks regression model, the analysis utilized the “crprep” function from the “mstate” R package. A P value < 0.05 was considered statistically significant.
Results
Patients with Clinically Diagnosed DKD
Baseline Characteristics
The median follow-up duration for DKD participants was 38.0 (19.0, 67.0) months. Among our follow-up cohort, 176 cases (31.7%) experienced ESRD events. Baseline demographic characteristics, laboratory indicators and medication usage of 555 included DKD patients are present in Table 1. ESRD group showed higher SBP, DBP, D-dimer, BUN, Scr, K, Ca, UTP, CONUT score, male proportion, UA and SII proportions, proteinuria, but lower ΔFBG, Hb and eGFR compared with non-ESRD group.
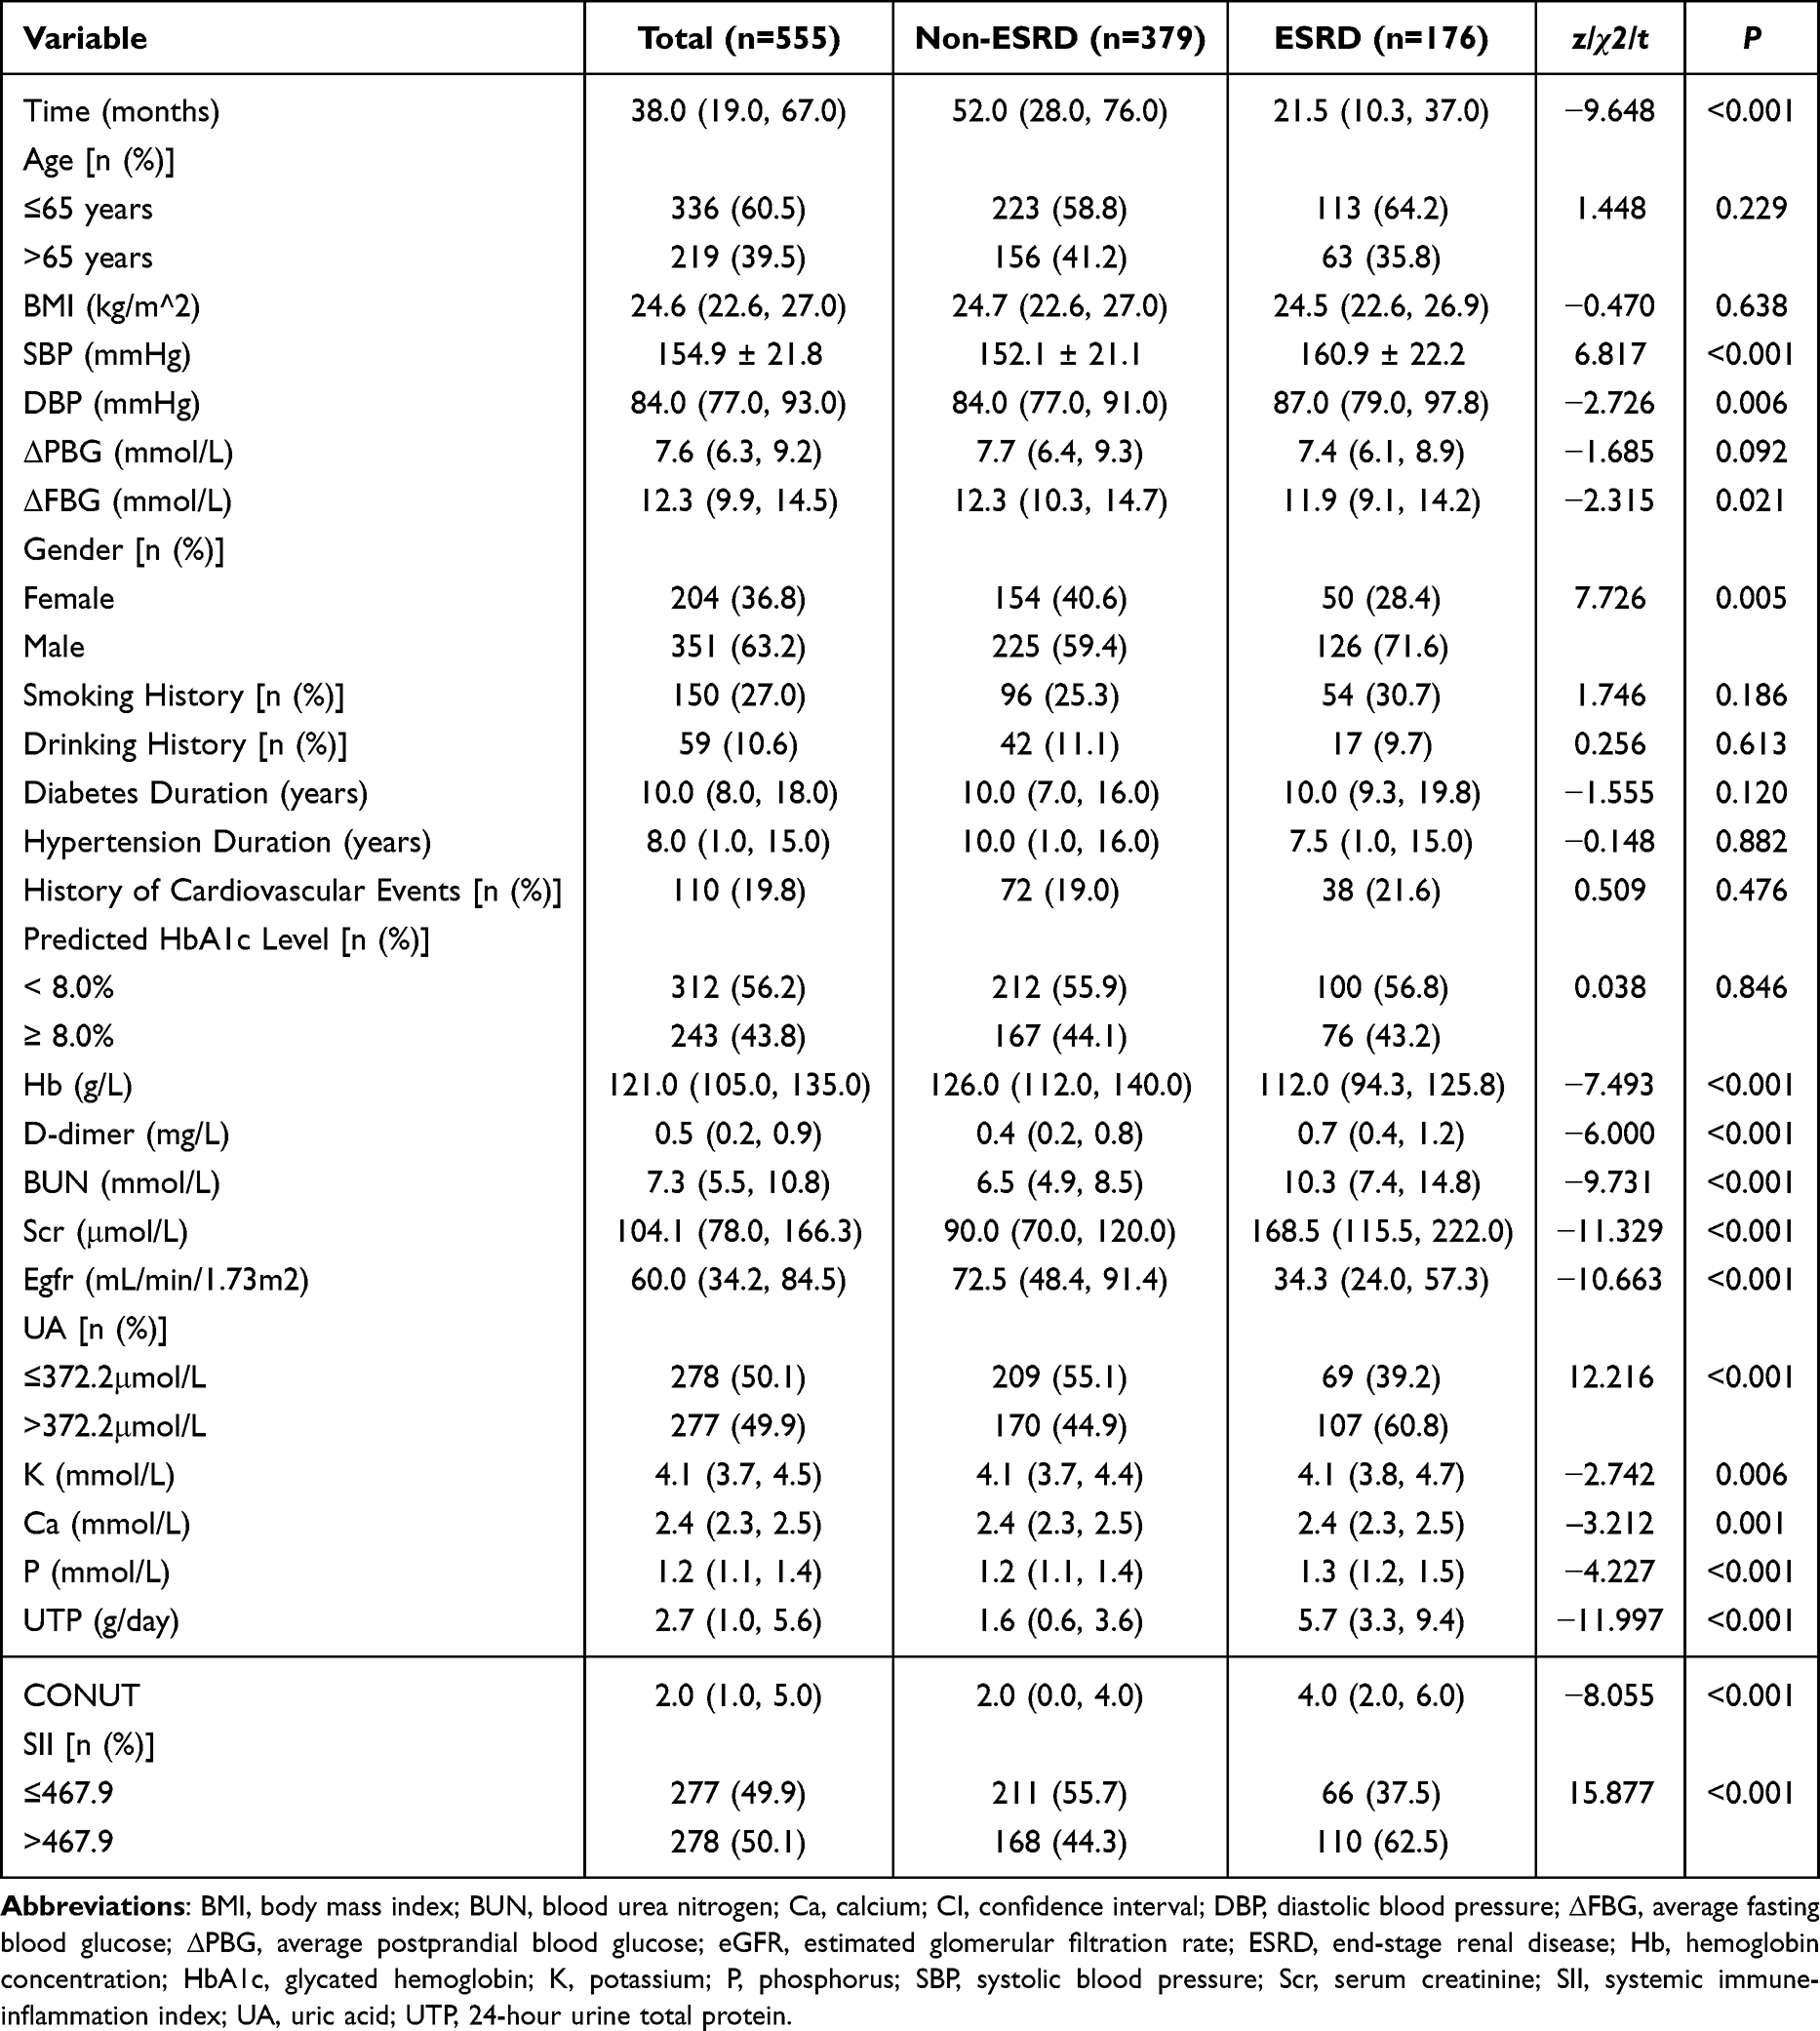 |
Table 1 Baseline Characteristics in Patients with Clinical Diagnosis of DKD |
Identification of Independent Risk Factors for DKD Progression to ESRD Using Cox Proportional Hazards Regression
We employed Cox proportional hazards regression to identify independent significant variables associated with DKD progression to ESRD. Univariate regression analysis showed 15 variables were related to DKD progression to ESRD including gender, age, BMI, SBP, smoking history, Hb, CONUT, D-dimer, eGFR, UA, K, P, UTP, and SII. Ultimately, BMI, eGFR, UTP, CONUT, and SII were identified as independent risk factors for DKD progression to ESRD (Table 2).
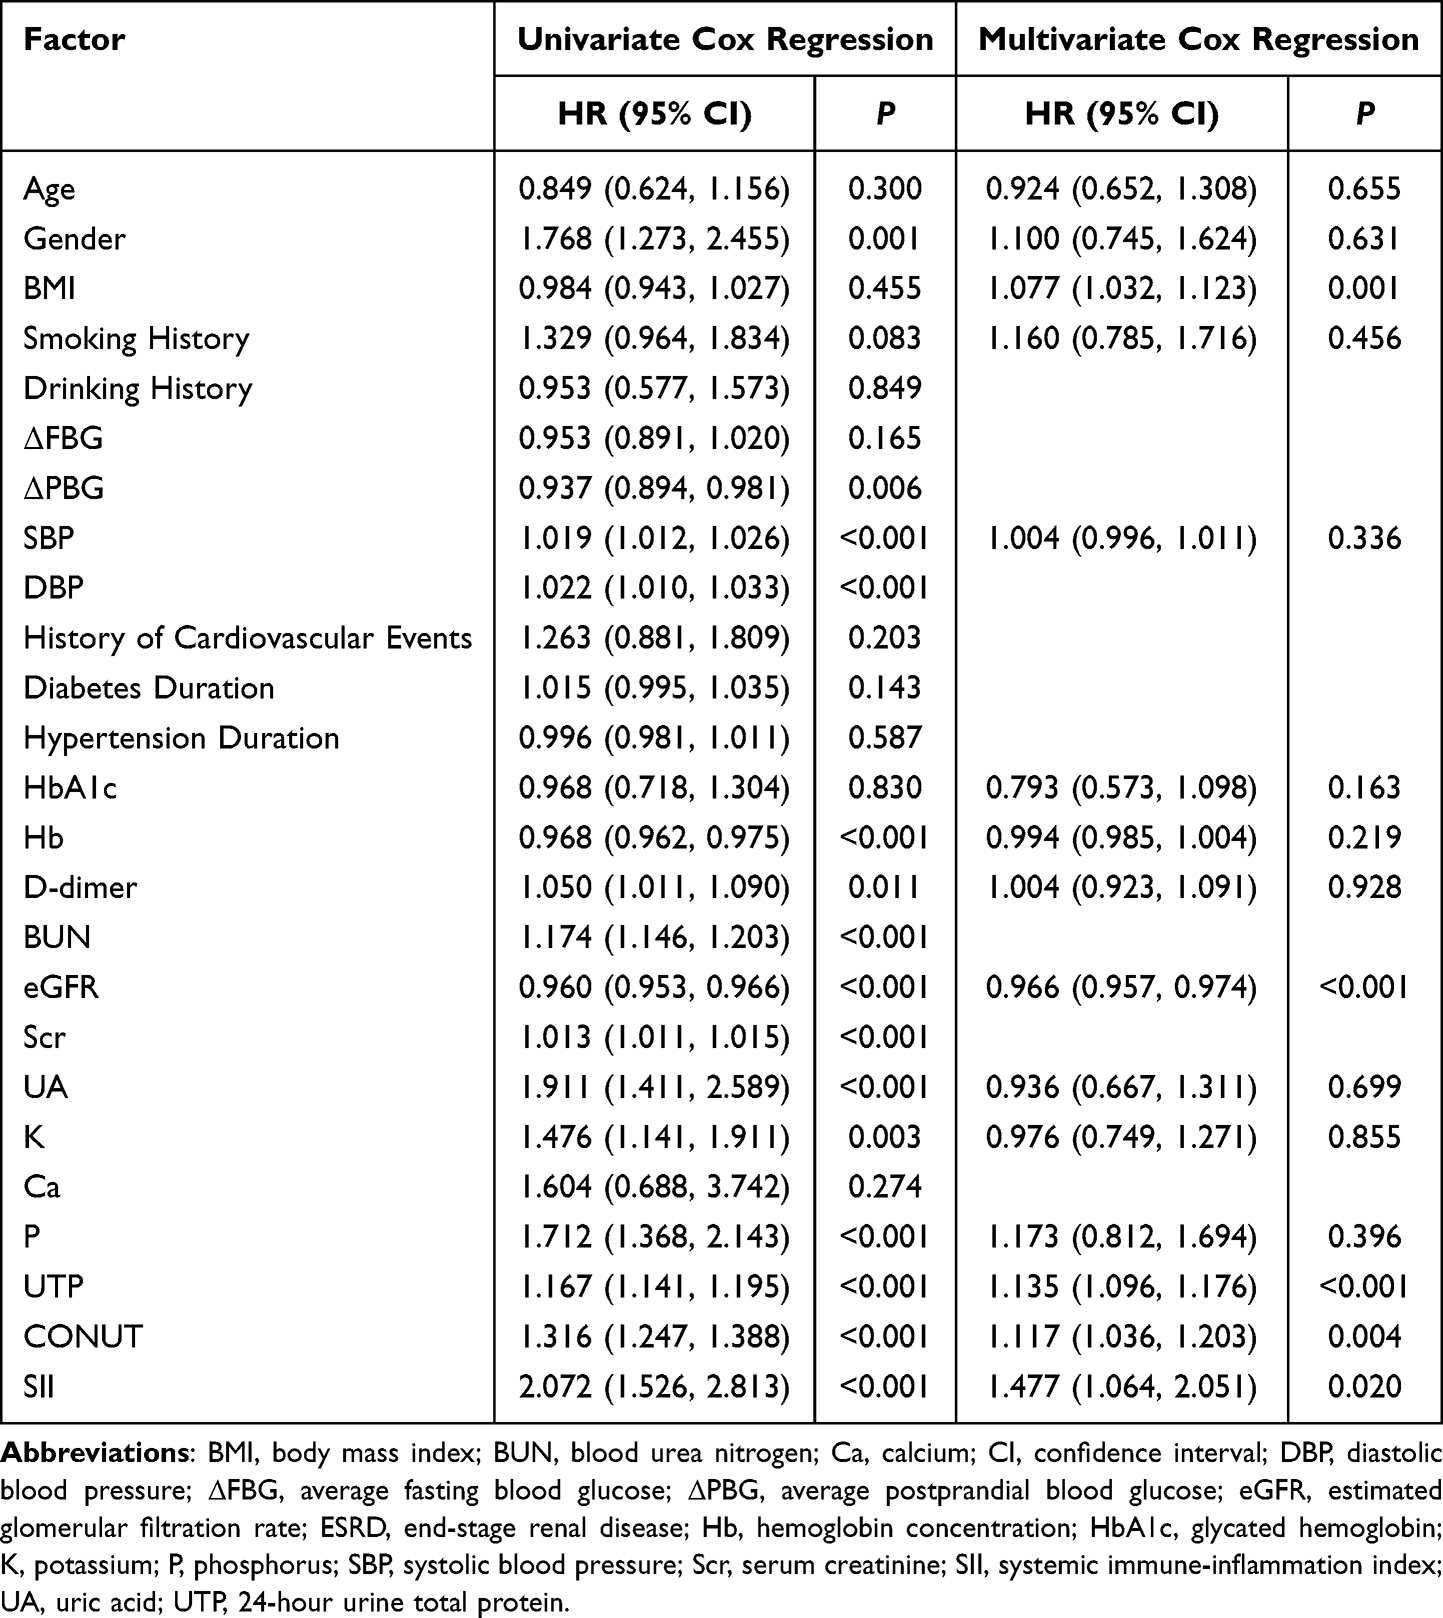 |
Table 2 Cox Regression Analysis of ESRD-Related Risk Factor in Patients with Clinical Diagnosis of DKD |
Evaluating Predictive Performance Based on Cox Proportional Hazards Regression
Time-dependent ROC curves were utilized to assess the predictive performance (Figure 2). The area under the curve (AUC) of ROC curves was 0.901 (95% CI 0.851 to 0.938) at 1 year, 0.894 (95% CI 0.859 to 0.928) at 3 years, and 0.887 (95% CI 0.852 to 0.921) at 5 years.
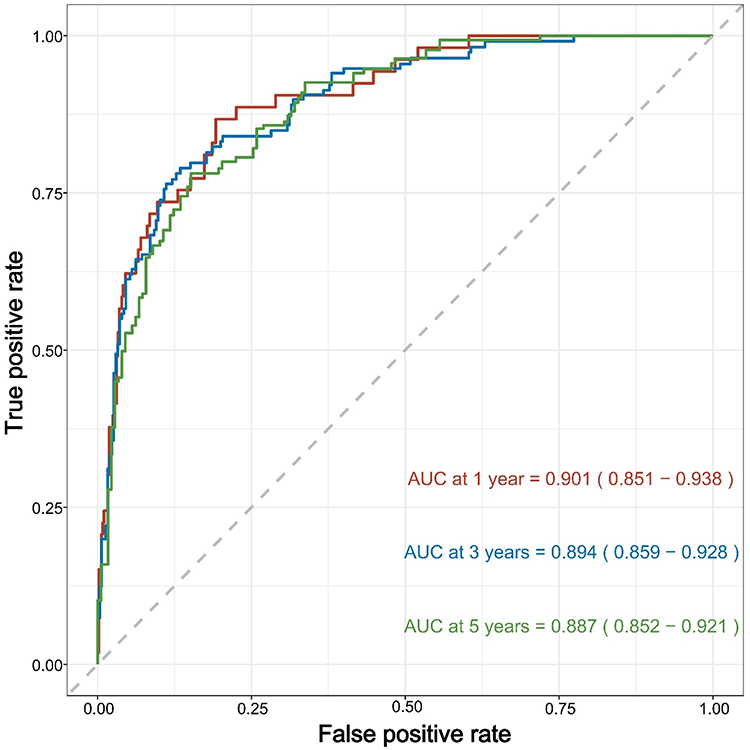 |
Figure 2 Time-Dependent ROC Curves for the Cox Proportional Hazards Model with BMI, eGFR, UTP, CONUT and SII. Abbreviations: AUC, area under the curve; BMI, body mass index; eGFR, estimated glomerular filtration rate; SII, systemic immune-inflammation index; time-dependent ROC, time-dependent receiver operating characteristic; UTP, 24-hour urine total protein. Notes: The X-axis represents the false positive rate, while the Y-axis represents the true positive rate. Curves of different colors correspond to different time points. The red curve represents the ROC curve of the model at 1 year, the blue curve represents the ROC curve at 3 years, and the green curve represents the ROC curve at 5 years. The AUC of time-dependent ROC curves was 0.901 (95% CI 0.851 to 0.938) at 1 year, 0.894 (95% CI 0.859 to 0.928) at 3 years, and 0.887 (95% CI 0.852 to 0.921) at 5 years. |
Cumulative Incidence of ESRD and Death in DKD Patients
Considering ESRD as the endpoint event and all-cause mortality as the competing event (38 cases of all-cause mortality occurred in the non-ESRD group), cumulative incidence functions (CIFs) were plotted (Figure 3). The cumulative incidence of ESRD was 9.8% at 1 year, 18.0% at 2 years, 26.0% at 3 years, 31.0% at 4 years, and 32.0% at 5 years. The cumulative incidence of death was 1.3% at 1 year, 2.8% at 2 years, 4.2% at 3 years, 6.0% at 4 years, and 7.0% at 5 years (Table 3).
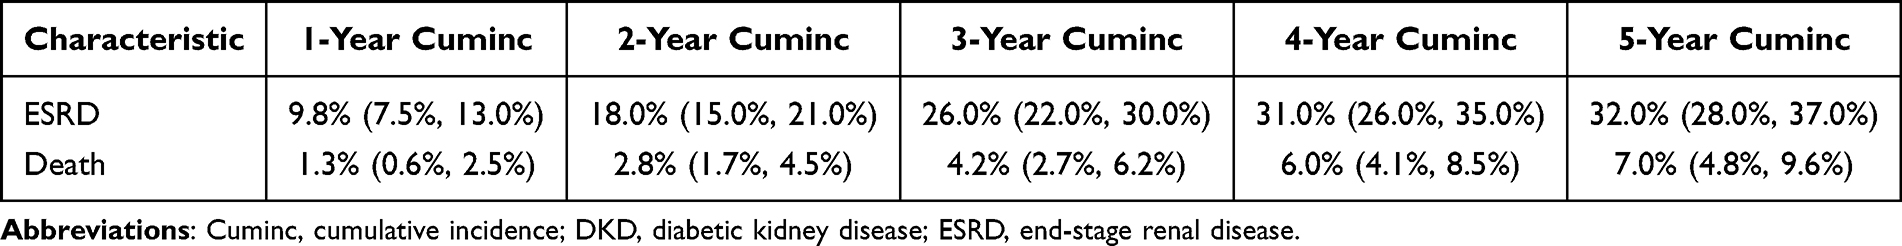 |
Table 3 Cumulative Incidence of ESRD and Death Events Over Time in Patients with Clinical Diagnosis of DKD |
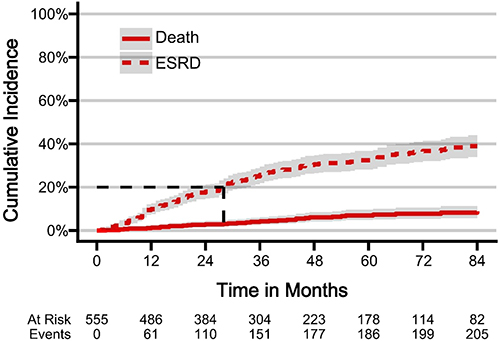 |
Figure 3 Cumulative Incidence Function Curves of ESRD and Death Events Over Time. Abbreviations: DKD, diabetic kidney disease; ESRD, end-stage renal disease. Notes: The figure illustrates the cumulative incidence rates of events for DKD patients during follow-up. The X-axis represents time (months), while the Y-axis represents cumulative incidence rate. The solid line indicates the cumulative incidence rate of death, and the dashed line represents the cumulative incidence rate of progression to ESRD. |
Identification of Independent Risk Factors for DKD Progression to ESRD Using Competing Risk Regression
For competing risk regression analysis, all-cause mortality was considered as a competing event. After excluding highly collinear factors and selecting 14 variables related to ESRD for multivariable regression analysis, BMI, eGFR, UTP and CONUT were identified as independent risk factors for DKD progression to ESRD (Table 4).
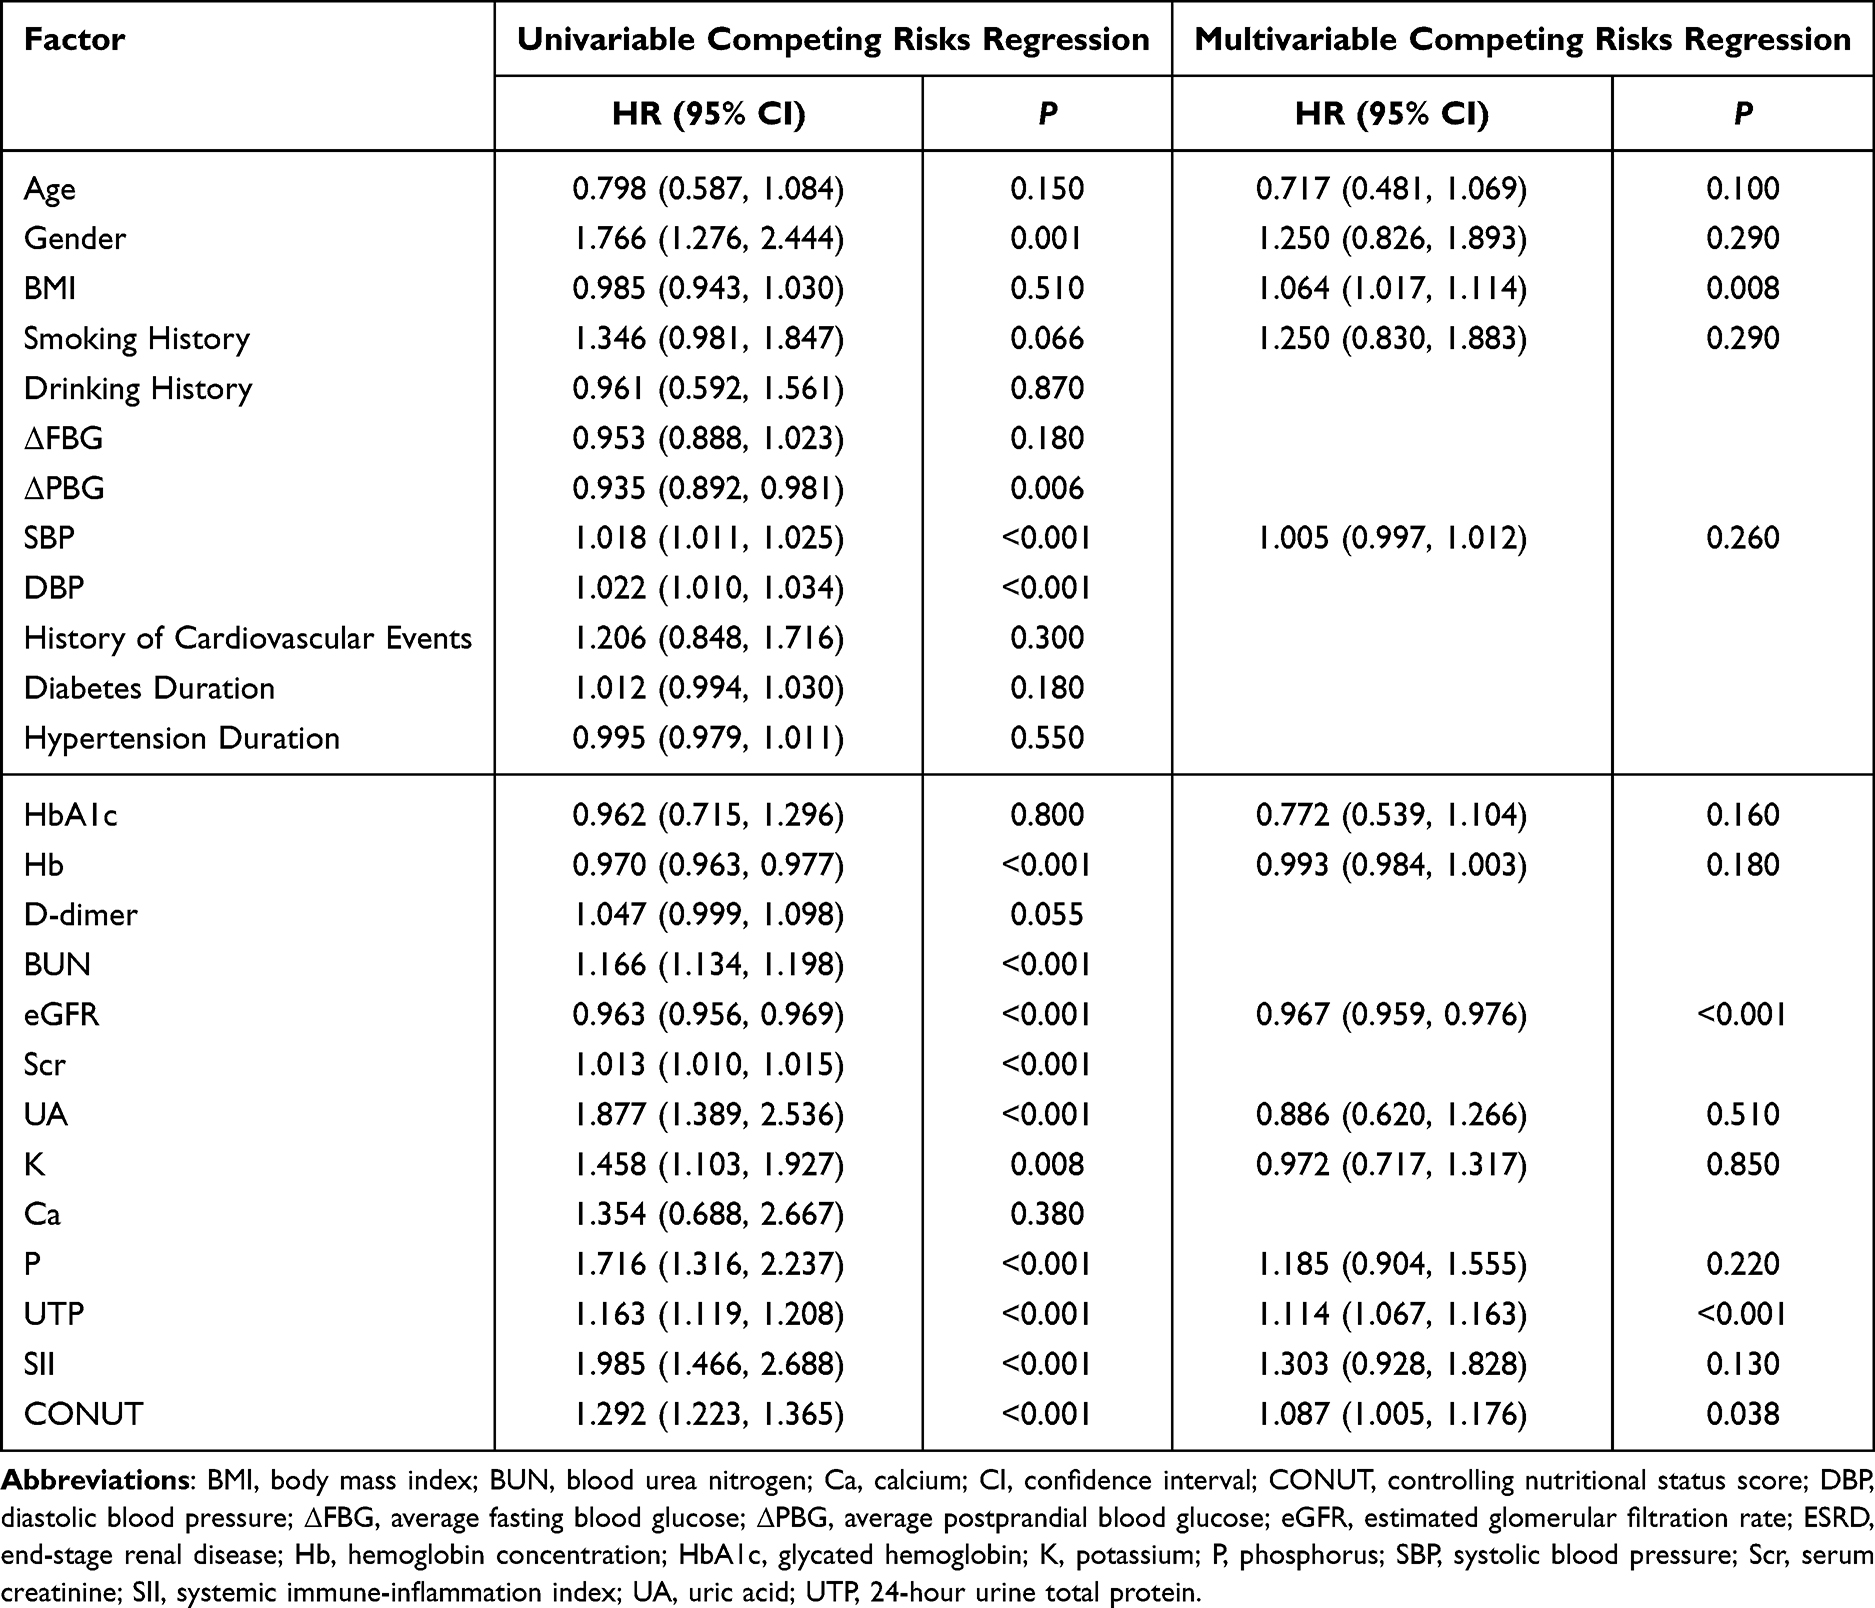 |
Table 4 Competing Risks Regression of ESRD-Related Risk Factor |
Evaluating Predictive Performance Based on Competitive Risk Regression
Time-dependent ROC curves were utilized to assess the predictive performance. The area under the curve (AUC) for the competing risks regression model was 0.897 (95% CI 0.847 to 0.939) at 1 year, 0.890 (95% CI 0.853 to 0.922) at 3 years, and 0.882 (95% CI 0.843 to 0.917) at 5 years (Figure 4).
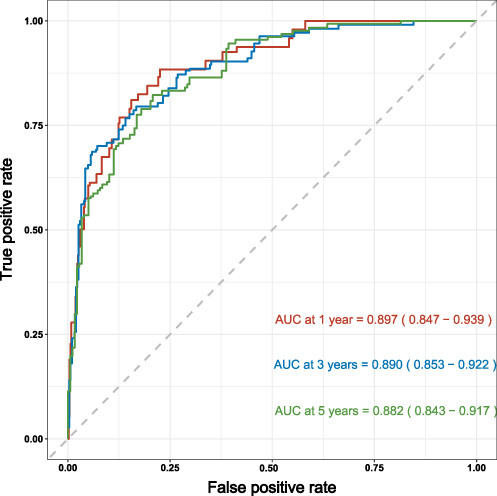 |
Figure 4 Time-Dependent ROC Curves for the Competing Risks Model with BMI, eGFR, UTP and CONUT. Abbreviations: AUC, area under the curve; BMI, body mass index; eGFR, estimated glomerular filtration rate; time-dependent ROC, time-dependent receiver operating characteristic; UTP, 24-hour urine total protein. Notes: The X-axis represents the false positive rate, while the Y-axis represents the true positive rate. Curves of different colors correspond to different time points. The red curve represents the ROC curve of the model at 1 year, the blue curve represents the ROC curve at 3 years, and the green curve represents the ROC curve at 5 years. The AUC of time-dependent ROC was 0.897 (95% CI 0.847 to 0.939) at 1 year, 0.890 (95% CI 0.853 to 0.922) at 3 years, and 0.882 (95% CI 0.843 to 0.917) at 5 years. |
Patients with Biopsy-Proven DKD
Baseline Characteristics
In the cohort of 555 patients clinically diagnosed with DKD, 85 patients underwent renal biopsy for confirmation. These patients were followed for a median duration of 32.0 (18.0, 49.0) months, and 30 patients (35.3%) progressed to ESRD. Baseline characteristics of the 85 patients are detailed in Table 5, respectively. Higher levels of D-dimer, Scr, UTP, UACR, and CONUT were found in the ESRD group. Meanwhile, more severe glomerular lesions, IFTA, and a higher prevalence of K-W nodules were presented in the ESRD group, along with lower Hb, eGFR and KFRE scores.
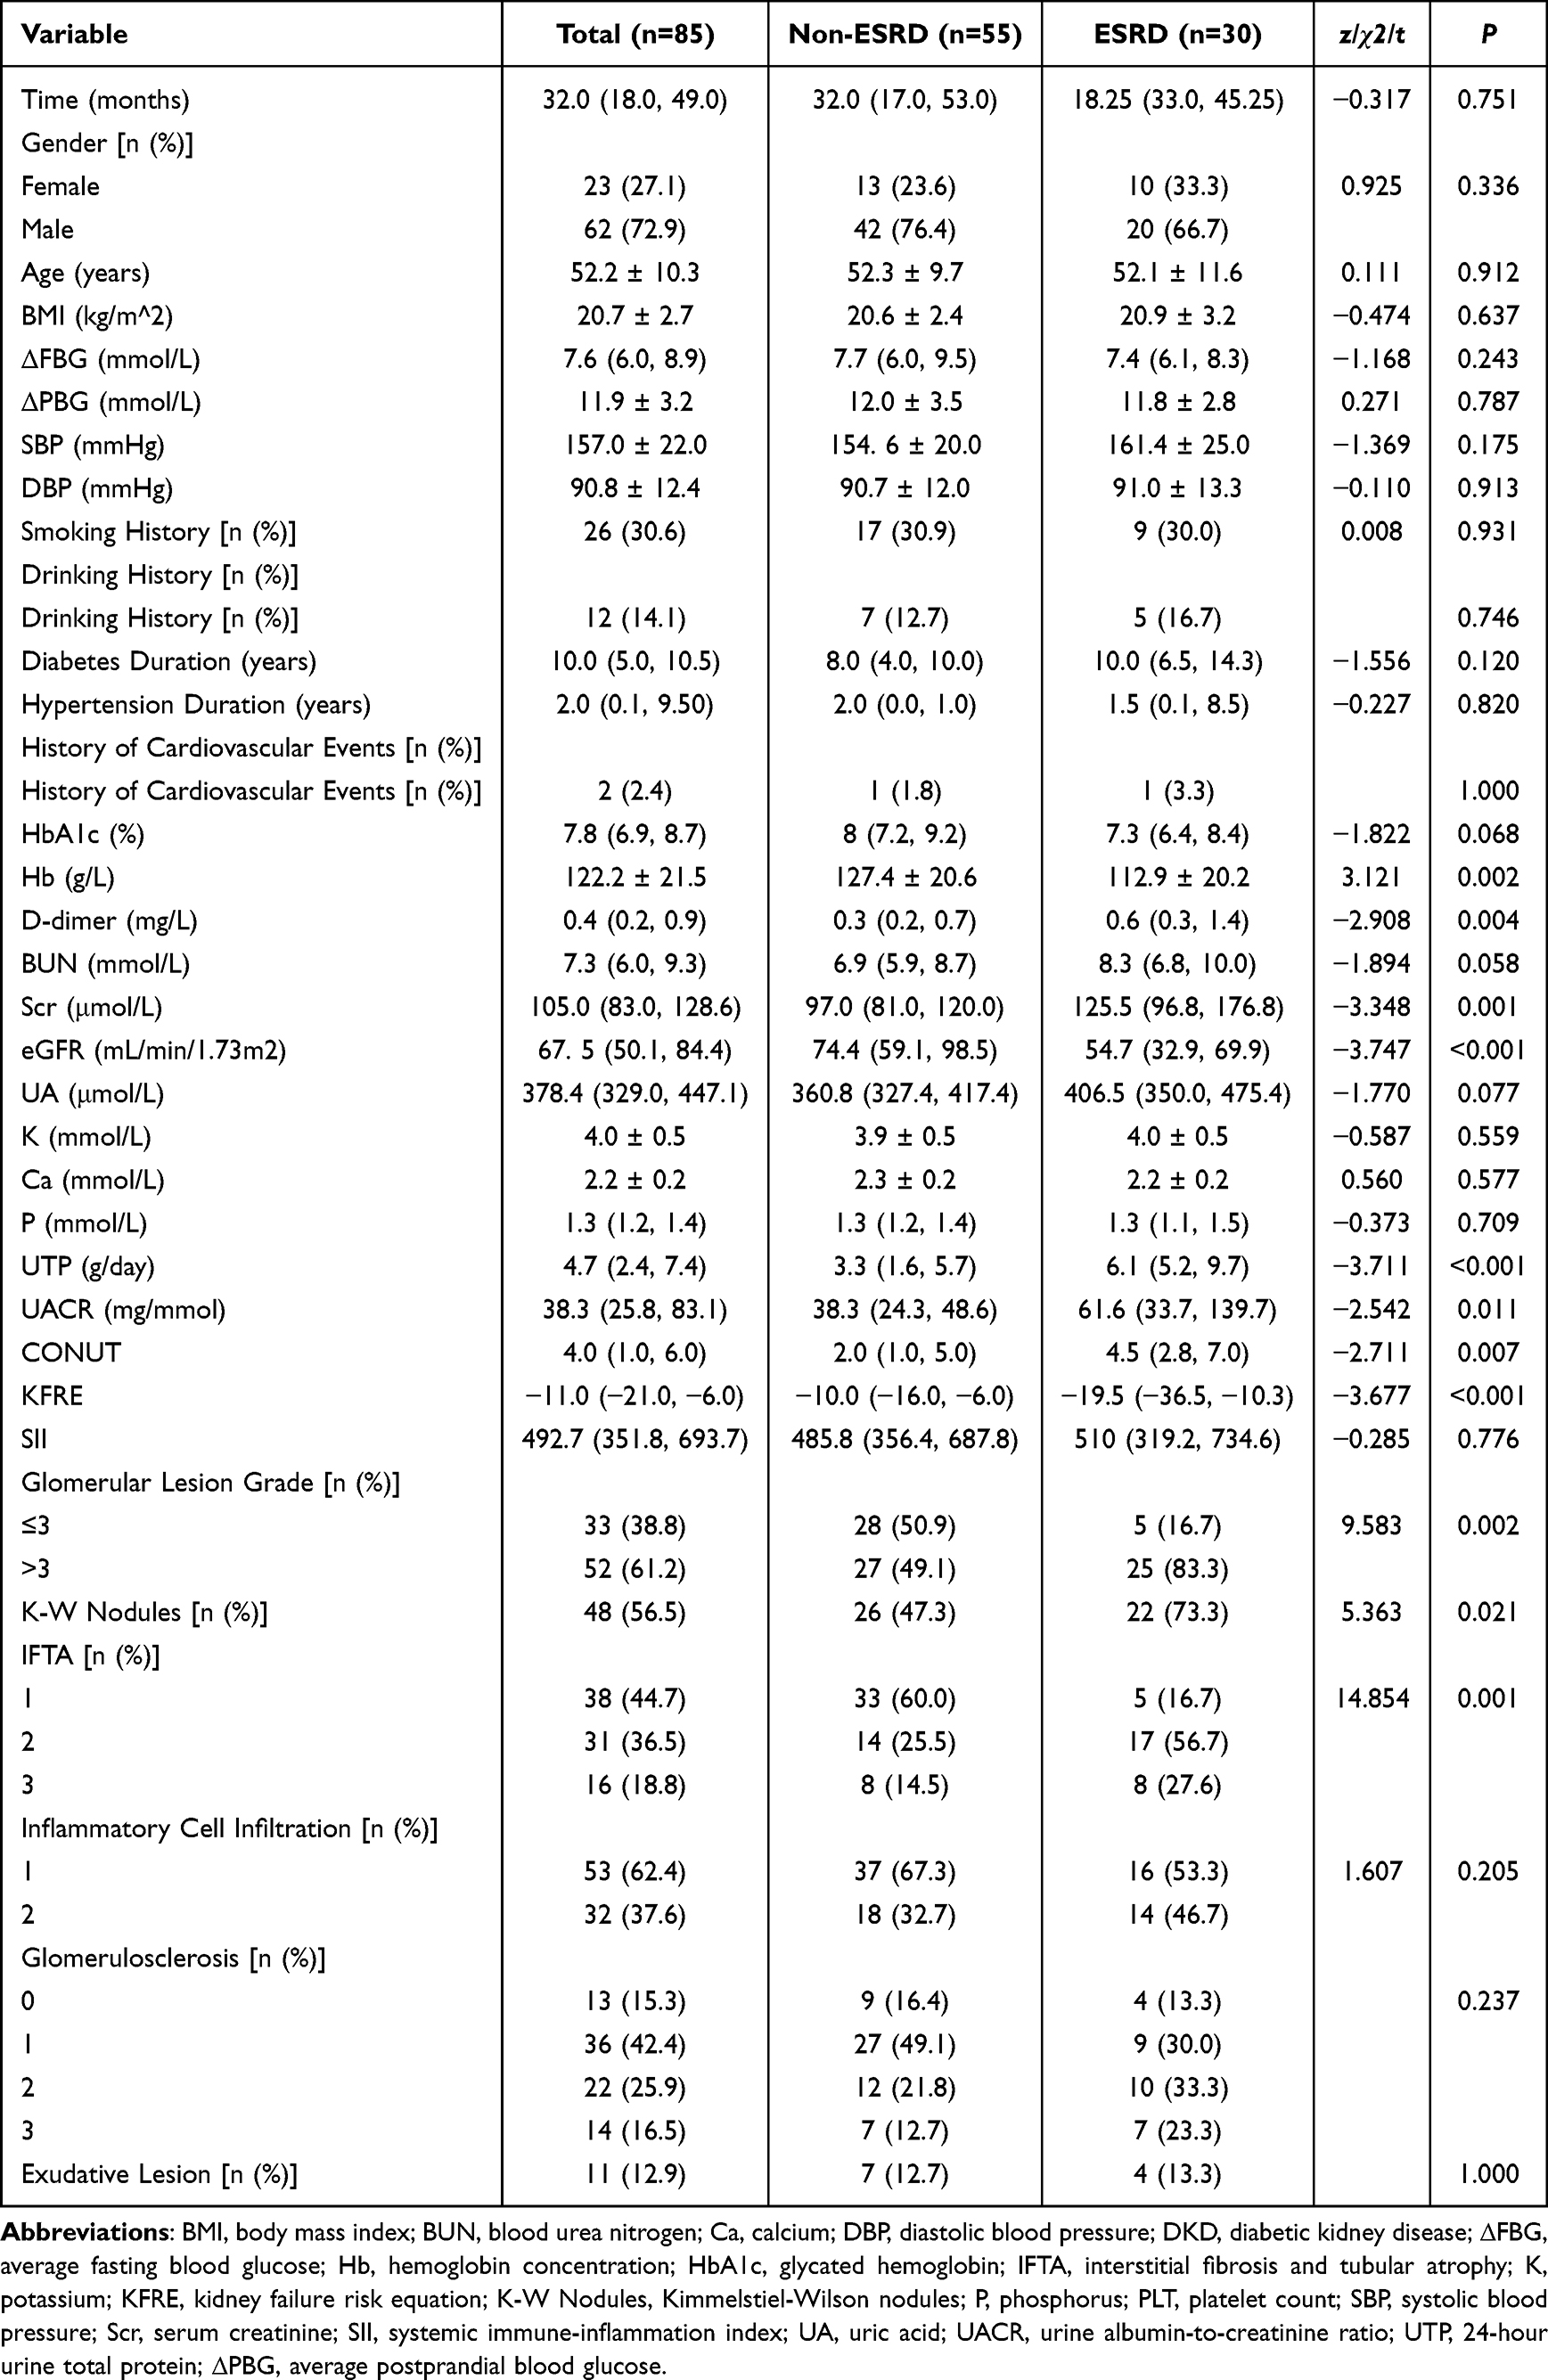 |
Table 5 Baseline Characteristics in Patients with Pathologic Diagnosis of DKD |
IFTA as a Significant Independent Risk Factor for DKD Progression to ESRD
Univariate and multivariate Cox regression analyses were conducted on the pathological data to identify independent risk factors. The results are summarized in Table 6, and highlighted IFTA as a significant independent risk factor for progression to ESRD in DKD patients.
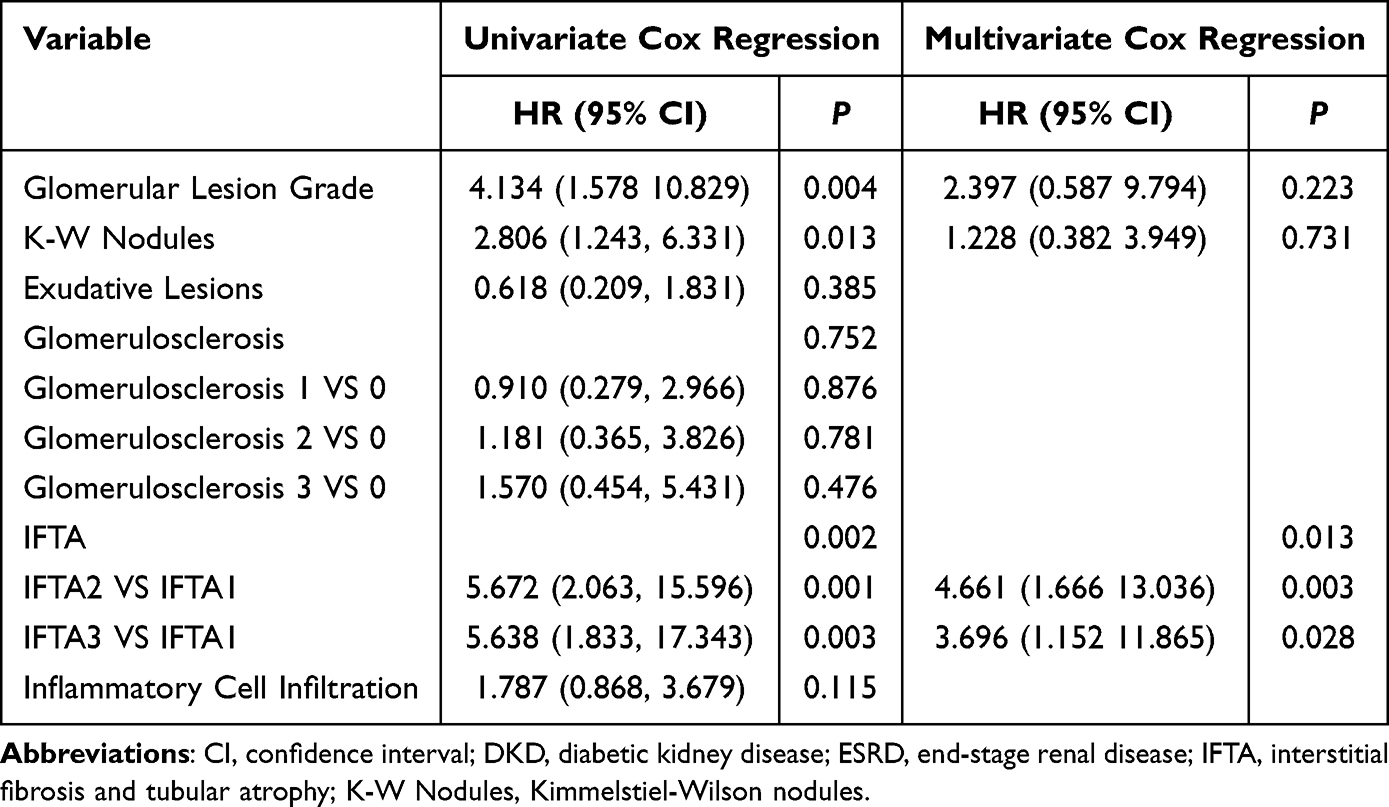 |
Table 6 Cox Regression Analysis of ESRD-Related Pathologic Risk Factors in Patients with Pathologic Diagnosis of DKD |
Predictive Value of Combined KFRE Scores and IFTA in DKD Progression
K-M curves (Figure 5A) were plotted for different IFTA grade groups, showing a significantly higher rate of DKD progression in the high IFTA grade group compared to the low-grade group (P = 0.004). Additionally, based on KFRE scores divided into high and low groups using the optimal cutoff value (optimal cutoff value =−16), K-M curves (Figure 5B) demonstrated a markedly higher rate of DKD progression in the low KFRE score group compared to the high score group (P < 0.001).
 |
Figure 5 K-M Curves for DKD Patients Stratified by IFTA and KFRE Groups. Abbreviations: DKD, diabetic kidney disease; IFTA, interstitial fibrosis and tubular atrophy; KFRE, kidney failure risk equation; K-M curves, Kaplan-Meier curves. Notes: The X-axis represents time (months) and the Y-axis represents survival rate. (A) The green curve indicates the progression rate of kidney disease for patients with IFTA grade 1, the blue curve for patients with IFTA grade 2, and the red curve for patients with IFTA grade 3. Differences between the curves were compared using the Log rank test, with a p-value of 0.004. (B) The blue curve indicates the progression rate of kidney disease for patients in the high KFRE score group, while the red curve represents the low KFRE score group. Differences between the curves were compared using the Log rank test, with a p-value of <0.001. |
To assess the predictive performance of KFRE combined with other indicators for DKD progression to ESRD, time-dependent ROC curves were plotted for four models: KFRE (Model 1), KFRE combined with IFTA (Model 2), KFRE combined with IFTA and SII (Model 3), and KFRE combined with IFTA, SII, and BMI (Model 4). Figure 6 shows the predictive performance of four models at two years. Figure 7 displays the predictive performance at five years. Full details of the AUC values from the time-dependent ROC curves can be found in Table 7. The results showed that Model 4 demonstrated strong predictive accuracy at both 2-year and 5-year intervals, with a significant enhancement in performance observed at the 5-year mark.
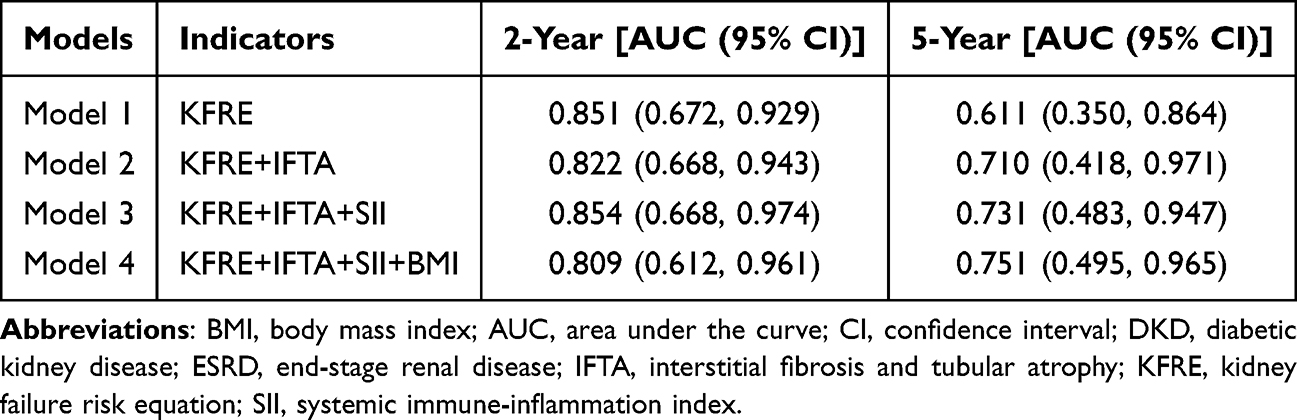 |
Table 7 AUC for Predicting ESRD Progression in Patients with Pathologically Diagnosed DKD Using KFRE Combined with Other Indicators |
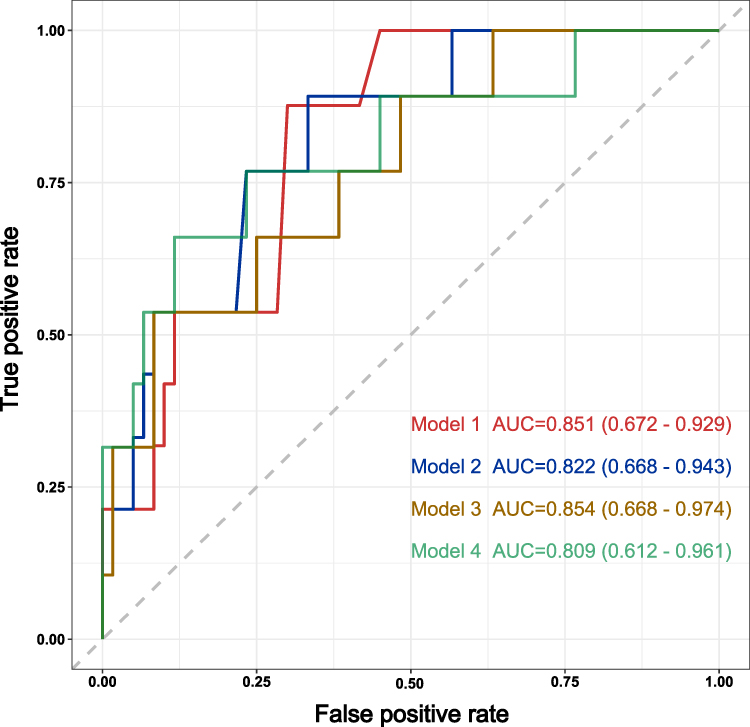 |
Figure 6 Time-Dependent ROC Curve of the KFRE Combined with Other Indicators at Two Years. Abbreviations: BMI, body mass index; AUC, area under the curve; IFTA, interstitial fibrosis and tubular atrophy; SII, systemic immune-inflammation index; time-dependent ROC, time-dependent receiver operating characteristic. Notes: The X-axis represents the false positive rate, while the Y-axis represents the true positive rate. Curves of different colors correspond to different time points. The red line represents the curve for Model 1 (KFRE), with an AUC value of 0.851 (95% CI 0.672 to 0.929). The blue line corresponds to Model 2 (KFRE, IFTA), with an AUC value of 0.822 (95% CI 0.668 to 0.943). The yellow line illustrates Model 3 (KFRE, IFTA, SII), with an AUC value of 0.854 (95% CI 0.668 to 0.974). The green line depicts Model 4 (KFRE, IFTA, SII, BMI), with an AUC value of 0.809 (95% CI 0.612 to 0.961). |
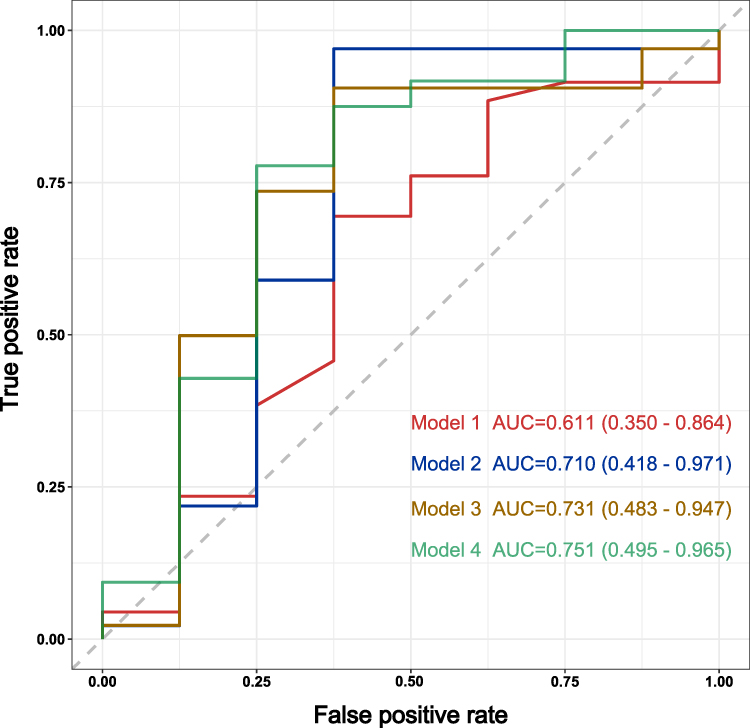 |
Figure 7 Time-Dependent ROC Curve of the KFRE Combined with Other Indicators at Five Years. Abbreviations: A BMI, body mass index; AUC, area under the curve; IFTA, interstitial fibrosis and tubular atrophy; SII, systemic immune-inflammation index; time-dependent ROC, time-dependent receiver operating characteristic. Notes: The X-axis represents the false positive rate, while the Y-axis represents the true positive rate. Curves of different colors correspond to different time points. The red line represents the curve for Model 1 (KFRE), with an AUC value of 0.611 (95% CI 0.350 to 0.864). The blue line corresponds to Model 2 (KFRE, IFTA), with an AUC value of 0.710 (95% CI 0.418 to 0.971). The yellow line illustrates Model 3 (KFRE, IFTA, SII), with an AUC value of 0.731 (95% CI 0.483 to 0.947). The green line depicts Model 4 (KFRE, IFTA, SII, BMI), with an AUC value of 0.751 (95% CI 0.495 to 0.965). |
Discussion
Our study initially analyzed 555 patients with a clinical diagnosis of DKD. Among them, 176 developed ESRD, and 38 died from various causes. We utilized Cox regression and competing risk regression to identify independent predictors, then assessed predictive performance using time-dependent ROC curves. Notably, the model derived from Cox regression, incorporating non-traditional risk factors like SII and CONUT, exhibited even better performance. Furthermore, in a prognostic analysis involving 85 patients pathologically diagnosed with DKD, ROC curves illustrated that the combination of IFTA, KFRE, SII and BMI had high predictive capability for DKD progression to ESRD.
In our study, we identified five variables (BMI, eGFR, UTP, SII, CONUT) as independent risk factors for DKD progression to ESRD in the Cox regression model. Previous research has shown that a higher BMI is linked to an increased risk of DKD, while decreased eGFR and renal fat deposition can impact renal hemodynamics and regulation.20 Proteinuria can lead to kidney damage, inflammation, and fibrosis by triggering processes like autophagy dysfunction21 and endoplasmic reticulum stress.22 Elevated protein excretion exacerbates kidney progression.23 Studies have highlighted the prognostic significance of CONUT scores in dialysis24 and CKD patients, with higher scores indicating poorer nutritional status and correlating with adverse outcomes such as worsening kidney function and increased mortality rates.25 Recent evidence also supports CONUT as a risk factor for DKD progression,26 aligning with our study findings.
SII serves as a marker assessing the body’s inflammatory status and immune response. According to the calculation formula of SII, SII is closely related to PLT, NEU and LYM. Studies have shown that cytokines and chemokines released by activated PLT exacerbate glomerular damage and proteinuria in DKD.27 Additionally, PLT-derived microparticles enhance oxidative stress, further accelerating the progression of DKD.28 Antiplatelet therapy may have a beneficial effect in preventing the progression of DKD.29,30 Furthermore, studies have shown that the PLT-to-LYM ratio (PLR) and the NEU-to-LYM ratio (NLR) are not only associated with the occurrence of DKD31 but also serve as independent risk factors for the progression of DKD.32,33 Thus, it is evident that the SII, which integrates PLT, LYM, and NEU, holds significant importance in the prognostic evaluation of DKD. Research in kidney diseases reveals a positive relationship between SII and increased urinary albumin excretion,34 while SII levels are linked to CKD prevalence and mortality rates.35 Recent investigations have associated higher SII levels with DKD occurrence,36 though its role in DKD progression remained unclear until our study. We uncovered SII as an independent risk factor for DKD progression to ESRD, suggesting its potential as a biomarker for early risk identification in DKD progression. Utilizing SII may facilitate early intervention and personalized treatment strategies, ultimately enhancing prognosis and quality of life in DKD patients. Future studies should validate SII’s reliability in clinical settings and explore its practical applications in managing DKD.
In our center’s long-term patient follow-up, findings revealed that individuals with DKD not only face the risk of ESRD but also other competing events that can lead to mortality. To assess how different events impact survival and disease progression in DKD patients and to address potential limitations of the Cox model, which assumes single events, we employed a competing risk model. The strength of this approach lies in its ability to account for multiple competing events comprehensively. Recent research on building clinical prediction models has indicated that competing risk models offer more precise estimates of event probabilities, thereby enhancing the accuracy and usefulness of prognostic forecasts.37 In our investigation, we observed that five variables (BMI, eGFR, UTP, SII, CONUT) in the Cox regression model overlap with the four variables (BMI, eGFR, UTP, CONUT) used in the competing risk model. Our center’s study suggests that the relatively sparse occurrence of competing events (such as all-cause mortality) allowed the Cox model to perform better due to its simpler assumptions. As a result, we deem the Cox model appropriate for our study, as it exhibited good performance with an AUC at 1 year, 3 years, and 5 years.
Prior studies have indicated the strong predictive role of KFRE in assessing the risk of progression to ESRD at 2 and 5 years in patients with mid-to-late-stage DKD.38 In our study, we observed that the low KFRE score group exhibited a significantly higher rate of DKD progression compared to the high KFRE score group. Therefore, we incorporated the KFRE into our analysis to compare the predictive value of KFRE combined with other indicators for DKD prognostic prediction. Our study demonstrated that the combined KFRE and IFTA prognostic model exhibited high predictive accuracy at 2 years and 5 years, as evidenced by the high AUC values. These results highlight the notable predictive value of IFTA and KFRE in predicting DKD progression to ESRD. Consistent with previous finding,10 our study identified IFTA as an independent risk factor for DKD progression. Notably, there is currently a lack of research incorporating pathological indicators into prognostic models. We further incorporated the independent risk factors previously identified through Cox proportional hazards regression and competing risk regression into our model. Given the overlapping factors with other indicators in the CONUT score, we decided to exclude its use. The results indicated that the model (Model 4), incorporating SII and BMI, exhibited high predictive accuracy at both 2 years and 5 years, with a notable improvement in performance at the 5-year mark. This finding underscores that the combination of SII and BMI not only enhances the model’s predictive capability but also provides a more reliable risk assessment over a longer follow-up period. These results emphasize the value of integrating multiple indicators to improve prognostic predictions, supporting further research and clinical application. Future studies should expand sample sizes to validate our model’s accuracy in diverse populations. Incorporating additional clinical and pathological data may further optimize the model for personalized risk assessments and management. Long-term prospective studies will also help confirm the clinical significance of SII, BMI, KFRE, and IFTA in DKD progression, providing evidence for future interventions.
This study has several limitations, including the lack of external validation and reliance on data from a single center, which may limit the model’s generalizability. Additionally, excluding patients with missing data or those lost to follow-up may introduce selection bias. However, not all missing data were deleted. For variables with missing data rates below 10%, appropriate imputation methods were applied. Future research should include multicenter studies, larger cohorts, and multi-ethnic validation to assess the model’s applicability and generalizability in diverse populations. Incorporating novel predictors and technologies such as genomics, metabolomics, and artificial intelligence techniques like machine learning could improve the model’s accuracy and personalization. Prospective studies are also needed to evaluate early intervention strategies that may delay or prevent DKD progression to ESRD, ultimately improving patient outcomes.
Conclusion
In summary, BMI, eGFR, UTP, SII, and CONUT have emerged as key predictors of DKD progression to ESRD. Our study highlights the critical roles of SII and CONUT in the advancement of DKD. The combined model integrating KFRE, IFTA, SII, and BMI demonstrates high predictive accuracy in pathologically diagnosed DKD cases. Moving forward, future research should prioritize large-scale, multicenter, and multiethnic cohort studies to validate these findings and enhance the generalizability of these predictors across diverse populations. Specific gaps that need to be addressed include examining regional variations in DKD progression, exploring the inclusion of additional biomarkers (eg, genetic markers or novel inflammatory markers), and evaluating the role of individualized risk factors in different demographic groups. Moreover, the practical application of KFRE and renal pathology in DKD management should be further explored in real-world clinical settings to optimize patient care.
Approval of the Research Protocol
This study was conducted in accordance with the Declaration of Helsinki and approved by the Ethics Committee of the Third Affiliated Hospital of Soochow University (Approval No. 2024#22).
Informed Consent
All individuals provided written informed consent for this research study.
Funding
This work was supported by grants from the National Natural Science Foundation of China (82000684), the Top Talent of Changzhou “The 14th Five-Year Plan” High-Level Health Talents Training Project (2022260), Changzhou Sci & Tech Program (Grant No. CJ20241111), and Changzhou Key Medical Discipline.
Disclosure
No competing financial interests exist.
References
1. Sun H, Saeedi P, Karuranga S, et al. IDF diabetes atlas: global, regional and country-level diabetes prevalence estimates for 2021 and projections for 2045. Diabet Res Clin Pract. 2022;183:109119. doi:10.1016/j.diabres.2021.109119
2. Tanase DM, Gosav EM, Anton MI, et al. Oxidative stress and NRF2/KEAP1/ARE pathway in diabetic kidney disease (DKD): new perspectives. Biomolecules. 2022;12(9):1227. doi:10.3390/biom12091227
3. Scilletta S, Di Marco M, Miano N, et al. Update on diabetic kidney disease (DKD): focus on non-albuminuric DKD and cardiovascular risk. Biomolecules. 2023;13(5):752. doi:10.3390/biom13050752
4. Yamazaki T, Mimura I, Tanaka T, Nangaku M. Treatment of diabetic kidney disease: current and future. Diab Metab J. 2021;45(1):11–26. doi:10.4093/dmj.2020.0217
5. Hsing SC, Lee CC, Lin C, Chen JT, Chen YH, Fang WH. The severity of diabetic retinopathy is an independent factor for the progression of diabetic nephropathy. J Clin Med. 2020;10(1):3. doi:10.3390/jcm10010003
6. Zou Y, Zhao L, Zhang J, et al. Development and internal validation of machine learning algorithms for end-stage renal disease risk prediction model of people with type 2 diabetes mellitus and diabetic kidney disease. Ren Fail. 2022;44(1):562–570. doi:10.1080/0886022x.2022.2056053
7. Moriya T, Yamagishi T, Matsubara M, Ouchi M. Serial renal biopsies in normo- and microalbuminuric patients with type 2 diabetes demonstrate that loss of renal function is associated with a reduction in glomerular filtration surface secondary to mesangial expansion. J Diabetes Complications. 2019;33(5):368–373. doi:10.1016/j.jdiacomp.2019.02.002
8. Zhao L, Zhang J, Lei S, et al. Combining glomerular basement membrane and tubular basement membrane assessment improves the prediction of diabetic end-stage renal disease. J Diabetes. 2021;13(7):572–584. doi:10.1111/1753-0407.13150
9. Furuichi K, Yuzawa Y, Shimizu M, et al. Nationwide multicentre kidney biopsy study of Japanese patients with type 2 diabetes. Nephrol Dial Transplant. 2018;33(1):138–148. doi:10.1093/ndt/gfw417
10. Stefan G, Stancu S, Zugravu A, Petre N, Mandache E, Mircescu G. Histologic predictors of renal outcome in diabetic nephropathy: beyond renal pathology society classification. Medicine. 2019;98(27):e16333. doi:10.1097/md.0000000000016333
11. Lin YC, Chang YH, Yang SY, Wu KD, Chu TS. Update of pathophysiology and management of diabetic kidney disease. J Formos Med Assoc. 2018;117(8):662–675. doi:10.1016/j.jfma.2018.02.007
12. Singh DK, Winocour P, Farrington K. Oxidative stress in early diabetic nephropathy: fueling the fire. Nat Rev Endocrinol. 2011;7(3):176–184. doi:10.1038/nrendo.2010.212
13. Jin Q, Liu T, Qiao Y, et al. Oxidative stress and inflammation in diabetic nephropathy: role of polyphenols. Front Immunol. 2023;14:1185317. doi:10.3389/fimmu.2023.1185317
14. Tangri N, Stevens LA, Griffith J, et al. A predictive model for progression of chronic kidney disease to kidney failure. JAMA. 2011;305(15):1553–1559. doi:10.1001/jama.2011.451
15. Tangri N, Grams ME, Levey AS, et al. Multinational assessment of accuracy of equations for predicting risk of kidney failure: a meta-analysis. JAMA. 2016;315(2):164–174. doi:10.1001/jama.2015.18202
16. Hu B, Yang XR, Xu Y, et al. Systemic immune-inflammation index predicts prognosis of patients after curative resection for hepatocellular carcinoma. Clin Cancer Res. 2014;20(23):6212–6222. doi:10.1158/1078-0432.Ccr-14-0442
17. Wei X, Chen X, Zhang Z, et al. Risk analysis of the association between different hemoglobin glycation index and poor prognosis in critical patients with coronary heart disease-A study based on the MIMIC-IV database. Cardiovasc Diabetol. 2024;23(1):113. doi:10.1186/s12933-024-02206-1
18. Fu L, Zhou Y, Sun J, et al. Atherogenic index of plasma is associated with major adverse cardiovascular events in patients with type 2 diabetes mellitus. Cardiovasc Diabetol. 2021;20(1):201. doi:10.1186/s12933-021-01393-5
19. Tervaert TW, Mooyaart AL, Amann K, et al. Pathologic classification of diabetic nephropathy. J Am Soc Nephrol. 2010;21(4):556–563. doi:10.1681/asn.2010010010
20. Lu J, Liu X, Jiang S, et al. Body mass index and risk of diabetic nephropathy: a Mendelian randomization study. J Clin Endocrinol Metab. 2022;107(6):1599–1608. doi:10.1210/clinem/dgac057
21. Zhan M, Usman IM, Sun L, Kanwar YS. Disruption of renal tubular mitochondrial quality control by Myo-inositol oxygenase in diabetic kidney disease. J Am Soc Nephrol. 2015;26(6):1304–1321. doi:10.1681/asn.2014050457
22. El Karoui K, Viau A, Dellis O, et al. Endoplasmic reticulum stress drives proteinuria-induced kidney lesions via Lipocalin 2. Nat Commun. 2016;7:10330. doi:10.1038/ncomms10330
23. Makhammajanov Z, Gaipov A, Myngbay A, Bukasov R, Aljofan M, Kanbay M. Tubular toxicity of proteinuria and the progression of chronic kidney disease. Nephrol Dial Transplant. 2024;39(4):589–599. doi:10.1093/ndt/gfad215
24. Takagi K, Takahashi H, Miura T, et al. Prognostic value of the controlling nutritional status (CONUT) score in patients at dialysis initiation. Nutrients. 2022;14(11):2317. doi:10.3390/nu14112317
25. Zhang J, Xiao X, Han T, Liu Y, Shuai P. Relationship between immune nutrition index and all-cause and cause-specific mortality in U.S. adults with chronic kidney disease. Front Nutr. 2023;10:1264618. doi:10.3389/fnut.2023.1264618
26. Huo Q, He T, Xiong J, Zhao J. Controlling nutritional status score is associated with renal progression, cardiovascular events, and all-cause mortality in biopsy-proved diabetic kidney disease. Front Physiol. 2023;14:1231448. doi:10.3389/fphys.2023.1231448
27. Rustiasari UJ, Roelofs JJ. The role of platelets in diabetic kidney disease. Int J mol Sci. 2022;23(15):8270. doi:10.3390/ijms23158270
28. Yu M, Xie R, Zhang Y, et al. Phosphatidylserine on microparticles and associated cells contributes to the hypercoagulable state in diabetic kidney disease. Nephrol Dial Transplant. 2018;33(12):2115–2127. doi:10.1093/ndt/gfy027
29. Choi YM, Kwon HS, Choi KM, Lee WY, Hong EG. Short-term effects of beraprost sodium on the markers for cardiovascular risk prediction in type 2 diabetic patients with microalbuminuria. Endocrinol Metab. 2019;34(4):398–405. doi:10.3803/EnM.2019.34.4.398
30. Xu X, Pan X, Li S. Prospective analysis of the efficacy of beraprost sodium combined with alprostadil on diabetic nephropathy and influence on rennin-angiotensin system and TNF-α. Exp Ther Med. 2020;19(1):639–645. doi:10.3892/etm.2019.8265
31. Li L, Shen Q, Rao S. Association of neutrophil-to-lymphocyte ratio and platelet-to-lymphocyte ratio with diabetic kidney disease in Chinese patients with type 2 diabetes: a cross-sectional study. Ther Clin Risk Manag. 2022;18:1157–1166. doi:10.2147/tcrm.S393135
32. Duan S, Sun L, Zhang C, et al. Association of platelet-to-lymphocyte ratio with kidney clinicopathologic features and renal outcomes in patients with diabetic kidney disease. Int Immunopharmacol. 2021;93:107413. doi:10.1016/j.intimp.2021.107413
33. Li X, Wang L, Liu M, Zhou H, Xu H. Association between neutrophil-to-lymphocyte ratio and diabetic kidney disease in type 2 diabetes mellitus patients: a cross-sectional study. Front Endocrinol. 2023;14:1285509. doi:10.3389/fendo.2023.1285509
34. Qin Z, Li H, Wang L, et al. Systemic immune-inflammation index is associated with increased urinary albumin excretion: a population-based study. Front Immunol. 2022;13:863640. doi:10.3389/fimmu.2022.863640
35. Huang P, Mai Y, Zhao J, Yi Y, Wen Y. Association of systemic immune-inflammation index and systemic inflammation response index with chronic kidney disease: observational study of 40,937 adults. Inflamm Res. 2024;73(4):655–667. doi:10.1007/s00011-024-01861-0
36. Guo W, Song Y, Sun Y, et al. Systemic immune-inflammation index is associated with diabetic kidney disease in Type 2 diabetes mellitus patients: evidence from NHANES 2011-2018. Front Endocrinol. 2022;13:1071465. doi:10.3389/fendo.2022.1071465
37. Song Z, Chen Z, Sun X, Zou L. Competing risk models versus traditional Cox models for prognostic factors’ prediction and care recommendation in patients with advanced laryngeal squamous carcinoma: a population-based study. Eur Arch Otorhinolaryngol. 2023;280(8):3745–3756. doi:10.1007/s00405-023-07983-1
38. Hundemer GL, Tangri N, Sood MM, et al. Performance of the kidney failure risk equation by disease etiology in advanced CKD. Clin J Am Soc Nephrol. 2020;15(10):1424–1432. doi:10.2215/cjn.03940320
 © 2025 The Author(s). This work is published and licensed by Dove Medical Press Limited. The
full terms of this license are available at https://www.dovepress.com/terms
and incorporate the Creative Commons Attribution
- Non Commercial (unported, 3.0) License.
By accessing the work you hereby accept the Terms. Non-commercial uses of the work are permitted
without any further permission from Dove Medical Press Limited, provided the work is properly
attributed. For permission for commercial use of this work, please see paragraphs 4.2 and 5 of our Terms.
© 2025 The Author(s). This work is published and licensed by Dove Medical Press Limited. The
full terms of this license are available at https://www.dovepress.com/terms
and incorporate the Creative Commons Attribution
- Non Commercial (unported, 3.0) License.
By accessing the work you hereby accept the Terms. Non-commercial uses of the work are permitted
without any further permission from Dove Medical Press Limited, provided the work is properly
attributed. For permission for commercial use of this work, please see paragraphs 4.2 and 5 of our Terms.