Back to Journals » International Journal of General Medicine » Volume 15
Development of Local Birth Weight Reference Based on Gestational Age and Sex in South Kalimantan Province, Indonesia
Authors Anggraini D , Abdollahian M , Lestia AS , Armanza F, Rahkmawati Y, Hayah N, Mehta WA
Received 16 November 2021
Accepted for publication 2 March 2022
Published 16 April 2022 Volume 2022:15 Pages 4101—4121
DOI https://doi.org/10.2147/IJGM.S349709
Checked for plagiarism Yes
Review by Single anonymous peer review
Peer reviewer comments 2
Editor who approved publication: Dr Scott Fraser
Dewi Anggraini,1 Mali Abdollahian,2 Aprida Siska Lestia,1 Ferry Armanza,3 Yeni Rahkmawati,4 Nurul Hayah,5 Winda Adya Mehta5
1Study Program of Statistics, Faculty of Mathematics and Natural Sciences, Lambung Mangkurat University, Banjarbaru, 70714, South Kalimantan, Indonesia; 2School of Science, College of Science, Technology, Engineering, and Health, RMIT University, Melbourne, 3001, VIC, Australia; 3Study Program of Medical Education, Faculty of Medicine, Lambung Mangkurat University, Banjarmasin, 70232, South Kalimantan, Indonesia; 4Graduate Student of Statistics Department, IPB University, Bogor, 16680, West Java, Indonesia; 5Graduate Student of Study Program of Statistics, Faculty of Mathematics and Natural Sciences, Lambung Mangkurat University, Banjarbaru, 70714, South Kalimantan, Indonesia
Correspondence: Dewi Anggraini, Study Program of Statistics, Faculty of Mathematics and Natural Sciences, Lambung Mangkurat University, Ahmad Yani Street, Km 36, Banjarbaru, 70714, South Kalimantan, Indonesia, Tel/Fax +62 511 4773112, Email [email protected]
Purpose: Percentile reference of babies’ birth weight is an effective reference tool for early detection of the risk of neonatal morbidity and impaired growth. However, the lack of minimum local and national perinatal data makes its development in Indonesia difficult. This study aims to develop a local birth weight percentile reference for babies based on gestational age and sex by utilizing local data in South Kalimantan Province which is one of the provinces with the highest neonatal mortality rate in Indonesia.
Patients and Methods: All single live newborns who were born and were recorded in 20 primary healthcare centers, between 1 June 2016 and 30 June 2017, were included in the study. Birth weight percentiles of infants were calculated using the weighted average method. The study focused on neonates born with gestational age from 36 to 40 weeks.
Results: A local birth weight reference for babies has been developed. According to our local reference, the proportion of male newborns with a birth weight < 10th percentile was higher (7.0%) than the existing Indonesian (4.2– 4.3%) and international references (3.3– 6.2%). Similarly, the proportion of female newborns with a birth weight < 10th percentile was higher (6.5%) than the existing Indonesian references (3.6– 4.4%) and the global reference (5.8%) but lower than the Intergrowth 21st project (7.2%). The differences suggest that relative birth weight will likely be underestimated (overestimated) if other percentile references are used for the local population.
Conclusion: A local birth weight percentile reference for babies in South Kalimantan Province based on gestational age (36– 40 weeks) and sex has been developed. Access to the local data, as baseline information, will allow the compilation and comparison of pregnancy-related outcomes across provinces in Indonesia. Consequently, reliable national perinatal data can be strengthened to establish the national references for newborns’ anthropometric measurements.
Keywords: percentile reference, birth weight, age, gender, Indonesia
Introduction
The complexity of prematurity is the most common cause of death among infants worldwide. This includes two-thirds premature birth (birth before 37 completed weeks of gestation) and one-third term birth but small-for-gestational-age (SGA) (< 10% of birth weight). However, birth weight is a primary measurement and significant indicator to ensure the optimal growth, survival, and future well-being of newborns. It is well documented that low birth weight (LBW) is associated with higher neonatal mortality and morbidity.4 Birth weight percentiles that incorporate weight and gestational age (GA) of neonates at birth can be used as a reference for detecting the risk of having neonatal morbidity and growth impairment.5 International standards for newborn’s anthropometric measurements, such as birth weight, length, and head circumference, by GA (between 33 and 42 weeks) and sex have been developed.3 However, heterogeneity of maternity population in different countries may inevitably impact the optimality of fetal and neonatal growth and size.6 Currently, epidemiological data have highlighted four priorities to promote the Every Newborn Action Plan for delivering a healthy new generation, specifically to where (which countries) when (around birth), what (the leading causes of neonatal mortality), and who (small babies).7 Therefore, nation-specific references for newborns’ anthropometric measurements are required.
In Indonesia, a national reference is currently not available due to the lack of reliable national perinatal data. However, some efforts have been made to provide gestational age-specific reference percentiles for Indonesian newborns’ anthropometric measurements. The first reference was developed in 1994 using a multicenter survey across 14 Indonesian teaching hospitals between 1990–1991 (n = 5844 live singleton newborns).8 In 2016, the former references were then updated using the local maternal-perinatal database between 1998 and 2007 across 1 provincial (referral) hospital, 5 district hospitals, and 5 health centers in Yogyakarta (n = 54,599 live singleton births). However, none of these existing references compare the proportion of live births that are classified as SGA.
This study aims to develop local birth weight reference percentiles by GA and sex for all live singleton newborns in the province of South Kalimantan, Indonesia which is one of the five provinces recording the highest neonatal mortality rate.9–11 The references are then used to compare the proportion of live births that are classified as SGA according to our local birth weight reference versus that of the existing Indonesian and international references to better understand the characteristics of maternity population across provinces and countries, respectively.
Materials and Methods
Study Population
This research was conducted in the South Kalimantan province between April 2016 and October 2017. The province consists of 2 municipalities (urban areas) and 11 districts (rural areas). In the capital of the province, public and private hospitals as tertiary health facilities are available. Each administrative area is served by hospitals as secondary health facilities that provide referral services in that area and health centers as primary health facilities. These primary healthcare (PHC) centers are the most locally recommended and cost-effective first level of healthcare systems in Indonesia.9,12,13
Our study population consisted of all newborns delivered in 20 primary healthcare (PHC) centers comprising: 14 public health centers (PKMs) and 6 private midwifery clinics (BPMs) which are proportionally distributed across the administrative areas of the province. These PHC centers were purposively selected by the provincial health department and midwifery association to be included in the study. The selection criteria were also based on the “large size of population” (5–18%) who live in the area and might seek and receive health care from the centers.
Research Design and Data Collection
A descriptive design using the quantitative method was used to conduct the research. Birth data collection was assisted by 20 trained and experienced midwives who were recommended by the provincial health department and midwifery association to participate in this study. The midwives represented the participating PHC centers. They had working experience in rendering antenatal and midwifery services with an average of 20 years: ranged from six to ten years (n =4; 20%), eleven to twenty years (n = 9; 45%), twenty-one to thirty years (n = 5; 25%), and thirty-one or longer (n = 2; 10%).
The data collection was carried out in two phases. A retrospective cohort study was used in Phase 1 while a prospective cohort study was used in Phase 2. During the retrospective phase, the participating midwives were asked to provide the manual local pregnancy registers (1 April 2007–31 May 2016) available at PHC centers to where they were assigned. These records were then entered into a spreadsheet for quantitative analysis by the local data collection team. To improve the quality of data processing tasks, the team in charge of data entry was trained to understand the content of the manual pregnancy registers. This was followed by face-to-face and online communication between the principal investigator, the data collection team, and the midwives to minimize data entry errors. Therefore, access to manually recorded antenatal care (ANC) information on 3181 women who enrolled, received care, and gave birth in the centers was granted.
A prospective cohort study was employed during the second phase of the study. The representative midwives agreed to participate in our prospective cohort study (1 June 2016–30 June 2017). By following the national standard operational procedures of ANC, the midwives were expected to longitudinally monitor and measure the recommended ANC examinations from the first trimester of pregnancy to delivery and timely record the results into our developed electronic pregnancy registers. Online communication between the principal investigator and the midwives was conducted to improve the quality of data processing tasks and minimize data entry errors. Therefore, access to electronically recorded ANC information on 435 women who enrolled, received care, and gave birth in the centers was granted.
Inclusion and Exclusion Criteria
All pregnant women who delivered live singleton newborns between 2007 and 2017 at the participating PHC centers and had complete key characteristic information of their newborns, such as gestational age, birth weight and sex were included in the study. Meanwhile, those with multiple pregnancies/births, abortion, stillbirths, premature births, and low birth weight were excluded from the study.
Statistical Analyses
Quantitative data analysis was used in this study. Birth weight was recorded in grams. Since ultrasound facilities are currently not available in the PHC centers, gestational age (GA) was calculated based on the first day of the last menstrual period (LMP) and recorded in completed weeks. Implausible birth weights were excluded using a method based on Tukey’s box-and-whisker plots.5 Birth weights below the first quartile minus one and a half times the interquartile range, or above the third quartile plus one and a half times the interquartile range were considered mild outliers. Meanwhile, birth weights below the first quartile minus three times the interquartile range, or above the third quartile plus three times the interquartile range, were considered extreme outliers. Both mild and extreme outliers were excluded from analyses. The relative percentile differences between our local (current) birth weight percentiles with the previously published percentiles were calculated using the following formula.14
Exact percentiles of birth weight for each gestational age between 22 and 44 weeks were calculated using the weighted average method. The means and standard deviations were also calculated. Weighted average accounts for uneven data, it is particularly useful in data dealing with demographics and population size. Percentiles were tabulated and plotted for each gestational age. Results for the 5th and 95th percentiles (and more extreme) are presented only for gestational ages with a minimum of 100 births5 or 200 births.15
Results
Descriptive statistics on the baseline information of the study population between 2007 and 2017 (n = 3616) are presented in Table 1. Most mothers (47%) aged 23–32 years at the time of delivery, with few (22.8%) aged <22 years, 16.4% aged 33–42 years, 0.3% aged ≥42 years, and 13.5% with unrecorded age. Of these, 41.7% of mothers were well-nourished by considering the measurements of middle-upper arm circumference (≥23.5 cm) (41.7%) and body mass index (18.5–24.9 kg/m2) (40%).
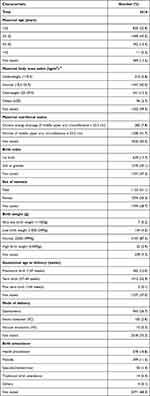 |
Table 1 Basic Characteristic of Mothers and All Live Singleton Newborns in South Kalimantan, Indonesia (2007–2017) |
This study included 1123 (31.1%) male and 1094 (30.3%) female births and 1399 (38.7%) with unrecorded sex. Of these newborns, 362 (10%) were born preterm while 144 (4%) were LBW and 7 (0.2%) very low birth weight (<1500g). Most of the infants were delivered spontaneously (26.7%) with the assistance of health practitioners, midwives, and obstetricians (31.2%) and traditional birth attendance (0.4%).
We excluded from analysis 2413 births (66.73%) for which one or more of the key variables, such as sex, birth weight, and gestational age, were missing; among these were 5 (0.14%) with gestational age more than 44 weeks (Figure 1).
 |
Figure 1 Flowchart of records selection process. |
Birth Weight Percentiles by Gestational Age
Of the 1203 live singleton births with GA between 22 and 44 weeks and available data on birth weight, 15 (1.25%) were removed as mild outliers, with 13 (1.08%) being below the lower limit and 2 (0.17%) above the upper limit of the inner fence and none being extreme outliers. Percentiles were calculated for a total of 1188 births (Figure 1) and the basic characteristics of the study population after exclusion are described in Table 2.
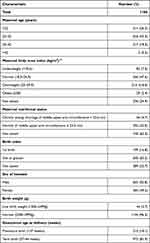 |
Table 2 Basic Characteristic of Mothers and All Live Singleton Newborns in South Kalimantan, Indonesia (2007–2017) After Exclusion. This is the Data Set Used for the Analysis in This Paper |
Figure 2 shows the distribution of local birth weight data and its exact percentiles, using the weighted average method, by gestational age for all live singleton newborns. Exact 5th, 10th, 25th, 50th, 75th, 90th, and 95th birth weight percentiles between 36 and 40 weeks of GA are listed in Table 3.
 |
Table 3 Local (Current) Birth Weight Percentiles by GA for All Live Singleton Newborns, South Kalimantan, Indonesia, 2007–2017 |
Figure 3 shows the local mean of birth weight and GA at delivery recorded across urban and rural PHC centers between 2010 and 2017. The exact local mean of birth weight and GA and their corresponding ranges are presented in Table 4.
 |
Table 4 Mean and Range of Local (Current) Birth Weight and GA for All Live Singleton Newborns (n=1123), South Kalimantan, 2010–2017 |
 |
Figure 3 Mean of local (current) birth weight and GA by year for all live singleton newborns, South Kalimantan, Indonesia, 2010–2017. |
Overall, the mean birth weight was 3080 g. The trend fluctuated over the period with a significant decrease in 2012 (2932 g) (Figure 3 and Table 3). Meanwhile, the mean GA at delivery was 39 weeks. The trend remained stable over the period, except between 2013 and 2015 (38 and 37 weeks).
Birth Weight Percentiles by Sex and Gestational Age (GA)
Male Newborns
Of the 606 live singleton births with GA between 24 and 44 weeks and available data on birth weight, 5 (0.83%) were removed as mild outliers, with that being below the lower limit and none above the upper limit of the inner fence as well as being extreme outliers. Percentiles were calculated for a total of 601 births (Figure 1).
Figure 4 shows the distribution of local (current) birth weight data and its exact percentiles, using the weighted average method, by gestational age for male singleton live births. Exact 5th, 10th, 25th, 50th, 75th, 90th, and 95th local (current) birth weight percentiles between 36 and 40 weeks of GA are listed in Table 5.
 |
Table 5 Local (Current) Birth Weight Percentiles by GA for Male Live Singleton Newborns, South Kalimantan, Indonesia, 2007–2017 |
Female Newborns
Of the 597 live singleton births with GA between 22 and 44 weeks and available data on birth weight, 11 (1.84%) were removed as mild outliers, with 10 (1.68%) being below the lower limit, 1 (0.17%) above the upper limit of the inner fence and none being extreme outliers. Percentiles were calculated for a total of 586 births (Figure 1).
Figure 5 shows the distribution of local (current) birth weight data and its exact percentiles, using the weighted average method, by gestational age for female singleton live births. Exact 5th, 10th, 25th, 50th, 75th, 90th, and 95th local (current) birth weight percentiles between 36 and 40 weeks of GA are listed in Table 6.
 |
Table 6 Local (Current) Birth Weight Percentiles by GA for Female Live Singleton Newborns, South Kalimantan, Indonesia, 2007–2017 |
Figure 6 shows the local (current) mean of birth weight and GA at delivery for male and female newborns recorded across urban and rural PHC centers between 2010 and 2017. The exact local (current) mean birth weight and GA and their corresponding ranges for both male and female newborns are presented in Table 7.
 |
Table 7 Local (Current) Mean and Range Birth Weight and GA for Live Singleton Newborns by Sex, South Kalimantan, 2010–2017 |
 |
Figure 6 Local (current) mean birth weight and GA by year and sex live singleton newborns, South Kalimantan, Indonesia, 2010–2017. |
Overall, the local (current) mean birth weight for males and females was 3110 g and 3055 g, respectively. The trend slightly increased between 2010 and 2017 for both sexes (Figure 6). The mean birth weights were higher for male newborns, except in 2011. This was followed by higher median birth weights for males than females between 36 and 40 weeks of GA (Tables 6 and 7). Meanwhile, the mean GA for female newborns was more stable than males over the period with a slight fluctuation between 2013 and 2015 (Figure 6 and Table 7).
Birth Reference Curves Comparison
Using the values from the local (current) study cohorts as references (Tables 3, 5, and 6), the mean and the 10th, 50th, and 90th percentiles of birth weight were compared to previously published Indonesian and international curves.1–3,5,8,16 It should be noted that most international curves used ultrasound to estimate GA, therefore cannot be utilized in Indonesia due to the lack of ultrasound facilities in most PHC centers. The general characteristics of these studies are presented in Table 8. The comparison of mean birth weight is illustrated in Figures 7–10.
 |
Table 8 List of the Selected Previously Published Studies Together with the Information on Their Settings That is Used to Compare with the Local (Current) Study |
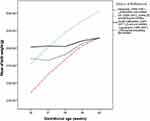 |
Figure 7 Mean birth weight by GA for all live singleton newborns. |
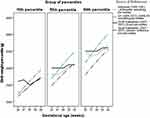 |
Figure 8 Birth weight percentiles by GA for all live singleton newborns. |
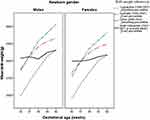 |
Figure 9 Mean birth weight by GA for male and female singleton newborns. |
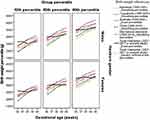 |
Figure 10 Birth weight percentiles by GA for males and females live singleton newborns. |
The mean birth weight for GA < 37 weeks was higher in our study (solid black line) than those in the previously published Indonesia’s (dotted blue and red lines) and UK’s studies (dotted green line). Meanwhile, GA between 37 and 40 weeks presented the highest mean birth weight in Britain’s population but the lowest in one of the Indonesian study populations (Figure 7).
The comparison between the local (current) birth weight percentiles and the previously published curves1,2,8 are illustrated in Figure 8. Overall, the non-Indonesian birth weight percentiles1 was higher than the existing Indonesian references, particularly after 38 weeks of GA. The values of 10th percentiles between 36 and 38 weeks of GA in the local (current) study were higher than those of Britain and Indonesian infants but lower than that of Britain infants after 38 gestation weeks.
Figure 7 shows that while the local (current) trend of birth weight percentiles is similar to the ones constructed in 1994 based on the Indonesian population,8 the local (current) birth weight percentiles have decreased (Figure 8). Also, the generic reference tool developed by Mikolajczyk et al in 20112 does not fit our local data, except in the 10th percentiles between 38 and 40 weeks of GA.
The mean birth weight for GA <37 weeks was higher in the local (current) study than those in the previously published Indonesia’s, Australia’s, and China’s studies. Meanwhile, GA between 37 and 40 weeks presented the highest mean birth weight in the Australian population followed by the Chinese population but the lowest in the Indonesian population (Figure 9).
The comparison between the local (current) birth weight percentiles by GA and sex with the previously published references2,3,5,8,14,16 were shown in Figure 10. In general, the birth weight percentiles both for male and female newborns based on non-Indonesian population3,5,14 were higher than those in the local (current) and previously published references2,8,16 based on the Indonesian population. There was consistent evidence that the local (current) characteristics of birth weight percentiles for males and females have close similarity with the ones constructed in 19948 and 201616 based on the Indonesian maternity population, particularly after 38 weeks of GA. Also, the generic reference tool developed by Mikolajczyk et al in 20112 does not fit our local (current) population for both sexes, except in the 10th percentiles between 38 and 40 weeks of GA.
Overall, the mean birth weight between 36 and 40 weeks of GA was higher in our local (current) study than those in the previously published Indonesia’s studies (Figure 11).
 |
Figure 11 Mean birth weight by GA for all Indonesian live singleton newborns. |
The relative differences for the 10th, 50th, and 90th percentiles between our local (current) reference and those from other references are listed in Tables 9 and 10. Overall, greater differences were found at almost all gestation weeks among the existing references, particularly at or before 37 gestation weeks.
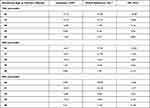 |
Table 9 Relative Differences in the 10th, 50th, and 90th Percentiles of Birth Weight by GA Between Previously Published References and the Local (Current) Reference (Table 3) |
 |
Table 10 Relative Differences in the 10th, 50th, and 90th Percentiles of Birth Weight by GA and Sex Between the Local (Current) Reference (Table 2) and Previously Published References |
The positive values in both (Tables 9 and 10) indicate that the local (current) percentiles were smaller than the existing ones, suggesting that relative birth weight will likely be overestimated if other percentile references are used for the local (current) population. On the other hand, negative numbers will likely result in underestimation if other references are used.
As per the definition of SGA, the comparison of the proportion of live births with a birth weight < 10th percentile between our local (current) reference and the existing Indonesian and international references is given in Table 11.
 |
Table 11 Proportion of Live Births with Birth Weight <10th Percentile for GA Using Local (Current) Reference and the Existing Indonesian and International References |
Regardless of the sexes, overall, the proportion of live births with a birth weight < 10th percentile according to our local (current) reference (5.9%) was higher than the existing Indonesian reference (4.7%) but lower than the existing global reference (6.7%). This trend was similar to newborns who were delivered at term pregnancy (between 37 and 40 weeks). Meanwhile, preterm birth (< 37 weeks) presented the highest proportion in our local (current) population.
For male newborns, the proportion of live births with a birth weight < 10th percentile according to our local (current) reference (7.0%) was higher than the existing Indonesian (4.2–4.3%) and international references (3.3–6.2%). This trend was similar to those delivered at preterm pregnancy. At term birth, however, our local (current) population presented a higher proportion of SGA babies (1.2%) than the existing Indonesian and international standard references (0%) but lower than the existing global reference (6.2%).
For female newborns, the proportion of live births with a birth weight < 10th percentile according to our local (current) reference (6.5%) was higher than the existing Indonesian references (3.6–4.4%) and the global reference (5.8%) but lower than the Intergrowth 21st project (7.2%). This trend was similar to those delivered at term pregnancy. Nevertheless, at preterm birth, our local (current) population presented a higher proportion of SGA newborns (0.7%) than the existing Indonesian and international references (0%).
Discussion
Main Findings of the Study
This study has locally presented the first gestational age-specific reference of birth weight between 36 and 40 weeks of GA for live singleton newborns in the South Kalimantan province which is one of the five provinces recording the highest neonatal mortality rate in Indonesia9–11 7. The birth weight reference was developed based on available complete local perinatal data between 2010 and 2017 across 20 primary healthcare centers in the province. The reference can be used as an effective tool to describe the characteristics of the local newborn population and compare them (in terms of GA) with the previously Indonesian published references (19948 and 201616). The provision of the local birth weight percentiles also enables the comparison of the proportion of live births that are classified as SGA according to our local reference versus that of the existing Indonesian and international references. Consequently, the characteristics of the newborn population or pregnancy-related outcomes, specifically across provinces in Indonesia, can be better reflected.
The local newborn population was overall delivered at term pregnancy (37–39 weeks of GA) with a normal range of mean birth weight (3080 g) as it is mostly expected. The trend of the mean GA at delivery for the total population, males, and females was fairly steady over time, with an equal maximum variation of 2 weeks. Meanwhile, the mean birth weight was similar to that of the Indonesian newborns recorded between 1990 and 1991 (3085 g)8 even though the study population was different. The previous study was based on a multicenter survey across 14 Indonesian teaching hospitals regarded as tertiary healthcare centers which tend to have a more at-risk maternity population than the present study which was based on retrospective and prospective cohort studies conducted across 20 primary healthcare centers. However, the present mean birth weight was higher than that of the newborn population in Yogyakarta between 1998 and 2007 (2964 g) which was based on local maternal and perinatal data recorded across primary, secondary, and tertiary healthcare facilities.16
It is noteworthy that the mean birth weight of newborns in the present study had experienced a slight increase between 2010 and 2017, with a maximum variation of 278 g. Though, the trend was relatively stable over time for both male and female newborns, with a higher maximum variation in the females (374 g) than the males (226 g). The present trend of mean birth weight based on newborn’s gender was similar to that of the Australian newborns5 but with a reverse trend in the maximum variation. Such comparison could not be made with that in the previous Indonesian studies,8,16 since there was no information available on such trends on the mean and variance of birth weight. In addition, the mean birth weight in the present study was 55 g higher in male newborns than the females, except in 2011. This result was in agreement with both the Indonesian8,16 and Australian5 studies.
When compared with the existing international birth weight references, the current Indonesian median birth weights for gestational age were smaller than those in the UK,1 Australia,5 and China14 and larger than those based on the Intergrowth 21st project,3 particularly after 38 weeks of GA. However, when compared with the existing Indonesian birth weight percentiles,8,16 the current 50th percentiles were relatively equal, specifically after 38 weeks of GA. This suggested that the current and previous birth weight references have reflected similar characteristics of Indonesian newborns.
Early detection of the risk of having neonatal morbidity and growth impairment, such as prematurity and SGA is crucial in providing appropriate interventions promptly. As demonstrated in this study, the proportion of live births, both males and females, with a birth weight < 10th percentile classified as SGA according to our locally derived birth weight reference for GA was higher than the existing Indonesian and international references,2,3,8,16 particularly at preterm births. This implies that the use of local reference had a higher threshold for SGA, particularly before 37 weeks of pregnancy. In our study, the 10th percentile of birth weight for 38th weeks is lower than that of 37th week based on recorded data. This could be due to fact that the available data for 37 weeks (94 births) was less than a minimum of 100 births5 or 200 births.15
Since Indonesia has diverse geographical areas across 34 provinces and adopted a decentralization policy in 2001,13 routine collection of local perinatal data is urgently required to promote the provision of a reliable national database in a timely manner. The utility of local health registers rather than periodic demographic or household surveys are recommended to obtain significant figures of maternal, fetal, and neonatal health in rural Indonesia or close to where people live.13,17 Access to the local collection of perinatal data, as baseline information, will allow the comparison of pregnancy-related outcomes across provinces. Such comparison enables monitoring and evaluation of the performance of health service providers and the impact of planning programs or interventions, allocating resources and policy progress to improve pregnancy outcomes.13
Strengths and Limitation
A major strength of the current study was the proportional selection of participating primary healthcare (PHC) centers which represented each area of 11 districts and 2 municipalities in the South Kalimantan province. Our selection of PHC centers rather than secondary or tertiary/referral health facilities, such as hospitals ensured the inclusion of pregnant women with lower maternity and delivery risks in the study. However, this leads to the weakness of our study which did not have enough individuals with low gestational age (< 36 weeks) and high gestational age (> 40 weeks). The calculation of GA which was only based on the first day of the last menstrual period (LMP) should also be acknowledged as the limitation of this study. Due to the lack of ultrasound facilities in most PHC centers, LMP is the only alternative way of estimating GA. The lack of complete recorded data particularly in rural settings led to a high percentage of data exclusion, however, the sample size was statistically acceptable to carry out the analysis presented in this paper.
Exact percentiles by excluding implausible birth weights were used in constructing our birth weight percentiles. This approach has been used in Australia which has a high quality of national birth weight data.5 Although our local data were not as high quality as the Australian data, as a preliminary study, the use of exact percentiles rather than smooth-estimated percentiles is more useful in describing the true characteristics of the study population.
Conclusion
Early detection of the risk of having neonatal morbidity and growth impairment, such as prematurity and SGA is crucial in providing appropriate interventions in a timely manner. The national reference is currently not available in Indonesia. Therefore, our locally derived gestational age-specific reference percentiles can be used as a reference to assist medical practitioners, particularly in rural areas to detect the risk of having neonatal morbidity and growth impairment at birth. This reference is appropriate for studies on populations with similar demographic characteristics, particularly in Indonesia. This reference chart is best for 36–40 weeks of gestation.
The utility of local reference based on local perinatal data is recommended since it provides significant figures of maternal, fetal, and neonatal health close to where people live. Access to the local collection of perinatal data, as baseline information, will allow the compilation and comparison of pregnancy-related outcomes across provinces in Indonesia. Consequently, reliable national perinatal data can be strengthened to establish the national references for newborns’ anthropometric measurements and to monitor and evaluate the performance of health development programs and policies to improve pregnancy outcomes.
Abbreviations
LBW, low birth weight; SGA, small for gestational age; GA, gestational age; PHC, primary healthcare; PKM, public health centers; BPMs, private midwifery clinics; ANC, antenatal care; LMP, last menstrual period.
Data Sharing Statement
Data underlying the findings of this study are included in the manuscript.
Ethics Approval and Informed Consent
This study has complied with the Declaration of Helsinki and obtained research permissions from the Indonesian national, provincial, and local governments and two ethics’ clearances from the Lambung Mangkurat University Medical Research Ethics Committee, Indonesia (reference: 018/KEPK-FK UNLAM/EC/III/2016) and the RMIT College Human Ethics Advisory Network (CHEAN), Australia (reference: ASEHAPP 19-16/RM No: 19974). All participants provided informed consent to take part in this study. Data about the private idea of the task and a consent form (written in both Bahasa Indonesia and English) for enrollment to the examination were given to the chosen midwives and pregnant women (prospective study), who all consented to take an interest.
Consent for Publication
The manuscript does not contain any individual person’s data; hence consent for publication is not applicable.
Acknowledgments
The authors are incredibly thankful to Dr. Bambang Abimanyu, Sp.OG., KFM for his contribution in providing information regarding fetomaternal medicine. We are immensely appreciative of the head of the provincial partner midwife Association (IBI) of South Kalimantan, Hj. Supri Nuryani, S.Si.T., M.Kes., and her members Hj. Tut Barkinah, S.Si.T., M.Pd., Hj. Nurtjahaya, S.ST., and Hj. Masjudah, S.ST., who supported and selected the representative midwives to participate in the training.
We are greatly appreciative of the midwives team* in their role in gathering the data from their assigned workplace.
*Midwives Team
Hj Ariati, S.ST (Banjarmasin), Sari Milayanti, AMd.Keb and Hj. Masjudah, S.ST (Banjarbaru), Rini, AMd.Keb (Banjar), Rahmi Widiati, AM.Keb (Barito Kuala), Suwarni, AM.Keb (Tapin), Hj Hiriana, AMd.Keb (Hulu Sungai Selatan), Yanti Pertiwi, AMd. Keb (Hulu Sungai Tengah), Hj. Siska Yunita, AM.Keb (Hulu Sungai Utara), Nurjanah, S.Si.T (Balangan), Suparti, S.Si.T (Tabalog), Rina, AM.Keb (Tanah Laut), Sri Wahyuningsih, AMd.Keb (Tanah Bumbu), Yani Kristanti, AMd. Keb (Kotabaru), Hj Raihatul Jannah, AMd. Keb (BPM Banjarmasin), Rinawati, AMd. Keb (BPM Banjarmasin), Eka Septina, AMd. Keb (BPM Banjarmasin), Noorjannah, S.ST (BPM Banjarmasin), and Fauziah Olfah, S.ST (BPM Kotabaru).
Author Contributions
All authors made a significant contribution to the work reported, whether that is in the conception, study design, execution, acquisition of data, analysis, and interpretation, or in all these areas. They also took part in drafting, revising or critically reviewing the article; gave final approval of the version to be published; have agreed on the journal to which the article has been submitted; and agree to be accountable for all aspects of the work.
Funding
This research has been funded by the 2020 PNBP of Lambung Mangkurat University with contract number 212.242/UN8.2/PL/2020 and RMIT University.
Disclosure
The authors report no conflicts of interest in this work.
References
1. Poon LCY, Tan MY, Yerlikaya G, Syngelaki A, Nicolaides KH. Birth weight in live births and stillbirths. Ultrasound Obstet Gynecol. 2016;48:602–606. doi:10.1002/uog.17287
2. Mikolajczyk RT, Zhang J, Betran AP, et al. A global reference for fetal-weight and birthweight percentiles. Lancet. 2011;377:1855–1861. doi:10.1016/S0140-6736(11)60364-4
3. Villar J, Ismail LC, Victora CG, et al. International standards for newborn weight, length, and head circumference by gestational age and sex: the Newborn Cross-Sectional Study of the INTERGROWTH-21st Project. Lancet. 2014;384:857–868. doi:10.1016/S0140-6736(14)60932-6
4. Lawn JE, Blencowe H, Oza S, et al. Every newborn: progress, priorities, and potential beyond survival. Lancet. 2014;384:189–205. doi:10.1016/S0140-6736(14)60496-7
5. Dobbins TA, Sullivan EA, Roberts CL, Simpson JM. Australian national birthweight percentiles by sex and gestational age, 1998–2007. Med J Aust. 2012;197:291. doi:10.5694/mja11.11331
6. Gardosi J. Fetal growth standards: individual and global perspectives. Lancet. 2011;377:1812–1814. doi:10.1016/S0140-6736(11)60507-2
7. Mason E, McDougall L, Lawn JE, et al. From evidence to action to deliver a healthy start for the next generation. Lancet. 2014;384:455–467. doi:10.1016/S0140-6736(14)60750-9
8. Alisyahbana A, Chaerulfatah A, Usman A, Sutresnawati S. Anthropometry of newborns infants born in 14 teaching centers in Indonesia. Paediatr Indones. 1994;34:123.
9. Achadi E, Jones G. Health Sector Review: Maternal, Neonatal, and Child Health. Jakarta: Republic of Indonesia: Ministry of National Development Planning/Bappenas; 2014.
10. UNICEF-Indonesia. Issues briefs: maternal and child health; 2012.
11. Ministry of Health. Indonesia health profile (Profil Kesehatan Indonesia); 2012.
12. Putera I, Pakasi TA, Karyadi E. Knowledge and perception of tuberculosis and the risk to become treatment default among newly diagnosed pulmonary tuberculosis patients treated in primary health care, East Nusa Tenggara: a retrospective study. BMC Res Notes. 2015;8:4–9. doi:10.1186/s13104-015-1209-6
13. Council N. Reducing Maternal and Neonatal Mortality in Indonesia: Saving Lives, Saving the Future. National Academies Press; 2013.
14. Dai L, Deng C, Li Y, et al. Birth weight reference percentiles for Chinese. PLoS One. 2014:9. doi:10.1371/journal.pone.0104779
15. Ohuma DA, Ohuma EO. Statistical considerations for the development of prescriptive fetal and newborn growth standards in the INTERGROWTH-21 st project. BJOG. 2013;120:71–76. doi:10.1111/1471-0528.12031
16. Haksari EL, Lafeber HN, Hakimi M, Pawirohartono EP, Nyström L. Reference curves of birth weight, length, and head circumference for gestational ages in Yogyakarta, Indonesia. BMC Pediatr. 2016;16:188. doi:10.1186/s12887-016-0728-1
17. Burke L, Suswardany DL, Michener K, Mazurki S, Adair T, Elmiyati C. Utility of local health registers in measuring perinatal mortality: a case study in rural Indonesia. BMC Pregnancy Childbirth. 2011;11:20. doi:10.1186/1471-2393-11-20
18. Enomoto K, Aoki S, Toma R, Fujiwara K, Sakamaki K. Pregnancy outcomes based on pre-pregnancy body mass index in Japanese women. PLoS One. 2016;11:e0157081. doi:10.1371/journal.pone.0157081
19. Hadlock FP, Harrist RB, Martinez-Poyer J. In utero analysis of fetal growth: a sonographic weight standard. Radiology. 1991;181:129–133. doi:10.1148/radiology.181.1.1887021
20. Gardosi J, Mongelli M, Wilcox M, Chang A. An adjustable fetal weight standard. Ultrasound Obstet Gynecol. 1995;6:168–174. doi:10.1046/j.1469-0705.1995.06030168.x
21. Villar J, Giuliani F, Fenton TR, Ohuma EO, Ismail LC, Kennedy SH. INTERGROWTH-21st very preterm size at birth reference charts. Lancet. 2016;387:844–845. doi:10.1016/S0140-6736(16)00384-6
 © 2022 The Author(s). This work is published and licensed by Dove Medical Press Limited. The full terms of this license are available at https://www.dovepress.com/terms.php and incorporate the Creative Commons Attribution - Non Commercial (unported, v3.0) License.
By accessing the work you hereby accept the Terms. Non-commercial uses of the work are permitted without any further permission from Dove Medical Press Limited, provided the work is properly attributed. For permission for commercial use of this work, please see paragraphs 4.2 and 5 of our Terms.


