Back to Journals » Psychology Research and Behavior Management » Volume 12
Development of an instrument based on the theory of planned behavior variables to measure factors influencing Iranian adults’ intention to quit waterpipe tobacco smoking
Authors Mirzaei N, Dehdari T ![]() , Taghdisi MH
, Taghdisi MH ![]() , Zare N
, Zare N ![]()
Received 10 June 2019
Accepted for publication 3 September 2019
Published 24 September 2019 Volume 2019:12 Pages 901—912
DOI https://doi.org/10.2147/PRBM.S196417
Checked for plagiarism Yes
Review by Single anonymous peer review
Peer reviewer comments 2
Editor who approved publication: Dr Igor Elman
Nasim Mirzaei,1 Tahereh Dehdari,1 Mohammad Hossein Taghdisi,1 Najaf Zare2
1Department of Health Education and Health Promotion, School of Public Health, Iran University of Medical Sciences, Tehran, Iran; 2Department of Biostatistics, School of Medicine, Infertility Research Center, Shiraz University of Medical Sciences, Shiraz, Iran
Correspondence: Tahereh Dehdari
Iran University of Medical Sciences, Shahid Hemmat Highway, Tehran 1449614535, Iran
Tel +98 218 860 4625
Email [email protected]
Background: Theory of planned behavior (TPB) is one of the most widely used theoretical frameworks to explain addictive behaviors, such as tobacco smoking. The aim of this study is to develop and validate an instrument based on TPB variables to measure factors influencing Iranian rural adults’ intention to quit waterpipe tobacco smoking.
Methods: This study was performed on a sample of rural adult waterpipe consumers living in two villages in Shiraz, Southern Iran. In the beginning, the initial items of instrument were extracted from the literature review and interviews with 20 waterpipe consumers. After that, face validity and qualitative content validity of the items were appraised. To measure quantitative content validity index (CVI) and the content validity ratio (CVR), a panel of experts reviewed the items. In addition, the exploratory factor analysis (EFA) and confirmatory factor analysis (CFA) were applied to characterize the construct validity of the instrument. Finally, Cronbach’s alpha coefficient and intraclass correlation coefficient (ICC) were computed.
Results: CVI and CVR of items were within the ranges of 0.89–0.95 and 0.85–0.96, respectively. EFA indicated the Kaiser-Meyer-Olkin (=0.71) and Bartlett’s test of sphericity was significant (=912.36, df=105, p<0.0001). Principal component analysis revealed that 15 items could be grouped into four subscales that accounted for 64.97% of the variance. Based on CFA, two items were deleted. CFA results showed that the remained data were fit to the model. The Cronbach’s alpha and ICC of subscales were, respectively, in the ranges of 0.72–0.87 and 0.64–0.82. Finally, a 13-item instrument with four subscales was confirmed.
Conclusions: The findings reveal that the developed TPB instrument is a reliable and valid scale to identify the determinants of the intention to quit waterpipe smoking among Iranian rural adults.
Keywords: waterpipe tobacco smoking, theory-based, Iran, confirmatory factor analysis, exploratory factor analysis
Introduction
Tobacco use is the second major leading cause of death and is currently responsible for the deaths of one in 10 adults in the world.1 Generally, about 5 million deaths occur due to tobacco consumption every year.1,2 The waterpipe is an old way of tobacco use3 that is known with various names such as Shisha,3–5 Boory,4,5 Hookah,4,5 Arghileh,3–5 Goza,3–5 hubble-bubble,3–5 and Narghile.3–5 For the first time, waterpipe smoking was started in India and Pakistan in the seventeenth century and continued for centuries in the Middle East and North Africa. However, in the past two decades, it has spread to other parts of the world6 such as Europe and North America.3,6 It has been reported that 100 million persons around the world smoke waterpipe daily.6,7
Waterpipe contains over 4800 different chemicals out of which 69 are carcinogens, and others promote tumor.1 Also, it is one of the risk factors of many health problems associated with tobacco consumption, including cardiovascular diseases,1,4,8 pulmonary diseases,4,8 lung cancer,1,4,8 urinary bladder cancer,1,4 oral cancer,4 low birth weight,1,4,8 and fetal tobacco syndrome.4
Nowadays, the waterpipe is becoming a strong favorite method of tobacco use around the world. The main reasons for its increasing popularity include widespread social acceptance, relaxation, and pleasure, confidence in the ability to quit, and the belief that it is less harmful than cigarette smoking.9 However, more information regarding theoretical variables affecting waterpipe smoking is needed to make appropriate and effective efforts for the prevention or elimination of waterpipe tobacco smoking.10 In order to improve the likelihood of effective interventions in the field of tobacco smoking, it is necessary to apply social psychological theories. Such theories can enable a person to better realize the processes involved in smoking behaviors.11 Also, they explain why a behavior changes and why individuals perform or do not perform the recommended behavior.12 In the present study, we used the theory of planned behavior’s (TPB) variables as a theoretical framework for predicting the intention to quit waterpipe tobacco smoking among a sample of Iranian rural adults. This theory has been used successfully in predicting and understanding some health behaviors, such as tobacco smoking.13 According to the TPB, the behavior arises from the intention to perform the behavior and the perceived behavioral control. The intention can be predicted by the attitude toward the behavior, the subjective norms for performing the behavior, and the perceived behavioral control for adopting the behavior. The relationship between behavioral intention and actual behavior is not complete but the intention can be as a representative for the real behavior.14
Given the high consumption of waterpipe in Iran and the lack of valid theory-based instrument to identify factors affecting its cessation, this study was designed to develop and validate an instrument based on TPB variables in terms of the intention to quit waterpipe tobacco smoking among a sample of Iranian rural adults.
Materials and methods
Study design
The present cross-sectional validation research was performed from November 2016 to April 2017 in the two villages of Shiraz (Southern Iran), Iran. This study was approved by the ethics committee of Iran University of Medical Sciences (with the code of IR.IUMS.REC.94-05-27-27359). All participants submitted informed written consent. In addition, the objectives of the study and preservation of information were explained to them.
Developing TPB instrument in terms of waterpipe tobacco smoking cessation
According to the instruction of developing the TPB questionnaire,15 variables may be measured directly (eg, by asking respondents about their overall attitude), or indirectly (eg, by asking respondents about specific behavioral beliefs and outcome evaluations). In the present study, we used a direct measurement method, which was developed in the following steps (Figure 1):
 |
Figure 1 A flowchart depicting the process used to the development of an instrument based on the theory of planned behavior variables to measure factors influencing Iranian adults’ intention to quit waterpipe tobacco smoking. |
Item generation
Two phases were followed for item generation: 1) a review of the literature relating to the TPB was carried out16–19 and 2) two focus group discussions were performed with 20 waterpipe tobacco smokers. In this step, an item pool was extracted from focus group discussion findings and the literature. Finally, a 15-item instrument with 4 factors was organized into a logical framework including behavioral intention (Int1–Int3), attitude (Att1–Att4), subjective norms (Sn1–Sn4), and perceived behavioral control (Pbc1-Pbc4). Items of behavioral intention, subjective norms, and perceived behavioral control were measured on a Likert scale ranging from 1 to 5 (1=completely disagree to 5=completely agree). Bipolar adjectives (ie, pairs of opposites) that were evaluative (eg, waterpipe smoking is a behavior: good 1 2 3 4 5 6 7 bad) were used for measuring the attitude toward waterpipe tobacco smoking.
Face validity
A group of rural adult waterpipe smokers (n=20) was asked to reflect on the clarity, simplicity, and readability of the items of the instrument. Based on the participants’ opinions, the ambiguous items were revised and some minor wording errors were corrected. In addition, quantitative face validity was applied to calculate the impact score of items (frequency×importance) to explain the proportion of participants who distinguished that the item was important or quite important. Items were regarded as appropriate if they had an impact score equal to or >1.5.20
Content validity
Content validity was done in two phases (qualitative and quantitative). In the qualitative phase, a 15-member panel including health education and addiction specialists evaluated the questionnaire in terms of the wording, grammar, and item allocation and scaling. The quantitative phase was conducted to calculate content validity ratio (CVI) and content validity index (CVR). In the quantitative phase, CVR and CVI of the instrument items were measured based on their comments. CVR was conducted to measure the essentiality of each item using the 3-point rating scale (1= essential, 2=useful but not essential, and 3=not essential).21 CVR of each item was obtained according to the following formula: CVR=[Ne−(N/2)]÷(N/2), in which Ne is the number of specialists indicating “essential” for each specific item, and N is the number of all specialists. The value of CVR was characterized using the Lawshe table. Based on this table, an acceptable CVR value for 15 panelists is 0.49 or above.22 CVI reviews the relevancy, simplicity, and clarity of each item. In order to calculate the CVI, a Likert-type ordinal scale with four possible responses was used. The answers comprise a rating from 1=not relevant, not simple, and not clear to 4=very relevant, very simple, and very clear. CVI was evaluated from the proportion of items on a scale that attained a rating of 3 or 4 by the specialists. Polite and Beck recommended 0.79 as the acceptable lower limit for CVI value.23
Construct validity
Construct validity was done by exploratory factor analysis (EFA), confirmatory factor analysis (CFA), convergent, and discriminate validity. In this stage, the sample size was determined to calculate EFA and CFA. Given that there are no fixed methods for determining the required sample size in CFA and EFA,24–26 we used from the ratio of sample size to the number of variables. For example, Cattell and Gorsuch consider the ratio of three to six and at least five participants per variable, correspondingly. Moreover, this ratio was reported by both Everitt and Nunnally ten to one.25 Therefore, we used a ratio of ten to one and the sample size was 150. For CFA, we applied the rule of thumb ratio of participants to free parameters that 10:1 has been used as most usual ratio.27 According to this formula, the sample size was 150 (15×10=150).
In fact, regarding the difference in the goals of the exploratory approaches with confirmation approaches, two separate groups of samples were taken from the target group because EFA is mostly applied in the early phases of instrument development and construct validation. However, CFA is used in the later phases when the basic structure has been affirmed on previous empirical and theoretical backgrounds.28 As a result, two separate samples, each with 150 members, were considered for the calculation of EFA and CFA. For this purpose, we selected randomly two villages in Shiraz, Iran. To perform EFA, one of the two villages was selected and 150 waterpipe users were randomly selected and asked to complete the questionnaires. After obtaining the results of EFA and provision of an initial instrument, we performed CFA. For this purpose, 150 waterpipe users from the second village were randomly selected and completed questionnaires. Selection criteria of target groups were as follows: 1) not having the illnesses related to tobacco smoking such as lung cancer and coronary heart disease; 2) being 20–65 years of age; 3) being in the preparation of transt heoretical model stages of change (ie, having a plan on quitting waterpipe tobacco smoking in the next 30 days); 4) current hookah tobacco smoking at least once a week; 5) not being involved in any other quitting attempt; and 6) being Iranian citizenship and the ability to read and write in Persian.
EFA was used to determine the dimensions of the scale using the principal component analysis (PCA) with varimax rotation on the 15-item scale. Varimax rotation was selected because it enlarges the sum of the variance of the squared loadings; here “loadings” are correlations between variables and factors. This generally causes high factor loading for a smaller number of variables and low factor loadings for the other variables. The rest of the factors have eigenvalues of more than one. Simply put, the result showed that a small number of main variables be considered valuable, which makes the interpretations of the results more comfortable.29
The Bartlett’s Test of Sphericity and Kaiser-Meyer-Olkin (KMO) were applied to determine sampling adequacy for factor analysis.30 Criteria employed to improve the factors interpretability included: 1) eigenvalues >1 or Kaiser Criterion;30 2) communalities >0.2;31 and (3) factor loadings >0.4.30 In addition, there are several criteria for determining the number of structures. One of the most popular used criteria for determining the number structures is the Kaiser Criterion or eigenvalues >1, which retains factors with eigenvalues >1.30
In CFA, several indicators are commonly used to assess the suitability of a model.32 The following fit indices were selected to appraise the model fitness to the data: the relative Chi-square (χ2/df), the goodness of fit index (GFI), adjusted goodness of fit index (AGFI), comparative fit index (CFI), incremental fit index (IFI), normed fit index (NFI), non-normed fit index (NNFI), standardized root mean square residual (SRMR), and the root mean square error of approximation (RMSEA). The values of various indicators are as follows: acceptable model fit is shown by relative Chi-square value <5.33 Values of GFI and AGFI vary between 0 and 1, with values >0.9 showing the goodness of fit model. Also, the CFI, IFI, NFI, and NNFI indices are between 0 and 1, with values close to 1 representing that the model is more suitable and values >0.9 showing the model’s good fit. The acceptable value for SRMR is below 0.10 where values <0.8 indicate an adequate fit and values <0.5 indicate good fit. RMSEA values <0.05 show a good fit, values about 0.08 show a moderate fit, and values >0.1 show the model’s poor fit.32–34
Convergent validity
Convergent validity is the level of confidence in a construct that is measured by its indicators.35 To accept convergent validity, the factor loading, composite reliability, and the average variance extracted (AVE) must be between 0 and 1. AVE must be >0.50 to be sufficient for convergent validity.36
Discriminant validity test
Discriminant validity is an amount of difference between overlapping structures.35 This criterion is measured using Fornell-Lacker criterion. This criterion compares the square root of the AVE with the correlation of latent constructs. In general, the square root of each construct AVE should be of greater value than the existing correlations with other latent structures.36
Reliability
The internal consistency of instrument subscales was measured using their Cronbach’s alpha coefficient (n=30), where the least Cronbach’s alpha ≥0.65 was considered as acceptable.37
Sample size requirement for Cronbach’s alpha was calculated by the following defaults: minimum acceptable Cronbach’s alpha (H0) =0.65; expected Cronbach’s alpha (H1) =0.87; significance level (α) =0.05; Power (1–β) =80%; and expected dropout rate =10%.37,38
In order to measure the stability of the subscales (intraclass correlation coefficient (ICC)), a sub-sample of waterpipe tobacco smokers (n=25) completed the questionnaire twice with a 2-week interval. The minimum ICC ≥0.6 was considered acceptable.37 Sample size requirement for ICC was estimated by the following defaults: minimum acceptable reliability (ICC) (ρ0) =0.6; expected reliability (ICC) (ρ1) =0.86; significance level (α) =0.05; power (1–β) =80%; number of raters/repetitions per subject (k) =2; and expected dropout rate =10%.37,39 It is noted that the expected Cronbach’s alpha (HI) and ICC (P1) are based on experience, specialist opinion, or prior studies.37
Statistical analysis
Statistical analyses and EFA were calculated using the SPSS (version 23.0, SPSS, Inc., Chicago, IL, USA) software package and CFA was performed using the LISRE 8.5 software for Windows.
Results
Face validity
Based on the obtained opinions from participants, 1) ambiguous items were revised and 2) minor wording errors were corrected. The result of quantitative face validity revealed that impact score was equal or >1.5 for all items.
Content validity
Wording, grammar, item allocation, and scaling were checked to be appropriate. Given that the CVI and CVR of all items of the instrument, respectively, were ≥0.80 and ≥0.49, no items were removed in this stage.
Construct validity
The data of 150 samples were used for evaluating the EFA. The demographic characteristics of participants are shown in Table 1.
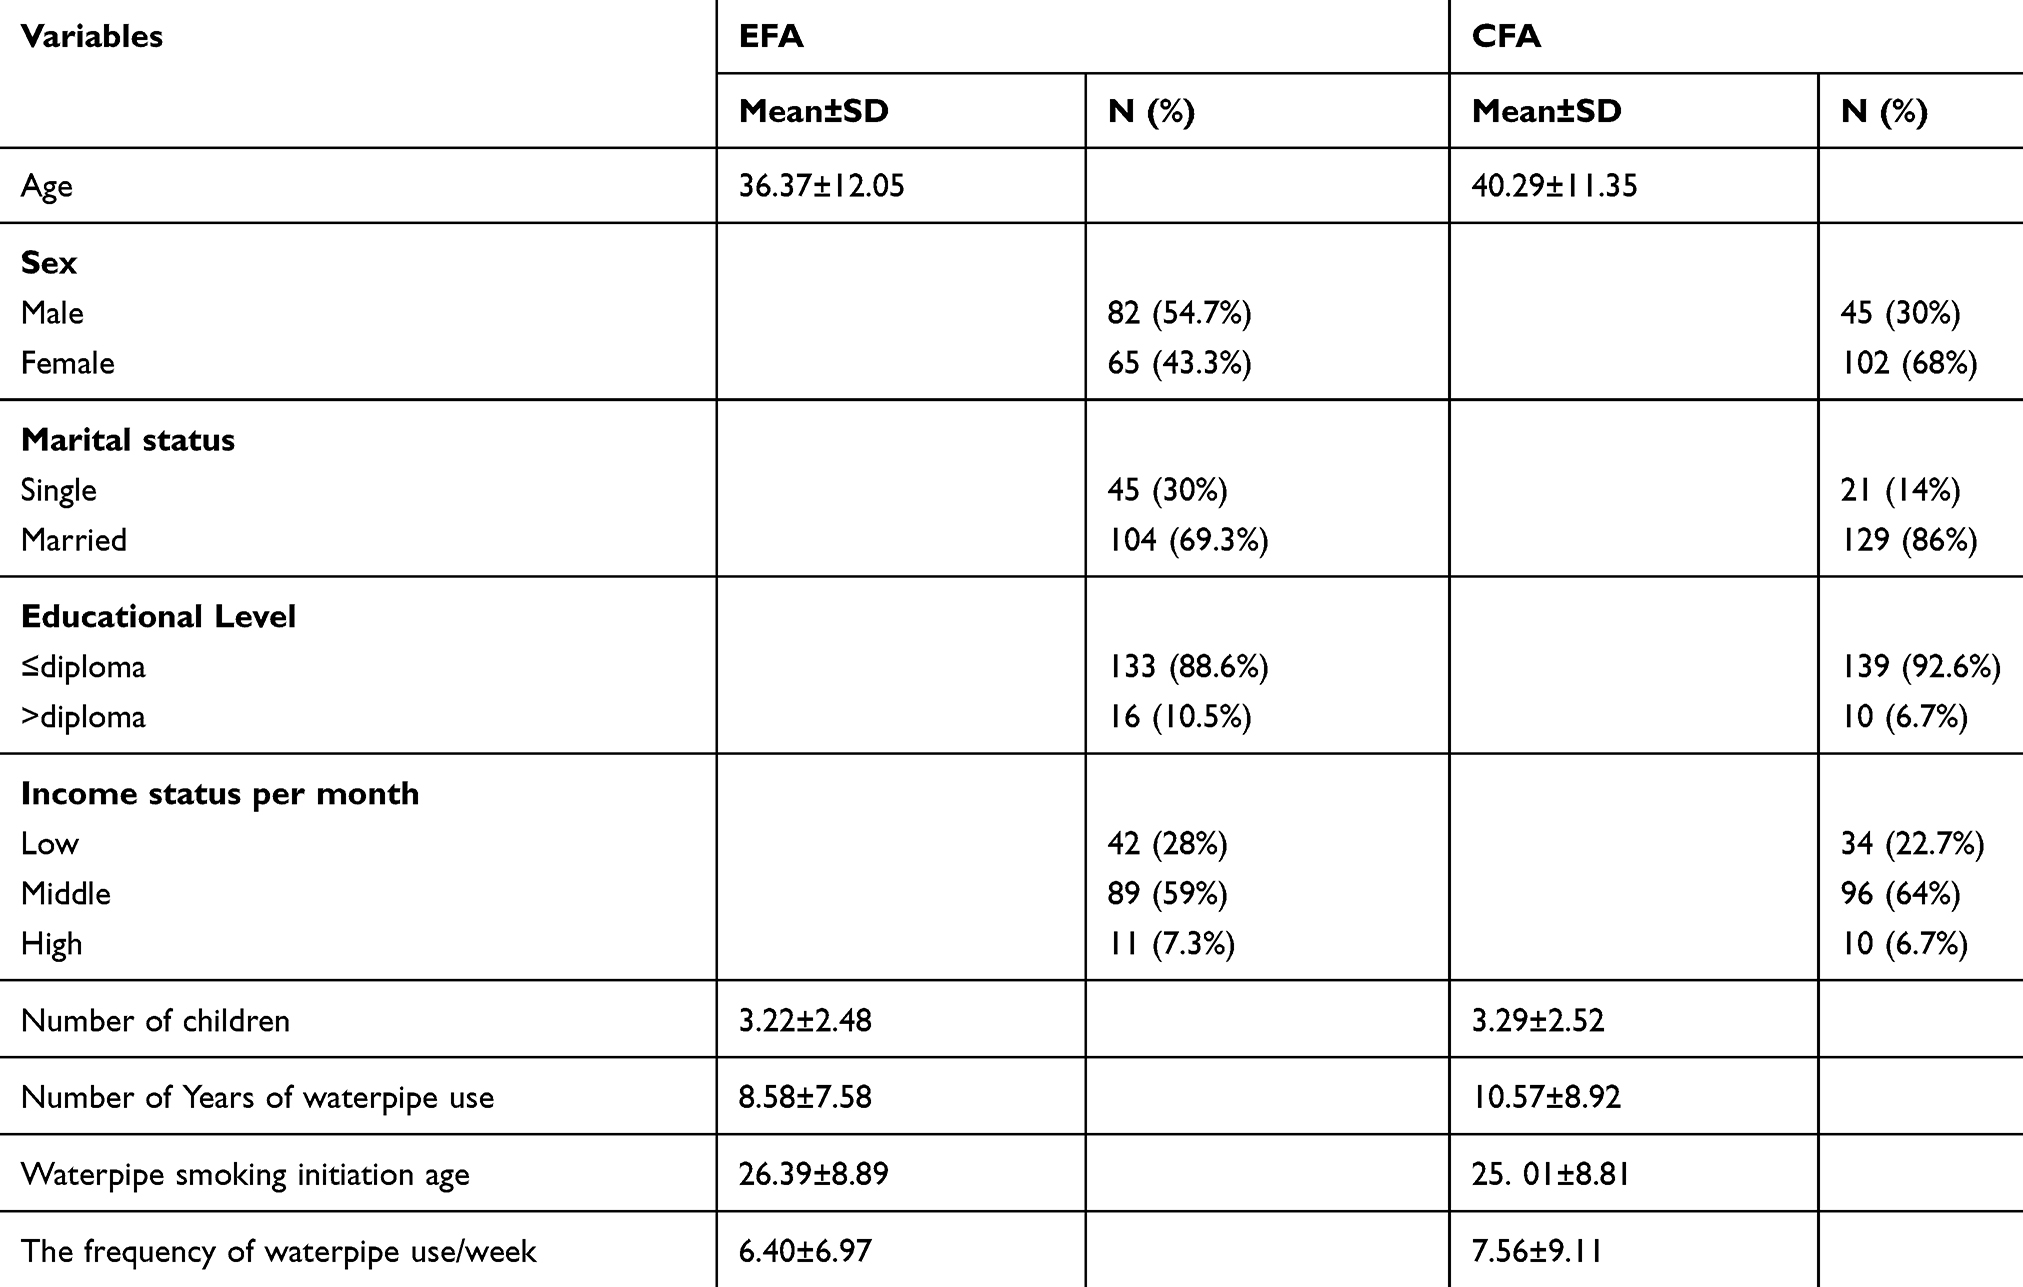 |
Table 1 Demographic characteristics of two groups of participants for assessing exploratory factor analysis (n=150) and confirmatory factor analysis (n=150) |
The EFA was conducted using PCA with varimax rotation. The result of EFA explained that the KMO (was =0.71) and Bartlett’s test of sphericity were statistically significant (=912.36, df=105, p<0.0001), suggesting that the data were appropriate for factor analysis. The communalities >0.2 and factors loading >0.4 of all items were pleasure. For the data extraction factor, Kaiser Criteria with an eigenvalue of more than 1 showed that the TPB included four factors matching the basic version.
Four factors were extracted from Kaiser Criteria, and explained 64.97% of the total variance.
In order to name the factors, the factors structure was compared with the survey items. These factors were labeled in terms of the main variables, which were related to the following items: behavioral intention, subjective norms, perceived behavioral control, and attitude. Table 2 presents the range of factor loading of each item.
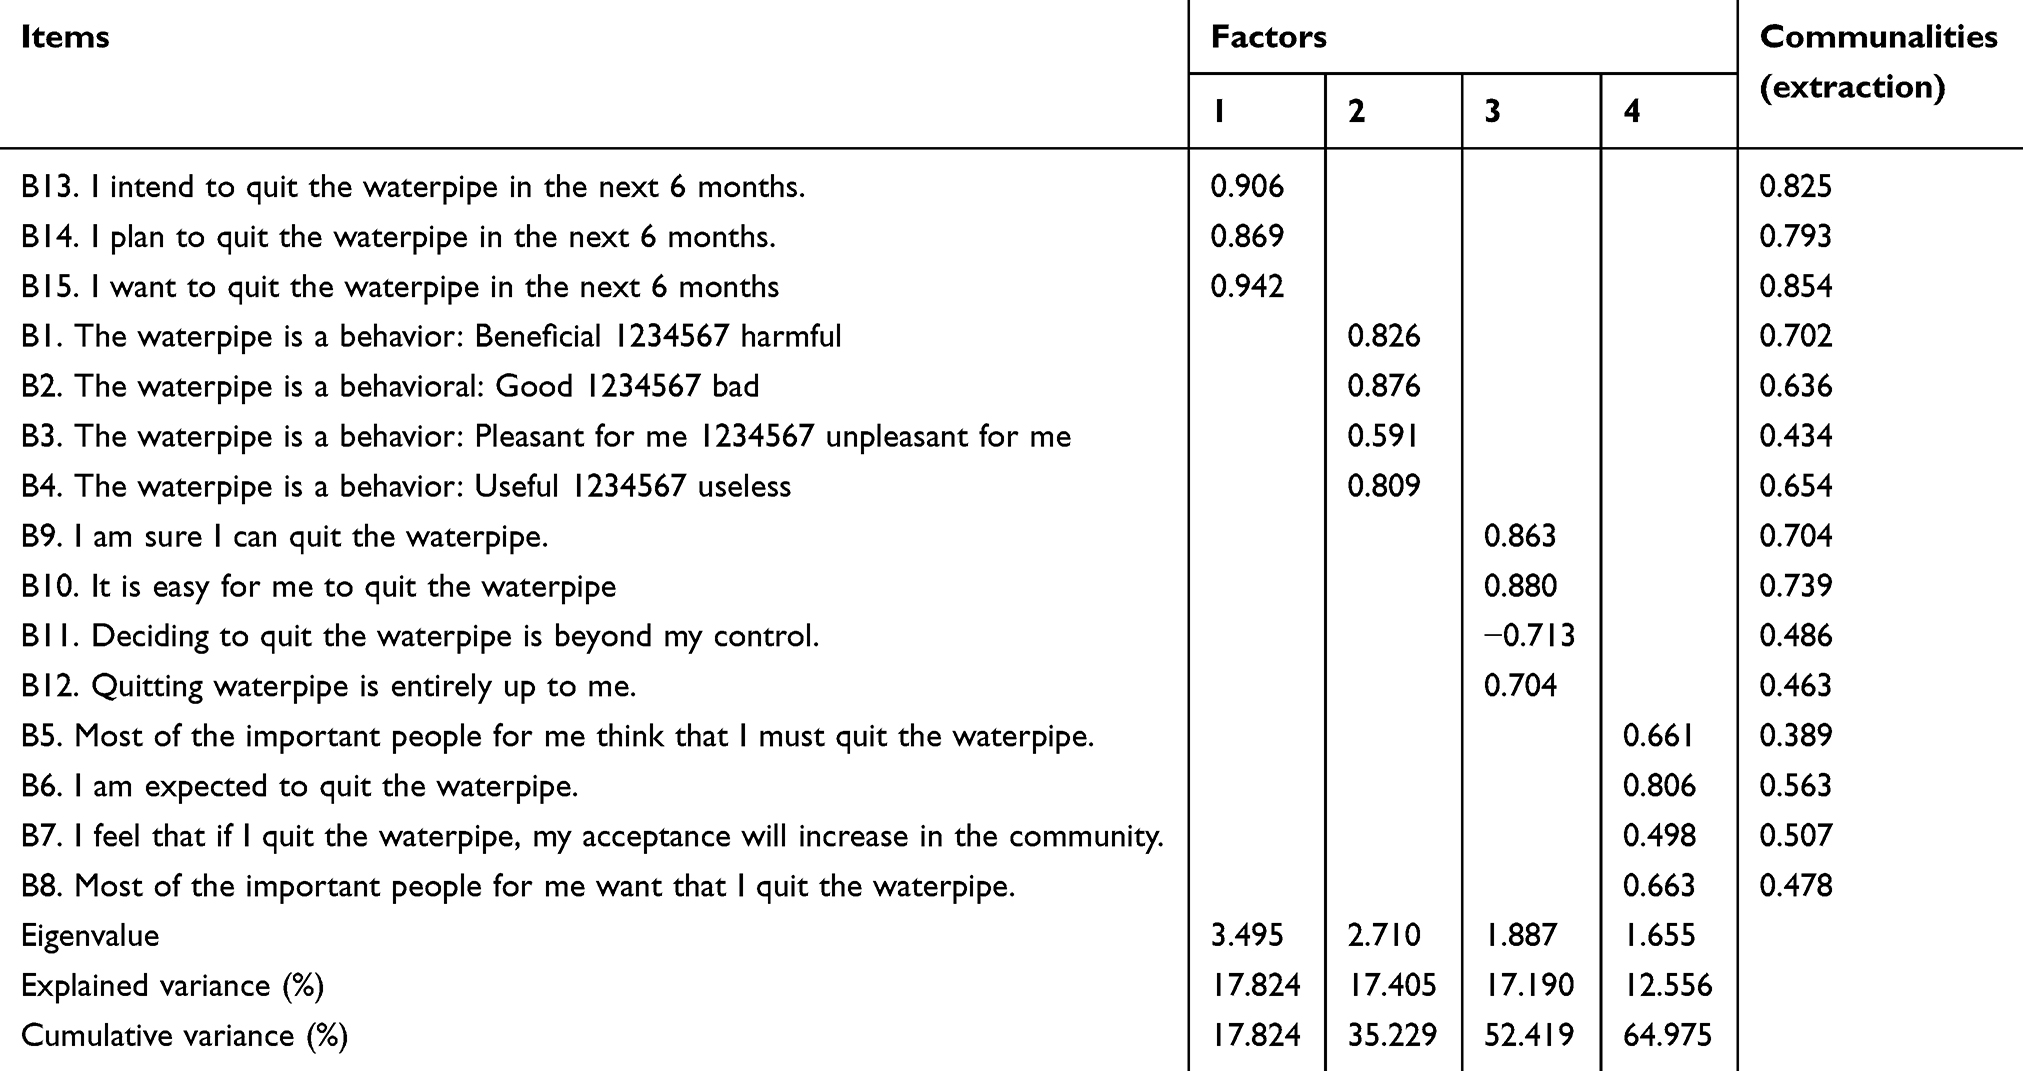 |
Table 2 Factor loadings of the theory of planned behavior variables obtained from EFA in Iranian waterpipe smokers (n=150) |
Furthermore, the CFA was applied to evaluate how well the model extracted by EFA and the theoretical framework behind the instrument fitted the data.
The following fit indices were before model fitted: the GFI =0.93; the AGFI =0.90; the CFI =0.99; IFI =0.99; NFI =0.92; NNFI =0.99, root mean square residual (RMR =0.11; the RMSEA =0.017; and the relative Chi-square (χ2/df) =0.992. The initial results of CFA showed that the measurement model did not fit the data. In standard estimation mode, two items including 1 item of subjective norms (item Sn1) and 1 item of perceived control behavior (item Pbc3) subscale had loading factors of <0.4. Also in meaningful coefficient mode, item Pbc3 indicated T-value was not significant (Figures 2 and 3). We omitted these two items from the instrument. Following this modification, the obtained model was strongly fitted and approved (Figures 4 and 5). The following fit indices were considered after model fitted: the GFI =0.94; the AGFI =0.91; the CFI =1.00; (IFI =1.00; NFI =0.92; NNFI =1.00, SRMR =0.082; the RMSEA =0.00; and the relative Chi-square (χ2/df) =1.041, which all together demonstrate the fitness of the model. Moreover, all the estimate coefficients were statistically significant (P<0.0001) and >0.40.
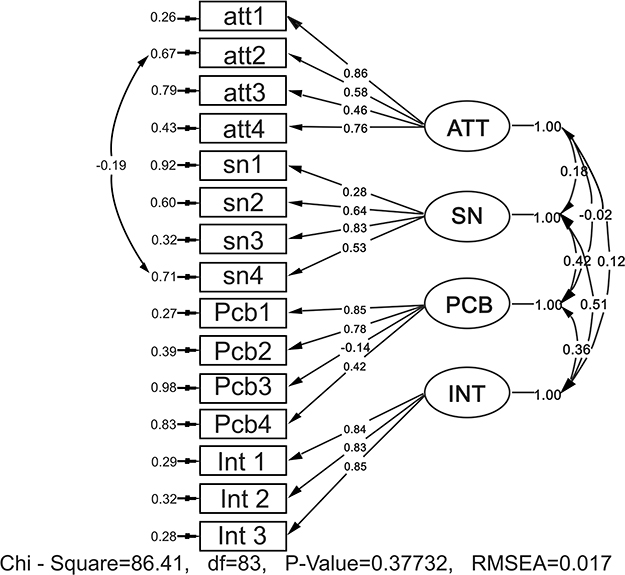 |
Figure 2 Initial model in standard estimation mode: the final pattern of 13-item questionnaire following CFA of 150 waterpipe users; data fitted the TPB and its factors loading were illustrated on the arrows. Abbreviations: att, attitude; Sn, subjective norm; PCB, perceived behavior control; Int, intention. |
 |
Figure 3 Initial model in meaningful coefficient mode: the final pattern of 13-item questionnaire following CFA of 150 waterpipe users; data fitted the TPB and T-values were illustrated on the arrows. Abbreviations: att, attitude; Sn, subjective norm; PCB, perceived behavior control; Int, intention. |
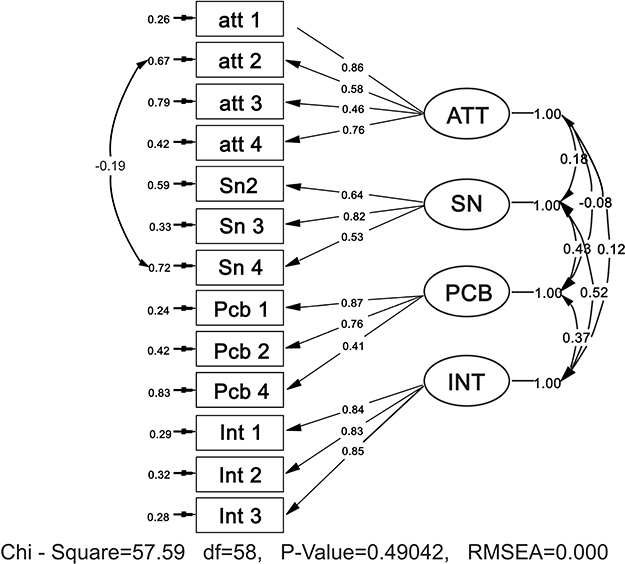 |
Figure 4 Modified model in standard estimation mode: the final pattern of 13-item questionnaire following CFA of 150 waterpipe consumers; data fitted the TPB and its factors loading were illustrated on the arrows. Abbreviations: att, attitude; Sn, subjective norm; PCB, perceived behavior control; Int, intention. |
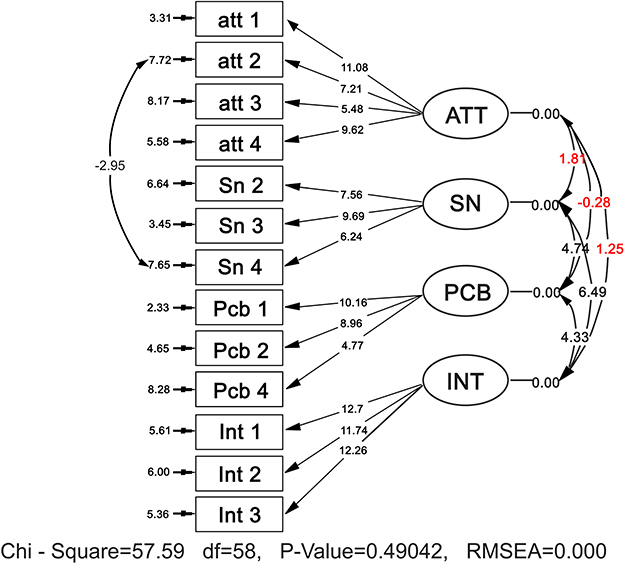 |
Figure 5 Modified model in meaningful coefficient mode: the final pattern of 13-item questionnaire following CFA of 150 waterpipe consumers; data fitted the TPB and T-values were illustrated on the arrows. Abbreviations: att, attitude; Sn, subjective norm; PCB, perceived behavior control; Int, intention. |
Composite reliability was computed for every construct, which was then evaluated with the threshold of 0.6.40,41 The CR value for total constructs was ≥0.7, accepting composite reliability. AVE for every construct was calculated that two constructs (ATT-SN) had AVE<0.5. Although AVE is above minimum cutoff of 0.5 but 0.4 value is also accepted. According to Fornell–Larcker, the convergent validity is confirmed if AVE is lower than 0.5, but CR is >0.6. According to Table 3, convergent validity constructs were confirmed.40,42
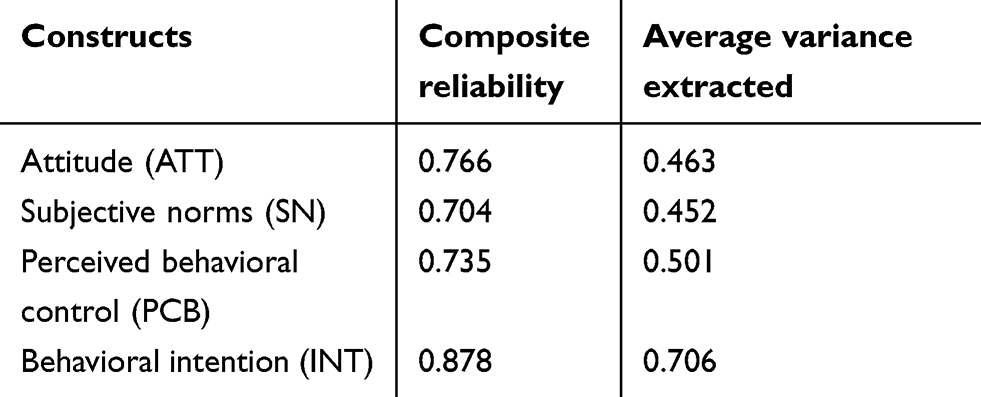 |
Table 3 Composite reliability (CR), average variance extracted (AVE) between constructs in 150 Iranian waterpipe smokers |
Due to the Fornell–Larcker criterion, discriminant validity is confirmed if the square root of each AVE has a value more than the correlation coefficients for each construct in the corresponding rows and columns.36 In Table 4, the diagonal diameter displays the square root of each (AVE) that had value more than the correlations with other constructs. So discriminant validity was accepted.
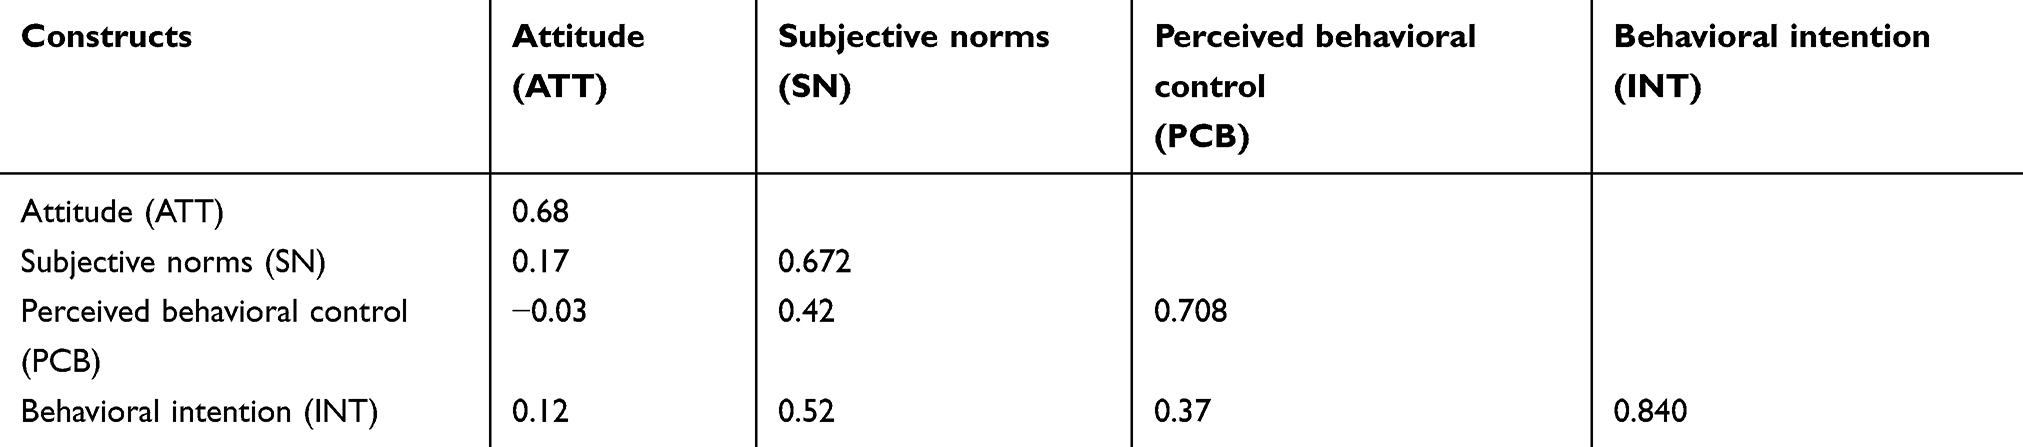 |
Table 4 The square root of the average variance extracted (AVE) (in bold) and correlations between constructs in 150 Iranian waterpipe smokers |
Reliability
Cronbach’s alpha and ICC of subscales are presented in Table 5. Given the Cronbach’s alpha and ICC of the instrument, subscales were acceptable and thus we did not delete any items in this stage.
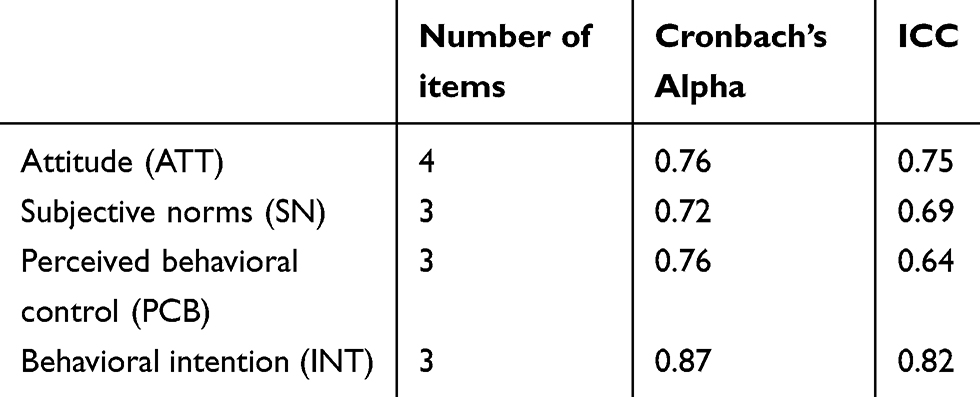 |
Table 5 Cronbach’s alpha (n=30) and ICC (n=25) for TPB subscales in terms of the intention to quit waterpipe tobacco smoking |
Final instrument
The final version of the developed instrument in the study had 13 items that measured four subscales of TPB including attitude toward waterpipe tobacco smoking (4 items), subjective norms (3 items), perceived behavioral control (3 items), and behavioral intention (3 items).
Discussion
Given the fact that valid and reliable questionnaires are needed to theoretically design and evaluate health education interventions,43 the results of the present study showed that the developed instrument based on TPB variables was a valid and reliable instrument to detect the determinants of waterpipe tobacco smoking cessation. Health professionals and psychologist can use the theory-based instrument for needs assessment and develop effective educational interventions of the target group in Iran since literature showed that having a theory-based conceptual framework might help increase the effectiveness of the developed intervention.44,45
Qualitative face validity findings showed that the majority of items were meaningful and simple to understand by the study participants. Some modifications were done in the wording of some items for more clarification. In addition, in quantitative face validity, total items were regarded appropriate because impact score of items was equal to or >1.5. Barati et al,46 in a study of psychometric properties of the TPB, constructs about tobacco smoking evaluated face validity in two qualitative and quantitative phases. Their result of quantitative face validity showed that the effects score was ≥1.5 for all items. According to their result of the qualitative face validity, participants reported small changes in the wording of some items for more clarification. Besides, Hassani et al,47 in a psychometric study determined face validity of an instrument based on the protection motivation theory to measure factors influencing women’s intention to first Pap test practice. They found that face validity might determine the ambiguous questions in the instrument. Given the face validity, identifying the degree to a test and its items seem valid and meaningful to the individuals taking the test.48 Thus, it can be implemented for the psychometric evaluation of each instrument.
In the present study, quantitative content validity was measured based on the opinions of an expert panel of 15 health education and addiction. Results revealed that CVI and CVR scores of all items of the instrument were acceptable (≥0.80 and ≥0.49, respectively). In the scale developed by Shirvani et al,28 the CVI and CVR of the scale were from 0.8 to 0.97 and from 0.78 to 0.98, respectively. The mean scores for the CVI and CVR were 0.89 and 0.80, respectively.
The most important step in determining the validity of an instrument is the construct validation, specifically in psychometric matters. Factor analysis is the best method about this issue.46,49 First, EFA (KMO=0.71) and significant Bartlett’s Test of Sphericity (=912.36, df=105, p<0.001) were conducted and found that samples were appropriate for the factor analysis. Afterward, EFA was applied to confirm the construct validity of the instrument. In this step, no item was removed probably because this instrument has been validated in previous steps. EFA led to four factors: behavioral intention, subjective norms, perceived behavioral control, and attitude. Hereof, Ajzen believes that each variable must consist of at least 3 items; accordingly, at least 12 items are required for the direct measurement method.46,50 Four factors identified in this study explained 64.97% of the variance and the highest expressed changes were related to the behavioral intention construct. In line with our findings, in the study of Ruslan et al,51 four structures also were loaded and the theory reported 64.35% of the variance of smoking cessation. Ghofranipour et al52 also showed that the TPB explained 76.33% of the variance of physical activity and attitude had the highest amount of variance.
In addition, CFA was applied to determine if there is coherence between the data and the theoretical structure. Thus, EFA is often used in the early steps of instrument development and construct validation, but CFA is used in the later stage when the main structure is based on previous empirical and theoretical backgrounds.28 CFA with 15 items in four subscales was tested. The result of the present study did not exactly support the construct validity of the initial instrument. Since there was a significant problem in the fit indexes, some modifications were made. Two items (1 item of subjective norms subscale and 1 item of perceived behavior control subscale) with loading factors <0.4 were deleted through the factor analysis. In addition, item Pbc3 indicated that T-value was not significant (Figures 2 and 3). After deleting two items (item Sn1, and item Pbc3), model was accepted in the modified form (Figures 4 and 5). The results of CFA showed that the comparative indices of the model were modified as follows: the GFI =0.94, AGFI =0.91, the CFI =1.00, IFI =1.00, NFI =0.92, NNFI =1.00, SRMR =0.082, the RMSEA =0.000, and the relative chi-square (x2/df) =0.992 (p<0.0001), indicating an acceptable fit for the data. Therefore, the CFA represents the adequacy of the model and the appropriate fit of its structural model for the study population.
The reliability of the present questionnaire was measured using the Cronbach’s α coefficient and ICC. Reliability refers mainly to stability, internal consistency, and equivalence of an instrument.53 Cronbach’s alpha of all constructs was considered acceptable. Moreover, the result of ICC showed that provided instrument had satisfactory reliability. The study of Bordewich et al54 in five European countries revealed the internal consistency of the TPB from 0.52 to 0.89. In the study by Diamond55 on American adolescents, an internal consistency 0.76 was also reported for the variables of the TPB. In addition, a study by Armitage56 showed good internal and test–retest reliability of the assessed components of TPB.
In addition, in this study, the convergent and discriminant validities were assessed. According to Fornell Larcker criterion, the convergent and discriminant validities are confirmed. According to our information, the present study is one of the few studies in the world that has presented a scale TPB-based to measure factors influencing adults’ intention to quit waterpipe tobacco smoking by providing the convergent and discriminant validities. In the present study, we introduced an instrument for measuring TPB variables in terms of the intention to quit waterpipe tobacco smoking among a sample of rural Iranian villagers. This study had two limitations, however. First, we assessed TPB variables directly and thus the development of a valid instrument to an indirect measure of TPB variables in terms of waterpipe smoking cessation is recommended. Second, participants were selected among adults who were living in the two villages of Shiraz, Iran. This issue may limit the generalization of the results to other people in other geographic areas of Iran. Hence, further attempts to validate the instrument within various geographic areas in Iran are essential.
Conclusion
The findings showed that the developed instrument in this study was a reliable and valid instrument to identify factors related to the intention to quit waterpipe tobacco smoking in Iranian rural adults. It can be used in developing theory-based interventions in the field of addiction.
Abbreviation
TPB, theory of planned behavior.
Ethics approval and informed consent
This study is a part of Ph.D. thesis that was approved by the ethics committee of Iran University of Medical Sciences, Tehran, Iran (Ethical Approval Code: IR.IUMS.REC.94-05-27-27359). All participants were fully informed about the study objectives. Also, a consent form was obtained from them.
Data availability
The datasets used during the current study are available from the corresponding author on reasonable request.
Acknowledgment
The authors are grateful to all who helped to make this study possible. This study was supported by Iran University of Medical Sciences.
Author contributions
All authors contributed to data analysis, drafting or critically revising the article, gave final approval of the version to be published, and agree to be accountable for all aspects of the work.
Disclosure
The authors report no conflicts of interest in this work.
References
1. Aslam HM, Saleem SH, German S, Asif–Qureshi W. Harmful effects of shisha: literature review. Int Arch Med. 2014;7(1):16. doi:10.1186/1755-7682-7-16
2. Barati M, Allahverdipour H, Hidarnia A, Niknami S. Predicting tobacco smoking among male adolescents in Hamadan City, West of Iran in 2014: an application of the prototype willingness model. J Res Health Sci. 2015;15(2):113–118. doi:10.20286/jech-010364
3. Albisser S, Schmidlin J, Schindler C, Tamm M, Stolz D. Waterpipe smoking and its association with cigarette and cannabis use in young adults in Switzerland. Respiration J. 2013;86(3):210–215. doi:10.1159/000342894
4. Maziak W, Ward KD, Afifi Soweid RA, Eissenberg T. Tobacco smoking using a waterpipe: a re-emerging strain in a global epidemic. Tobacco Control J. 2004;13(4):327–333. doi:10.1136/tc.2004.008169
5. Loewen JM, Savaya MG, Mackie ZF. Health profession student perception on hookah use and curriculum improvement implications. Health Care Curr Rev. 2016;(4):1. doi:10.4172/2375-4273.1000157
6. Berdi Ozouni Davaji R, Dadban Shahamat Y, Hajili Davaji F, et al. Patterns, beliefs, norms and perceived harms of hookah smoking in North Iran. Asian Pac J Cancer Prev. 2017;18(3):823–830. doi:10.22034/APJCP.2017.18.3.823
7. Blachman-Braun R, Del Mazo RL, López-Sámano G, Buendía-Roldán I. Hookah, is it really harmless? Respir Med. 2014;108(5):661–667. doi:10.1016/j.rmed.2014.01.013
8. El-Zaatari ZM, Chami HA, Zaatari GS. Health effects associated with water pipe smoking. Tob Control. 2015;24(1):i31–i43. doi:10.1136/tobaccocontrol-2014-051908
9. Jawad M, Jawad S, Waziry RK, Ballout RA, Akl E. Interventions for waterpipe tobacco smoking prevention and cessation: a systematic review. Sci Rep. 2016;6(1). doi:10.1038/srep25872
10. Noonan D, Kulbok P, Yan G. Intention to smoke tobacco using a waterpipe among students in a Southeastern U.S. College. Public Health Nurs. 2011;28(6):494–502. doi:10.1111/j.1525-1446.2011.00945.x
11. Tahmasebi R, Saeed Firoozabadi M, Noroozi A. Assessment of the extended theory of planned behavior for nicotine dependence prediction: an application of path analysis. Iran Red Crescent Med J. 2017;19(9). doi:10.5812/ircmj.55661
12. Jackson C. Behavioral science theory and principles for practice in health education. Health Educ Res. 1997;12(1):143–150. doi:10.1093/her/12.1.143
13. McMillan B, Conner M. Using the Theory of Planned Behavior to understand alcohol and tobacco use in students. Psychol Health Med. 2003;8(3):317–328. doi:10.1080/1354850031000135759
14. Alanazi NH, Lee JW, Dos Santos H, Job JS, Bahjri K. The use of planned behavior theory in predicting cigarette smoking among Waterpip smokers. Tob Induc Dis. 2017;15(1). doi:10.1186/s12971-017-0133-z
15. Francis JJ. Constructing Questionnaires Based on the Theory of Planned Behavior: A Manual for Health Services Researches. Centre for Health Services Research: University of Newcastle; 2004. Available from: http://openaccess.city.ac.uk/id/eprint/1735.
16. Ajzen I. The theory of planned behavior. Organ Behav Hum Decis Process. 1991;50(2):179–211. doi:10.1016/0749-5978(91)90020-t
17. Karimy M, Niknami S, Heidarnia AR, Hajizadeh I, Montazeri A. Prevalence and determinants of male adolescents’ smoking in Iran: an explanation based on the theory of planned behavior. Iran Red Crescent Med J. 2013;15:187–193. doi:10.5812/ircmj.3378
18. Bashirian S, Barati M, Fathi Y. Prevalence and factors associated with Tramadol abuse among college students in west of Iran: an application of the Theory of Planned Behavior. Avicenna J Neuro Psycho Physiol. 2014;1(1). doi:10.17795/ajnpp-20314
19. Allahverdipour H, Jalilian F, Shaghaghi A. Vulnerability and the intention to anabolic steroids use among Iranian gym users: an application of the Theory of Planned Behaviors. Subst Use Misuse. 2012;47:309–317. doi:10.3109/10826084.2011.633296
20. Lacasse Y, Godbout C, Series F. Health related quality of life in obstructive sleep apnea. Eur Respir J. 2002;19(3):499–503. doi:10.1183/09031936.02.00216902
21. Grant JS, Davis LL. Focus on quantitative methods: selection and use of content experts for instrument development. Res Nurs Health. 1997;20(3):269–274. doi:10.1002/(sici)1098-240x(199706)20:3<269::aid-nur9>3.3.co;2-3
22. Lawshe CH. A quantitative approach to content validity. Pers Psych. 1975;28(4):563–575. doi:10.1111/j.1744-6570.1975.tb01393.x
23. Polit DF, Beck CT. Nursing Research: Principles and Methods.
24. Beavers AS, Lounsbury JW, Richards JK, Huck SW, Skolits GJ, Shelley L. Practical considerations for using exploratory factor analysis in educational research. Pract Assess Res Eval. 2013;18(6).
25. MacCallum RC, Widaman KF, Zhang S, Hong S. Sample size in factor analysis. Psychol Methods. 1999;4(1):84–99. doi:10.1037/1082-989X.4.1.84
26. Hogarty YK, Hine CV, Kromrey JD, Ferron JK, Mumford KR. The quality of factor solutions in exploratory factor analysis: the influence of sample size, communality, and ove determination. Educ Psychol Meas. 2005;65(2):202–226. doi:10.1177/0013164404267287
27. Kyriazos TA. Applied psychometrics: sample size and sample power considerations in factor analysis (EFA, CFA) and SEM in general. Psychology. 2018;9(8):2207–2230. doi:10.4236/psych.2018.98126
28. Gholamnia Shirvani Z, Ghofranipour F, Gharakhanlou R, Kazemnejad A. Psychometric properties of the developed theory of planned behavior questionnaire about physical activity of military personnel’s wives in Tehran. Health Educ Health Promot. 2014;2(3):31–34.
29. Statistics How To. Varimax Rotation: Definition (web) [Internet]. 2019 [cited 12 September 2019]. Available from: https://www.statisticshowto.datasciencecentral.com/varimax-rotation-definition/.
30. Maskey R, FEI J, Nguyenc HO. Use of exploratory factor analysis in maritime research. Asian J Shipping Logist. 2018;34(2):91–111. doi:10.1016/j.ajsl.2018.06.006
31. Child D. The Essentials of Factor Analysis.
32. Brown TA. Confirmatory Factor Analysis for Applied Research. New York: The Guilford Press; 2006.
33. Hooper D, Coughlan J, Mullen M. Structural equation modelling: guidelines for determining model fit. Electron J Bus Res Methods. 2008;6(1):53–60. doi:10.21427/D7CF7R
34. Kline RB. Principles and Practice of Structural Equation Modeling.
35. D T C, Fiske DW. Convergent and discriminant validation by the multitrait -multimethod matrix. Psychol Bull. 1959;56(2):56–81.
36. Ab HMR, Sami W, Mohmad Sidek MH. Discriminant validity assessment: use of Fornell & Larcker criterion versus HTMT criterion. J Phys Conf Ser. 2017;890:012163. doi:10.1088/1742-6596/890/1/012163
37. Nor Arifin W. A web-based sample size calculator for reliability studies. Educ Med J. 2018;10(3):67–76. doi:10.21315/eimj2018.10.3.8
38. Arifin WN. Sample size calculator (web) [Internet]. 2019. Available from: https://wnarifin.github.io/ssc/ssalpha.html. Accessed 10 September, 2019.
39. Arifin WN. Sample size calculator (web) [Internet]. 2019. Available from: https://wnarifin.github.io/ssc/ssicc.html. Accessed 10 September, 2019.
40. Pervan M, Curak M, Pavic Kramaric T. The influence of industry characteristics and dynamic capabilities on firms’ profitability. Int J Financial Stud. 2018;6(4). doi:10.3390/ijfs6010004
41. Bagozzi R, Yi Y. On the evaluation of structural equation models. J Acad Marketing Sci. 1988;16(1):74–94. doi:10.1007/BF02723327
42. Fornell C, Larcker D. Evaluating structural equation models with unobservable variables and measurement error. J Marketing Res. 1981;18(1):39–50. doi:10.1177/002224378101800104
43. Blue CL, Marrero DG. Psychometric properties of the healthful eating belief scales for persons at risk of diabetes. J Nutr Educ Behav. 2006;38(3):134–142. doi:10.1016/j.jneb.2006.01.010
44. Solhi M, Saki M, Alimohammadi I, Haghani H. Effect of health education based on BASNEF pattern on use of personal protective respiratory equipment in Ahvaz carbon block factory workers, 2009. Iran Occup Health. 2012;9(2):50–58.
45. Ebrahimipour H, Akerdi BJ, Solhi M, Esmaeli H. Effect of educational intervention based on Self-Efficacy theory (SET) on behavior of prevention of HIV/AIDS in high risk women. Iran J Obstet Gynecol Infertil. 2015;18(144):19–27.
46. Barati M, Allahverdipour H, Hidarnia A, Niknami S, Bashirian S. Belief-based Tobacco Smoking Scale: evaluating the psychometric properties of the Theory of Planned Behavior’s constructs. Health Promot Perspect. 2015;5(1):59–71. doi:10.15171/hpp.2015.008
47. Hassani L, Dehdari T, Hajizadeh E, Shojaeizadeh D, Abedini M, Nedjat S. Development of an instrument based on the protection motivation theory to measure factors influencing women’s intention to first pap test practice. Asian Pac J Cancer Prev. 2014;15(3):1227–1232. doi:10.7314/APJCP.2014.15.3.1227
48. Holden RB. Face validity. In: Weiner IB, Craighead WE, editors. The Corsini Encyclopedia of Psychology.
49. Ferguson E, Cox T. Exploratory factor analysis: a users’ guide. Int J Select Assess. 1993;1:84–94. doi:10.1111/j.1468-2389.1993.tb00092.x
50. Francis J, Eccles MP, Johnston M, et al. Constructing Questionnaires Based on the Theory of Planned Behavior: A Manual for Health Services Researchers. Newcastle: Centre for Health Services Research; 2004.
51. Ruslan NH, Yasin SM, Rodi Isa M, Nadzimah MN, Ahing T, Rajikin MH. Reliability and construct validity of the malay version of theory of planned behaviour (TPB) for smoking cessation. Asian Pac J Cancer Prev. 2018;18. doi:10.22034/APJCP.2018.19.10.2815
52. Ghazanfari Z, Niknami S, Ghofranipour F, Hajizadeh E, Montazeri A. Development and psychometric properties of a belief-based Physical Activity Questionnaire for Diabetic Patients (PAQ-DP). BMC Med Res Methodol. 2010;104. doi:10.1186/1471-2288-10-104
53. Cláudia de Souza A, Costa Alexandre NM, Brito Guirardello ED. Psychometric properties in instruments evaluation of reliability and validity. Epidemiol Serv Saude. 2017;26(3):649–659. doi:10.5123/S1679-49742017000300022
54. De Bourdeaudhuij I, Klepp KI, Due P, et al. Reliability and validity of a questionnaire to measure personal, social and environmental correlates of fruit and vegetable intake in 10-11-year-old children in five European countries. Public Health Nutr. 2005;8:189–200. doi:10.1079/phn2004673
55. HC D. The Role of Gender in Staying Smoke-free in Adolescence: Using a Theory of Planned Behavior Approach. Canada: University of Prince Edward Island; 2009.
56. Armitage CJ, Conner M. The theory of planned behavior: assessment of predictive validity a ‘perceived control. Br J Soc. 1999;38(1):35–54. doi:10.1348/014466699164022
 © 2019 The Author(s). This work is published and licensed by Dove Medical Press Limited. The
full terms of this license are available at https://www.dovepress.com/terms
and incorporate the Creative Commons Attribution
- Non Commercial (unported, 3.0) License.
By accessing the work you hereby accept the Terms. Non-commercial uses of the work are permitted
without any further permission from Dove Medical Press Limited, provided the work is properly
attributed. For permission for commercial use of this work, please see paragraphs 4.2 and 5 of our Terms.
© 2019 The Author(s). This work is published and licensed by Dove Medical Press Limited. The
full terms of this license are available at https://www.dovepress.com/terms
and incorporate the Creative Commons Attribution
- Non Commercial (unported, 3.0) License.
By accessing the work you hereby accept the Terms. Non-commercial uses of the work are permitted
without any further permission from Dove Medical Press Limited, provided the work is properly
attributed. For permission for commercial use of this work, please see paragraphs 4.2 and 5 of our Terms.