Back to Journals » OncoTargets and Therapy » Volume 18
Development of a Prognostic m6A-Related lncRNA Signature and Functional Validation of FAM83A-AS1 in Lung Adenocarcinoma
Authors Zhang G, Liu C, Wang Y
Received 7 May 2025
Accepted for publication 27 August 2025
Published 30 September 2025 Volume 2025:18 Pages 1107—1123
DOI https://doi.org/10.2147/OTT.S538953
Checked for plagiarism Yes
Review by Single anonymous peer review
Peer reviewer comments 2
Editor who approved publication: Dr Lukas Hawinkels
Guojun Zhang,1 Cheng Liu,2 Yukun Wang3,4
1Department of Clinical Nutrition, Hospital of Southern University of Science and Technology, Shenzhen, People’s Republic of China; 2School of Medicine, Southern University of Science and Technology, Shenzhen, People’s Republic of China; 3Department of Pharmacy, Hospital of Southern University of Science and Technology, Shenzhen, People’s Republic of China; 4Department of Pharmacology, School of Medicine, Southern University of Science and Technology, Shenzhen, People’s Republic of China
Correspondence: Guojun Zhang, Email [email protected]
Introduction: This work aimed to identify m6A-related long non-coding RNAs (lncRNAs) associated with lung adenocarcinoma (LUAD) and evaluate their prognostic value and to examine the oncogenic actions of FAM83A-AS1 in LUAD.
Methods: The m6A-related lncRNAs in LUAD were identified by correlating lncRNA expression profiles with known m6A regulators using TCGA RNA-seq data. Prognostic lncRNAs were selected through univariate and multivariate Cox regression analyses and integrated into a risk model termed m6ARLSig. The model’s predictive performance was assessed using Kaplan-Meier survival analysis, ROC curves, and principal component analysis. Immune infiltration and therapeutic responses were evaluated using CIBERSORT and drug sensitivity prediction. In vitro assays were conducted in A549 and A549/DDP cell lines to assess the oncogenic and drug resistance roles of FAM83A-AS1.
Results: We screened a set of m6A-related genes and identified a subset of m6A related-lncRNAs from TCGA through correlation analysis. Eight m6A-related lncRNAs were significantly associated with patient outcomes. AL606489.1 and COLCA1 functioned as independent adverse prognostic biomarkers, whereas six long non-coding RNAs served as independent favorable predictors of overall survival (OS). Eight lncRNAs were employed to develop a prognostic m6A-associated lncRNA signature (m6ARLSig). Based on personalized m6ARLSig levels, we computed a risk score for each individual and stratified the cohort into low-risk and high-risk categories. Survival analysis revealed a marked divergence in overall survival between the low- and high-risk cohorts, thereby substantiating the m6ARLSig’s prognostic utility. In multivariate modeling, the m6ARLSig remained an independent predictor of prognosis. A nomogram incorporating m6ARLSig and clinicopathological parameters was constructed, providing a clinically adaptable tool for survival probability estimation. FAM83A-AS1 knockdown repressed A549 proliferation, invasion, migration, EMT, but increased apoptosis. Additionally, FAM83A-AS silence also attenuated cisplatin resistance of A549/DDP cells.
Conclusion: Collectively, we identified a novel m6ARLSig with prognostic value in LUAD. The m6ARLSig showed associations with clinicopathological parameters, immune cell infiltration, and therapeutic responses. FAM831-AS1 may play oncogenic role in LUAD.
Keywords: m6A-related lcnRNAs, lung adenocarcinoma, prognostic signature, tumor microenvironment, FAM83A-AS1, cisplatin resistance
Introduction
Globally, lung cancer is a leading cause of cancer-related deaths.1,2 Despite integrated treatment options including radiotherapy, targeted therapy, and chemotherapy, and for lung adenocarcinoma (LUAD), five-year overall survival (OS) rate remains low.3,4 Therefore, there is a critical need to address this challenge. RNA methylation is essential in complex mechanisms underlying lung cancer pathogenesis.5 Existence of various RNA methylation modifications, including pseudoguanosine, 5-methylctisine (m5C) and N-6 methylation (m6A) within the transcriptome RNA has been reported.6 These modifications have been implicated in the development of LUAD.6 Advancements in next-generation sequencing technology have facilitated research on m6A, and enabled the localization of m6A through innovative techniques.7,8 M6A-related enzymes and demethylases are categorized into three groups, each responsible for reversible methylation of RNA at the sixth nitrogen atoms.9 Enzymes known as m6A “writers”, including “KIAA1429”, “METTL3-14”, “HAKAI”, “WTAP” and “WTAP” form m6A complex and catalyze forward methylation of RNA.10 Demethylases such as “ALKBH5” and “FTO” are involved in reversing the methylation process.10 These m6A regulators have been extensively implicated in human diseases and contribute to malignant tumors.11 Tumor microenvironment (TME) refers to surroundings in which tumors migrate, grow and invade, involving interactions among immune cells, stromal cells, and tumor cells, which significantly impact tumor growth and development.12,13 TME components are attracted by tumor cells and act as enhancing forces for tumor progression.14 Tumor-related macrophages, despite initially acting as barriers against tumor cell removal, have been found to promote tumor progression by secreting paracrine signals within the tumor.15
Comprehensive genome analysis has led to active transcription regions discovery, revealing that over 75% of RNA molecules cannot be classified as coding for proteins or mere “transcriptional noise”. This significant portion, known as non-coding RNA (ncRNA), plays a crucial regulatory role in various biological processes.15 Non-coding RNAs consist of short, middle-sized, and long ncRNAs, with increasing attention on lncRNAs alongside the predominant focus on short non-coding RNAs (miRNAs).15 Gene expression is controlled by these molecules through various mechanisms, encompassing transcriptional, epigenetic, and post-transcriptional processes.16,17 Mechanistically, lncRNAs engage with RNA-binding proteins, transcription factors, and form molecular structures that facilitate the recruitment of diverse effectors. Certain lncRNAs are categorized as competing endogenous RNAs (ceRNAs) and function as “miRNA sponges”, exerting an indirect influence on the activation of miRNA target genes.18,19 LncRNAs that exhibit differential expression (DElncRNAs) have been linked to the progression of cancer. These DElncRNAs show varying expression patterns depending on the stage of the disease and have an influence on crucial pathophysiological pathways. The potential of aberrantly expressed lncRNAs as targets for therapeutic intervention shows great promise. Deep RNA-sequencing studies in lung cancer have identified DElncRNAs that distinguish tumor samples from normal samples in NSCLC, LUAD, and LUSC.20–22 Further investigations have revealed the disruptive effects of DElncRNAs on multiple molecular pathways in NSCLC cells.20–22 Given the intricate role of lncRNAs in regulating immune-related pathways and their potential to influence the TME,23 investigating m6A-modified lncRNAs provides an opportunity to uncover novel biomarkers and therapeutic targets in LUAD. Recent evidence suggests that certain m6A-related lncRNAs may modulate immune cell infiltration, affect immune checkpoint expression, and contribute to drug resistance.24,25 However, systematic characterization of these lncRNAs in relation to both clinical outcomes and the immune landscape in LUAD remains limited.
This study developed a signature of lncRNAs associated with m6A and conducted a comprehensive analysis of their correlations with clinicopathological features and prognosis in LUAD patients. Subsequently, we constructed a predictive nomogram that combines m6A-related lncRNA signature (m6ARLSig) with clinical parameters to provide estimates of survival outcomes for these patients. By conducting comparisons between high- and low-risk cohorts, we examined multiple factors such as response to immunotherapy and immune status. Through our findings, we have gained useful insights into mechanisms involving m6A in LUAD, which could potentially improve personalized treatment strategies and prognostic assessments.
Materials and Methods
The Process of Acquiring Datasets and Extracting Samples
To gather the necessary data for analysis, the dataset and sample extraction process entailed acquiring RNA-seq data specific to LUAD from TCGA database. In this study, 526 LUAD patients were included. Moreover, comprehensive clinical details were also retrieved from the TCGA database. Subsequent analyses focused on a subset of patients, specifically 480 individuals with follow-up details and survival time > 30 days.
Detection of m6A-Related Genes
A combined effort involving the database and a literature search resulted in the collection of a total of 23 m6A-related genes. These genes were then further filtered by expression data for LUAD in TCGA database. Ultimately, 10 m6A-related genes were successfully retrieved and included in the analysis (as shown in Table 1). Then, prognostic m6A-related lncRNAs were obtained by using the R survival package and the univariate Cox analysis. The confidence interval and the hazard ratio were calculated using the survival package and visualized by forest plots.
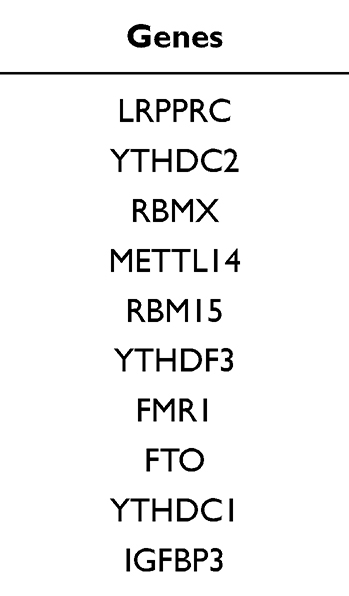 |
Table 1 List of 10 m6A-Related Genes |
Bioinformatics Analysis
Cytoscape 3.7.2 was employed to construct co-expression networks, while principal component analysis (PCA) was utilized to assess patients’ distribution based on risk scores. PCA plots were generated using the R package scatterplot3D. To develop and validate the nomogram, rms package in R version 4.0.3 was employed. Additionally, Sankey map was obtained using R package ggalluvial.
Prognostic Model for LUAD Based on m6ARLSig
By constructing a m6As-related mRNA-lncRNA coexpression network, 8 m6A-related lncRNAs were identified. Visualization of the coexpression networks was carried out using Cytoscape. Subsequently, through univariate analyses, prognostic m6A-related lncRNAs were identified and incorporated into a multivariate Cox regression analysis to establish risk scores. The risk score for each patient was calculated using the following formula: “risk score = Σ(coefficient(lncRNA1) × expression(lncRNA1)) + (coefficient(lncRNA2) × expression(lncRNA2)) +. + (coefficient(lncRNAn) × expression(lncRNAn))”. To assess relationship between survival and the high- and low-risk groups, linear regression analysis was utilized. Model accuracy was explored through metrics such as calibration curve, consistency index, and receiver operating characteristic (ROC) curves. To confirm independent prognostic value of risk score, demographic data were included in the multivariate Cox regression analysis. Finally, distribution of survival statuses was assessed based on different levels of risk scores.
M6ARLSig Model in Predicting the Response to Clinical Treatment
To measure the levels of immune cell infiltration in each LUAD sample, CIBERSORT tool based on the LM22 reference matrix https://cibersort.stanford.edu/) was utilized. Relationship between m6ARLSig score and immune checkpoint inhibitor (ICI) gene levels was evaluated using the ggstatsplot package in R. were presented through violin plots. Additionally, to compare IC50 of various antitumor drugs between groups.
Gene Set Enrichment Analysis (GSEA)
GSEA was conducted individually for different groups, using prognostic model. Enrichment analysis focused on predefined biological processes and pathways, considering them statistically significant if NOM P < 0.05 and false discovery rate (FDR) < 0.25. The reference files c5.go.v7.1.symbols.gmt and c2.cp.kegg.v7.1.symbols.gmt from the Molecular Signatures Database were specifically chosen for this analysis. The number of permutations was set to 1000 times.
Cell Line and Transfection
Normal human bronchial epithelial cells (16-HBE) and the non-small cell lung cancer line A549 were obtained from the Chinese Academy of Sciences Cell Bank (Shanghai, China). Both cell lines were maintained in Dulbecco’s Modified Eagle Medium (DMEM; Gibco, MA, USA) containing 10% fetal bovine serum (FBS), 100 U/mL penicillin, and 100 µg/mL streptomycin (Gibco) at 37 °C in a 5% CO2 humidified incubator. To generate a cisplatin-resistant A549 subline, parental A549 cells were exposed to escalating doses of cisplatin: starting at 0.2 µM for eight weeks, then increasing the concentration by 0.1 µM every two weeks until reaching 2 µM. The resultant resistant population was designated A549/DDP.
SiRNA and Transfections
The siRNAs targeting FAM83A-AS1 (siRNA#1 and siRNA#2) as well as the scrambled siRNA (siNC) were synthesized by RiboBio (Guangzhou, China).
A549 were transfected with FAM83A-AS1 siRNA or the corresponding negative control (NC) using the lipofectamine 2000 transfection kit (Invitrogen, CA, USA).
Quantitative Real-Time PCR (qRT-PCR)
The mRNA from cells were extracted using TRIZOL reagent (Invitrogen). qRT-PCR was performed according to previous methods.26
CCK-8 Assay
In short, following the transfection process, 5×10³ A549 cells were introduced into 96-well plates and cultured for 24, 48, and 72 hours under standard conditions. Subsequently, 10 µL of CCK-8 assay solution (Beyotime, Shanghai, China) was applied to each well and left for an additional 4 hours. The absorbance at 450 nm for each well was then measured.
Flow Cytometry
Cells were harvested and subjected to centrifugation at 12,000 × g for 5 minutes at room temperature. After discarding the supernatant, the cells were resuspended in PBS. Following the instructions of the AnnexinV-FITC cell apoptosis detection kit (Thermo), the cells were stained with Annexin-V-FITC and propidium iodide for 20 minutes at room temperature. Flow cytometry (BD Bioscience) was employed to assess both early/late apoptosis.
Transwell Invasion
Cell invasion was evaluated using a Transwell assay. Briefly, the upper surfaces of Transwell inserts (Corning, MA, USA) were coated with Matrigel (Sigma, MO, USA). Cells were suspended in serum-free medium at 1×10⁵ cells per well and added to the upper chamber, while the lower chamber contained complete growth medium. After 24 hours of incubation at 37 °C, cells that had migrated through the Matrigel and membrane were fixed in methanol and stained with 0.5% crystal violet. Invading cells were then quantified by counting stained cells under a light microscope.
Wound Healing
In short, 5 × 10⁵ cells were placed in 6-well plates. Once the cells reached full confluence, a wound was created by gently scratching with a 200-μL pipette tip. Subsequently, cells were subjected to a period of starvation and cultured for 24 hours. Images of the scratched areas at both 0 h and 24 h were captured using a microscope.
Statistical Analysis
All computational and statistical analyses were performed using R (version 4.0.3). Survival analysis was carried out using the Kaplan-Meier method. Differences between groups were assessed using the Kruskal–Wallis test, while clinical information was analyzed using either the Fisher’s exact test or Chi-squared test. The relationships between different parameters were evaluated using Pearson or Spearman correlation coefficients. The significant differences between different groups in vitro studies were evaluated using unpaired t-test. P < 0.05 was defined as statistically significant.
Results
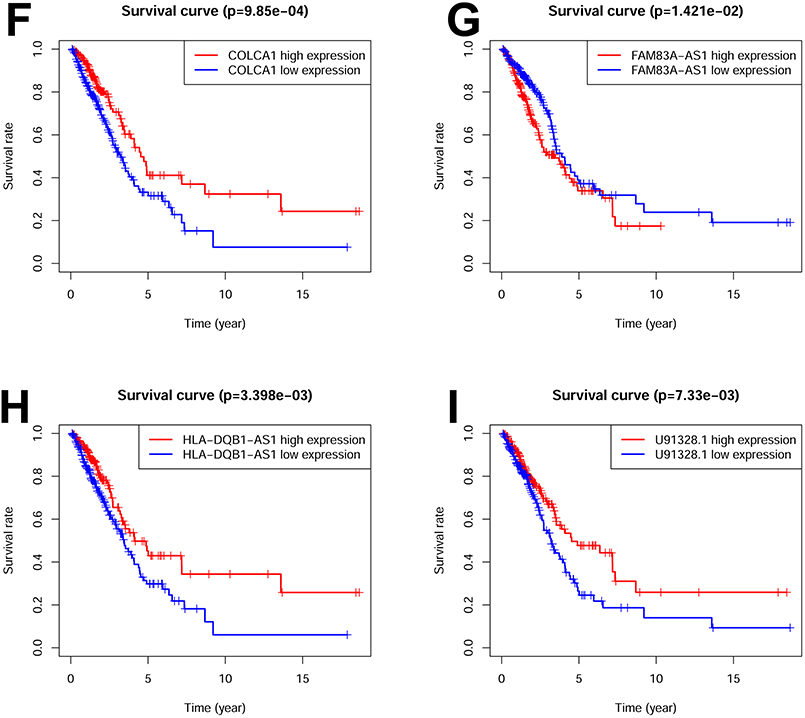
Extraction of LUAD-Associated m6A-Related lncRNAs
Firstly, we conducted a comprehensive screening of m6A-related genes. Subsequently, through Pearson correlation analysis, we successfully identified a specific set of m6A-related lncRNAs. Further analysis with univariate analysis unveiled significant correlation between eight m6A-related lncRNAs (AC026355.1, AC090559.1, AC124045.1, AL606489.1, COLCA1, FAM83A-AS1, HLA-DQB1-AS1, and U91328.1) levels and patient outcomes. The forest plot shows the hazard ratio with 95% confidence interval of these 8 m6A-related lncRNAs (Figure 1A). Specifically, six of these m6A-related lncRNAs exhibited favorable prognostic potential, while two lncRNAs were identified as poor prognostic markers (Figure 1B–I). Leveraging these eight m6A-related lncRNAs, we successfully established prognostic signature referred to m6ARLSig. Figure 1 Contiuned. Figure 1 Identification of m6A-related lncRNAs associated with LUAD. (A) The forest plot displays the hazard ratio (HR) with 95% confidence interval (CI) and p-values for the identified m6A-related lncRNAs using univariate Cox proportional hazards analysis. Among them, six lncRNAs were associated with a favorable prognosis, while two lncRNAs were associated with an unfavorable prognosis. Kaplan-Meier survival curves were generated for the eight identified m6A-related lncRNAs: (B) AC026355.1, (C) AC090559.1, (D) AC124045.1, (E) AL606489.1, (F) COLCA1, (G) FAM83A-AS1, (H) HLA-DQB1-AS1, and (I) U91328.1. *P*0.05 and **P<0.01.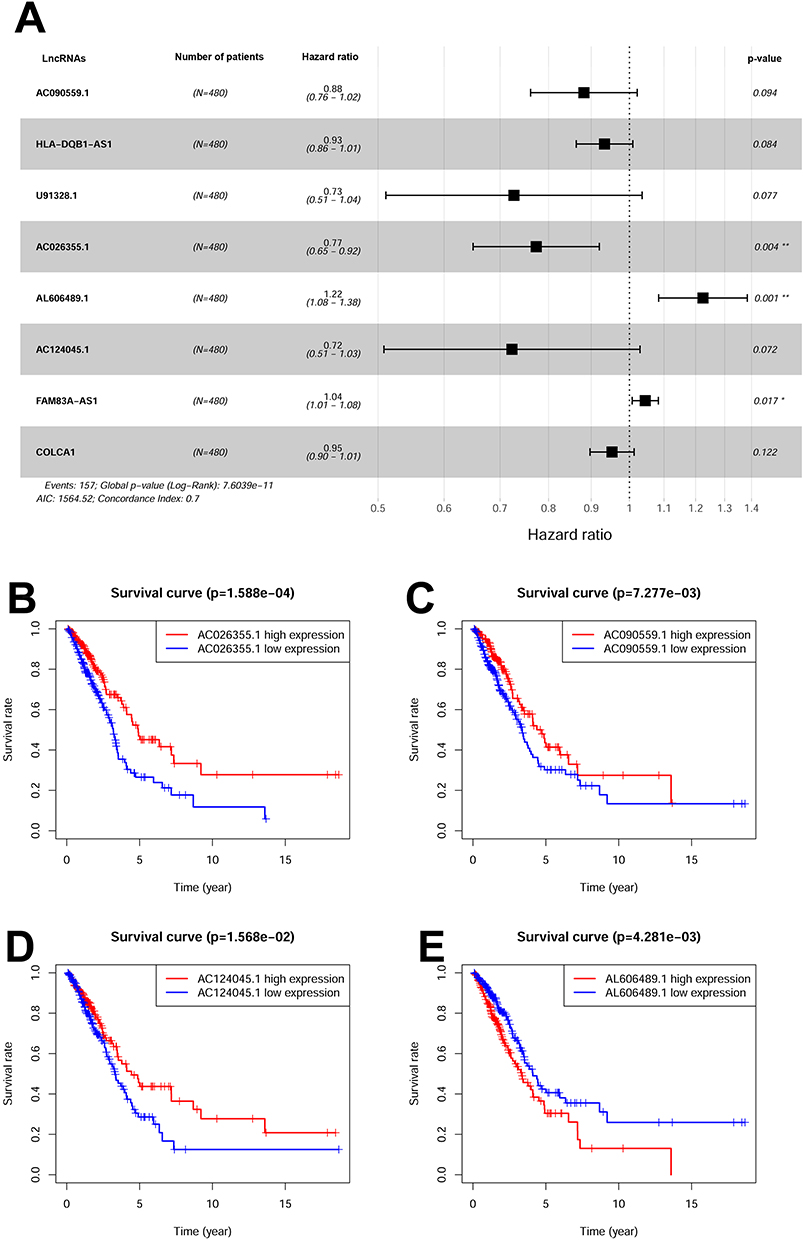
Network of Co-Expressed m6A-Related lncRNAs and Sankey Diagram Representation
Figure 2A presents correlations between levels of 8 m6A-related lncRNAs and m6A-related genes. Notably, among these lncRNAs, AL606489.1 and COLCA1 emerged as independent unfavorable prognostic characteristics for OS. Conversely, six lncRNAs (AC026355.1, AC090559.1, AC124045.1, AL606489.1, COLCA1, FAM83A-AS1, HLA-DQB1-AS1, and U91328.1) exhibited independent favorable prognostic characteristics for OS, as illustrated in Figure 2B.
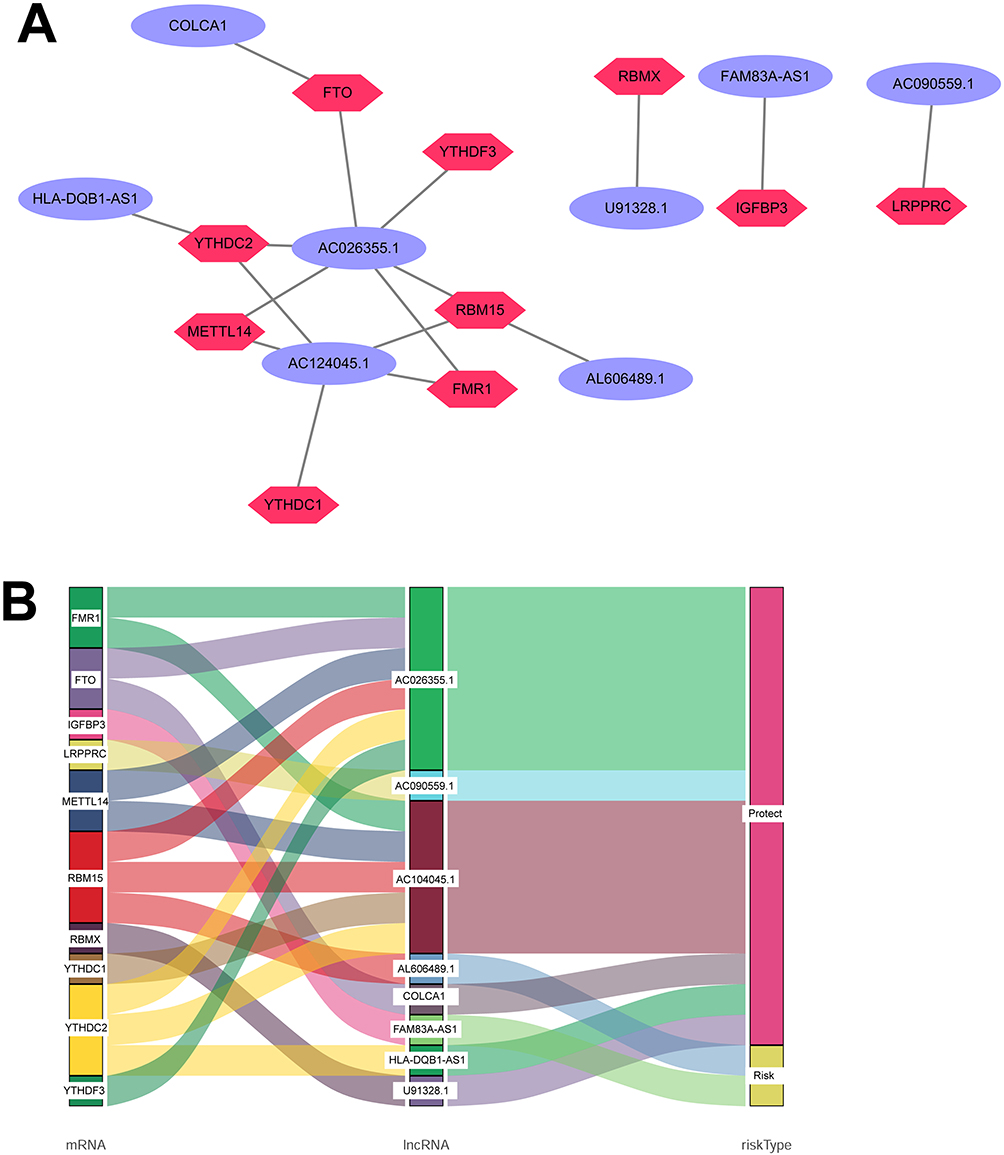 |
Figure 2 Coexpression network and Sankey diagram showcasing the relationship between m6A-related lncRNAs and risk type. (A) Coexpression network was constructed using Cytoscape, where m6A-related lncRNAs are represented by purple ellipses and mRNAs by dark pink diamonds. (B) Sankey diagram visually represents the connections between mRNAs, m6A-related lncRNAs, and risk type. |
Assessment of Prognostic Significance of m6ARLSig
Risk score was constructed using formula below: “-0.2571×AC026355.1 + (−0.1255×AC090559.1) + (−0.3238×AC124045.1) + (0.2026×AL606489.1) + (−0.04799×COLCA1) + (0.04366×FAM83A-AS1) + (−0.06873×HLA-DQB1-AS1) +. (−0.3183×U91328.1)”. Based on personalized levels of m6ARLSig, risk score was calculated in each patient. Stratified patients were classified into high-risk (n = 240) and low-risk groups (n = 240) by median risk score. Kaplan-Meier survival curves exhibited disparity in OS between high-m6ARLSig and low-m6ARLSig groups for LUAD patients (Figure 3A), indicating the effective predictive capacity of this newly developed signature. Figure 3B–D presents the distribution of expression levels of the 8 m6A-related lncRNAs, survival status, clinicopathological factors and risk scores.
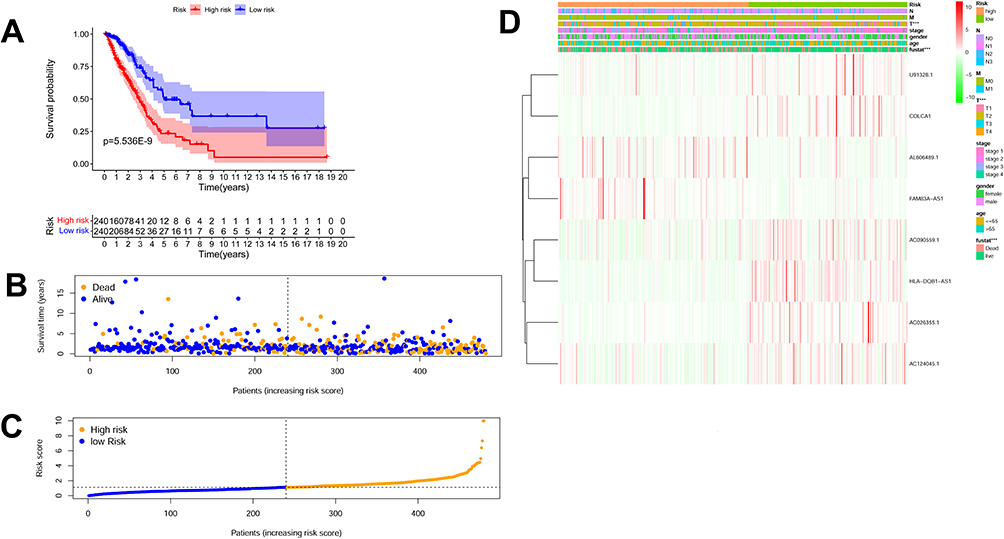 |
Figure 3 The prognostic significance of the risk model that incorporates eight m6A-related lncRNAs. (A) Kaplan-Meier curve depicts the overall survival (OS) of the high-risk and low-risk cohorts stratified by m6ARLSig (P = 5.536E-9). (B) Scatterplot displays the survival status of each sample, with blue dots representing survival and yellow dots representing death. (C) Risk curve based on the risk score assigned to each sample, where yellow indicates a high risk and blue indicates a low risk. (D) Heatmap illustrating the distribution of the eight m6A-related lncRNAs and clinicopathological parameters among the high-risk and low-risk cohorts within the TCGA-LUAD cohort. ***P<0.001. |
Additionally, we conducted both univariate/multivariate analysis to assess independent association of m6ARLSig with OS in LUAD patients. Univariate analysis revealed a HR of 1.474 (95% CI = 1.322–1.644), while in multivariate analysis (Figure 4A), HR was 1.502 (CI = 1.319–1.710) (Figure 4B). Receiver operating characteristic analysis produced AUCs of 0.781, 0.702, and 0.717 at one, three, and five years, respectively (Figure 4C). We then applied principal component analysis to the full transcriptome, the subset of m6A-associated lncRNAs, and the m6ARLSig. As illustrated in Figure 4D and E, neither the entire gene expression profile nor the panel of m⁶A-related lncRNAs alone could segregate patients by risk. In contrast, the m6ARLSig clearly stratified individuals into discrete high- and low-risk clusters, further validating the model’s precision (Figure 4F).
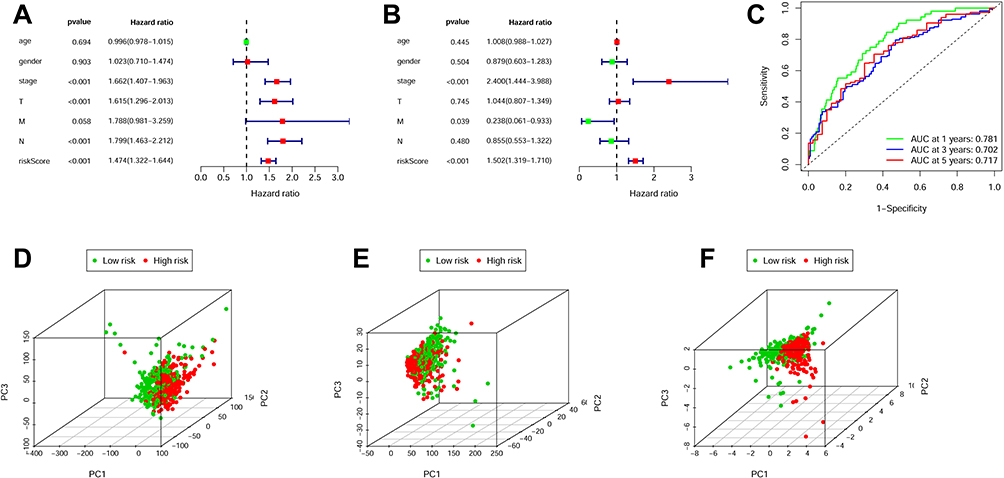 |
Figure 4 Independent prognostic value of m6ARLSig for overall survival. (A and B) Both univariate (A) and multivariate (B) Cox regression analyses were conducted to examine the associations between clinical parameters, including m6ARLSig, and overall survival (OS). (C) time-dependent ROC curves were generated to evaluate the performance of OS prediction at 1, 3, and 5 years. (D–F) PCA plots illustrate the differentiation between low-risk and high-risk groups based on (D) the entire genome, (E) m6A-related lncRNAs, and (F) the risk model incorporating eight m6A-related lncRNAs. |
Correlations Between m6ARLSig and Clinicopathological Parameters
To further investigate m6ARLSig’s impact on LUAD progression, we examined its associations with clinicopathological parameters. The results demonstrated significant correlations between pathologic stage and risk score (Figure 5). Specifically, risk score was notably higher for II–IV stages compared to I stage (Figure 5A). It was elevated in patients with T2-T4 tumors compared to those with T1 tumors (Figure 5B). Patients with nodal metastases exhibited significantly elevated risk indices compared to those without lymph node involvement (Figure 5C). Importantly, individuals classified as high-risk experienced markedly reduced overall survival relative to low-risk patients (Figure 5D).
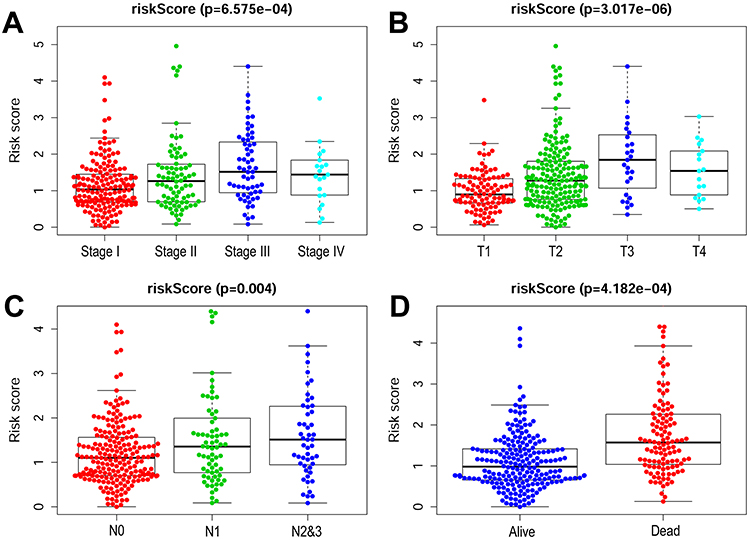 |
Figure 5 Association between M6ARLSig and clinicopathological features of patients with LUAD. (A) Distribution of M6ARLSig in cohorts according to tumor stage. (B) Distribution of M6ARLSig in cohorts according to tumor size. (C) M6ARLSig is depicted in cohorts according to lymph node metastasis status. (D) Distribution of m6ARLSig in cohorts according to survival outcome. “T” refers to tumor size and “N” represents lymph node metastasis. |
Development of the Predictive Nomogram Incorporating m6ARLSig and Clinicopathological Parameters
A practical nomogram to assess survival probabilities of LUAD patients by incorporating m6ARLSig and clinicopathological parameters is presented (Figure 6A). Nomogram accurately predicted mortality rates compared to observed data (Figure 6B–D). Additionally, ROC curves were constructed to evaluate 5-year OS, and the clinical prognostic nomogram exhibited a superior AUC value of 0.782, surpassing other clinicopathological parameters (Figure 6E).
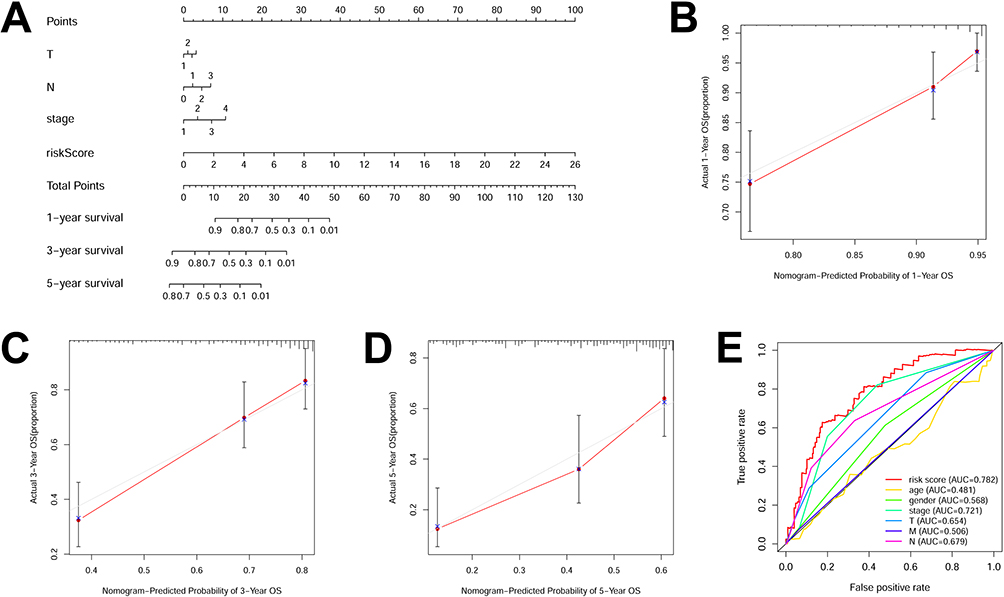 |
Figure 6 Nomogram designed to forecast survival rates. (A) The nomogram predicts survival for 1, 3, and 5 years. The accuracy of nomogram’s predictions for 1- (B), 3-(C), and 5-year survival (D) are depicted in calibration curves, respectively. (E) ROC curve analysis illustrates the ability of sex, risk score, age, T stage, stage, M stage, and N stage to predict 5-year OS. The grey line indicates the ideal reference line where predicted probabilities would match the observed survival rates. The solid red line with red dots and blue cross represents the performance of the constructed nomogram, and the closer of the red line to grey line indicates better prediction. |
GSEA Enrichment Analysis
GSEA analysis was employed for functional annotation purposes. LUAD samples with high-risk scores exhibited enrichment in GO terms such as “activation of mitotic metaphase plate congression”, “mitotic nuclear division”, “organelle fission”, “chromosome centromeric region”, and “condensed chromosome centromeric region” (Figure 7A). Conversely, LUAD samples with low-risk scores displayed enrichment in “9plus2 motile cilium”, “extracellular transport”, “negative regulation of B cell mediated immunity”, “negative regulation of TORC1 signaling”, and “Golgi cis sisterna” (Figure 7A). Furthermore, high-risk cohorts demonstrated enrichment in “cell cycle”, “homologous recombination”, “oocyte meiosis”, “p53 signaling pathway”, and “proteasome signaling” (Figure 7B). Low-risk cohorts exhibited enrichment in “asthma”, “autoimmune thyroid disease”, “graft verse host disease”, “hematopoietic cell lineage”, and “intestinal immune network for IgA production” (Figure 7B).
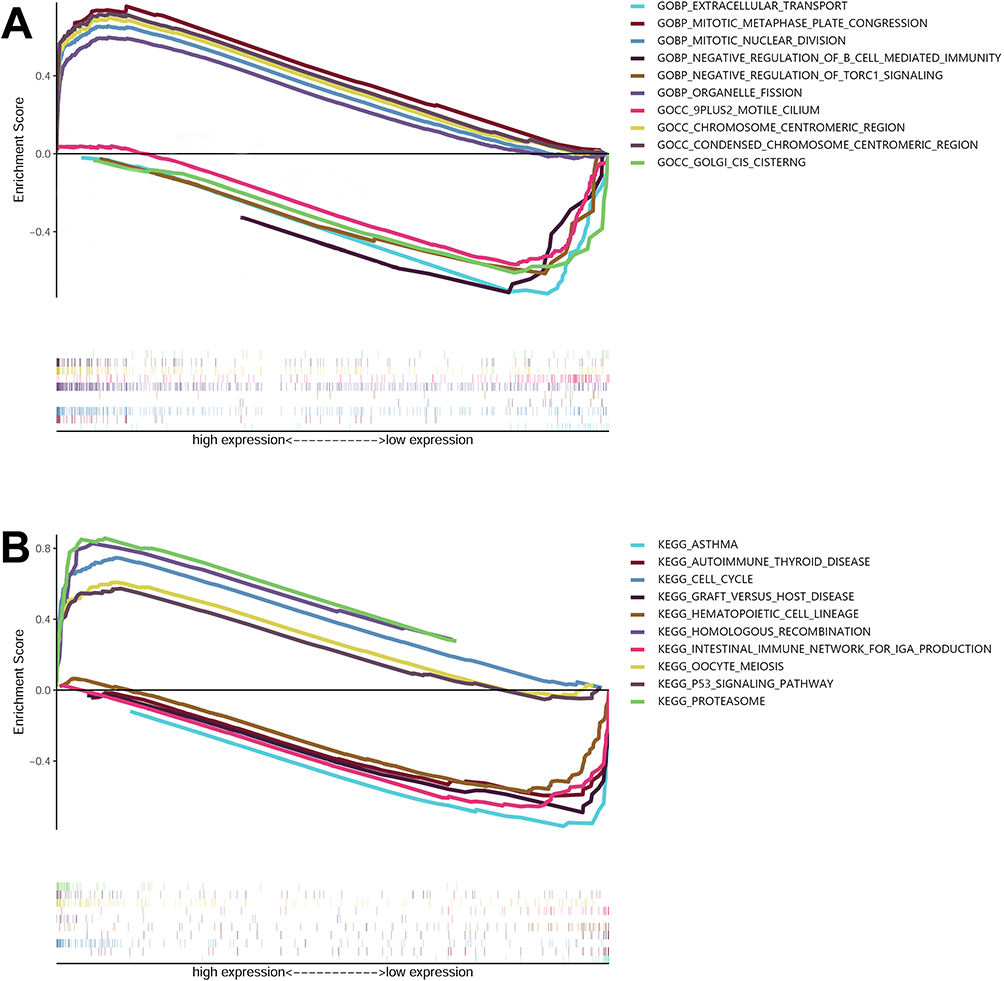 |
Figure 7 Enrichment plots obtained from gene set enrichment analysis (GSEA). The GSEA results indicate the contrasting enrichment patterns of genes in Gene Ontology (GO) associated with m6A-related lncRNAs, as depicted in (A). Additionally, (B) GSEA results show the distinct enrichment of genes in the Kyoto Encyclopedia of Genes and Genomes (KEGG) associated with m6A-related lncRNAs. |
Contrasts in the Immunotherapy Response Between High- and Low-Risk Groups
Comparison of 22 immune cell types between two groups was performed. Figure S1 illustrates the variations in immune cell infiltration among LUAD patients from TCGA, indicating an inherent characteristic that reflects individual variances. Immune cell proportion exhibited differences between two groups (Figure S1A and S1B). Notably, LUAD patients in high-risk cohorts demonstrated higher ratios of activated memory CD4 T cells and neutrophils (Figure S2A). Conversely, LUAD patients from low-risk group exhibited lower ratios of CD8 T cells, resting memory CD4 T cells, resting mast cells and monocytes (Figure S2A).
Interestingly, low-risk cohorts exhibited higher levels of 25 immune checkpoint genes, including TNFRSF4, ADORA2A, TNFSF15, CD200R1, CD41, HAVCR2, BTLA, BTNL2, ICOS, CD80, TNFRSF25, CTLA4, IOD2, CD86, HHLA2, CS27, CD40LG, TNFSF18, LAIR1, TNFSF14, TNFRSF14, CD48, LGALS9, CD28, CD244, TIGIT, CD40, and CD160. Conversely, CD276 exhibited higher expression in high-risk cohorts (Figure S2B). Furthermore, low-risk cohorts had higher estimate score, immune score, and stromal score than that from high-risk ones (Figure S3A-S3C).
Response to Targeted Therapy and Chemotherapy Between Two Groups
It was observed that low-risk-score patients displayed heightened sensitivity to chemotherapeutics including docetaxel, doxorubicin, and paclitaxel (Figure S4). Additionally, low-risk-score patients demonstrated enhanced sensitivity to targeted therapeutics like gemcitabine, erlotinib, and sorafenib (Figure S4), indicating that m6ARLSig holds potential as a predictive marker for chemosensitivity. These findings also provide an explanation for unfavorable prognosis observed in high-risk-score patients, as they are likely to exhibit greater resistance to targeted therapy and chemotherapy.
Effects of FAM83A-AS1 Knockdown on in vitro Functions of Lung Cancer Cells
Figure 8A–C showed that COLCA1 and HLA-DOB1-AS1 were down-regulated, FAM83A-AS1 was up-regulated in A549 cells compared to 16-HBE cells. Furthermore, FAM83A-AS1 was chosen for further functional studies. Transfection with FAM83A-AS1 siRNAs reduced FAM83A-AS1 expression in A549 cells compared to siNC transfection (Figure 8D). Functional studies showed that FAM83A-AS1 knockdown repressed A549 proliferation, invasion, migration, EMT, but increased apoptosis (Figure 8E–I).
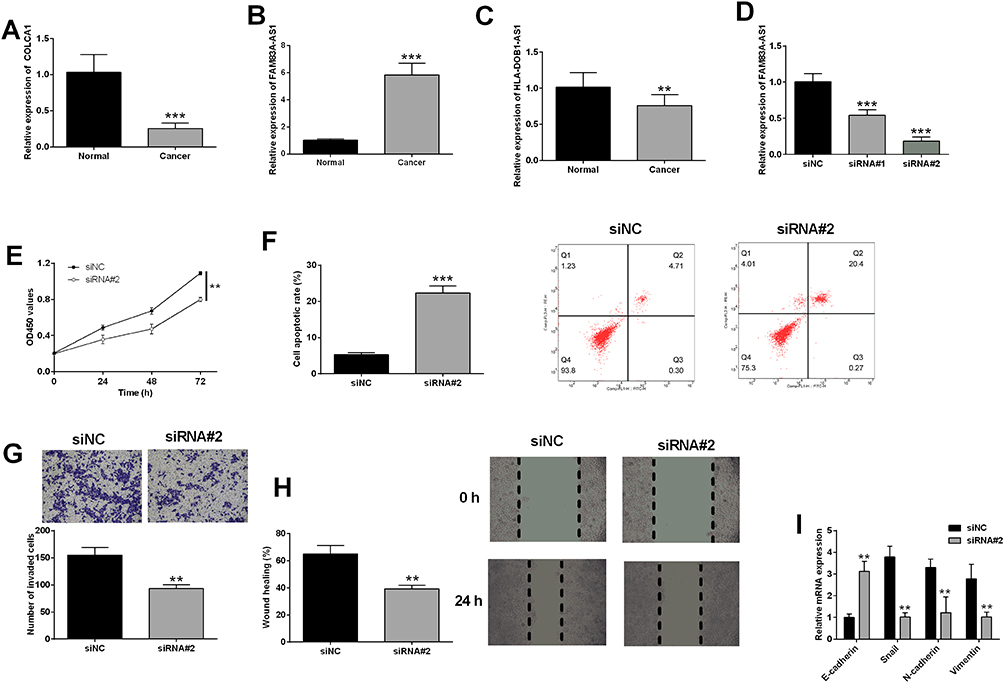 |
Figure 8 Effects of FAM83A-AS1 knockdown on in vitro functions of lung cancer cells. The expression of (A) COLCA1, (B) FAM83A-AS1 and (C) HLA-DOB1-AS1 in normal and cancerous lung cells were determined by qRT-PCR. (D) A549 cells were transfected with different siRNAs for FAM83A-AS1 or control siRNA, and FAM83A-AS1 expression in A549 cells was determined by qRT-PCR. (E–I) A549 cells were transfected with siRNA for FAM83A-AS1 (siRNA#2) or control siRNA (siNC), cell proliferation, apoptosis, invasion, migration and EMT were evaluated by CCK-8, flow cytometry, Tanswell invasion, wound healing and qRT-PCR assays, respectively. N = 3. **P<0.01 and ***P<0.001 compared to respective controls. |
Effects of FAM83A-AS1 Knockdown on Drug Resistance of Lung Cancer Cells
Figures 9A and B reveal that the IC50 of cisplatin are substantially elevated in the A549/DDP subline compared to parental A549 cells. Furthermore, FAM83A-AS1 expression is markedly increased in A549/DDP cells relative to A549 controls (Figure 9C). Targeted silencing of FAM83A-AS1 via siRNA significantly lowers the cisplatin IC50 in A549/DDP cells versus the siNC group (Figure 9D and E). In parallel, FAM83A-AS1 knockdown diminishes the mRNA levels of the drug efflux transporters MDR1 and MRP1 in A549/DDP cells compared to controls (Figures 9F and G).
 |
Figure 9 Effects of FAM83A-AS1 knockdown on drug resistance of lung cancer cells. (A) Cell viability of A549 and A549/DDP cells treated with various concentrations of cisplatin were determined by CCK-8 assay. (B) IC50 values of cisplatin for A549 and A549/DDP cells. (C) FAM83A-AS1 expression in A549 and A549/DDP cells. (D) Cell viability of A549/DDP cells transfected with siNC or siRNA#2 were determined by CCK-8 assay. (E) IC50 values of cisplatin for A549/DDP cells transfected with siNC or siRNA#2. (F) MDR1 and (G) MRP1 mRNA expression levels of A549/DDP cells transfected with siNC or siRNA#2 were determined by qRT-PCR. N = 3. *P < 0.05 and **P<0.01 compared to respective controls. |
Discussion
In this study, we identified eight m6A-related lncRNAs significantly associated with overall survival in LUAD using TCGA gene expression data. Six lncRNAs were linked to favorable prognosis and two to poor prognosis. These were integrated into a prognostic signature (m6ARLSig), which effectively stratified patients into high- and low-risk groups with distinct survival outcomes. Co-expression analysis revealed associations between the lncRNAs and m6A regulators. Multivariate analysis confirmed m6ARLSig as an independent prognostic factor, and a nomogram incorporating m6ARLSig and clinical parameters was constructed for individualized survival prediction. Additionally, the high-risk group exhibited altered immune cell infiltration, differential expression of immune checkpoints, and reduced sensitivity to chemotherapeutic and targeted agents, suggesting m6ARLSig may also inform immunotherapy strategies. Overall, our findings support m6ARLSig as a promising biomarker for prognostication and personalized treatment in LUAD.
Several of the lncRNAs included in our m6ARLSig model have previously demonstrated prognostic significance in LUAD and other cancers. AC026355.1 has been reported as part of immune-, ferroptosis-, and hypoxia-related signatures associated with LUAD prognosis.27,28 AC090559.1 has been linked to pyroptosis-, autophagy-, and necroptosis-related prognostic models in LUAD and osteosarcoma.29,30 AC124045.1 was included in a ferroptosis-related prognostic signature for LUAD.31 AL606489.1 has been featured in autophagy- and necroptosis-related models and showed sex-specific prognostic value in LUAD.32,33 Regarding FAM83A-AS1, it promoted LUAD progression by enhancing FAM83A stability.34 FAM83A-AS1 was identified as a necroptosis-related and pyroptosis-related lncRNA predictive signature for LUAD patients OS.35,36 In terms of HLA-DQB1-AS1, HLA-DQB1-AS1 is reported to promote cancer progression in various types of cancers.32,37,38 The role of U91328.1 has not been reported in LUAD, although Zhou et al demonstrated its association with an m6A-related lncRNA signature for colon adenocarcinoma patients.39 In our study, based on personalized m6ARLSig levels, we calculated risk scores and divided patients into high- and low-risk cohorts. Difference in OS between these cohorts, confirming prognostic value of the m6ARLSig. Multivariate analysis confirmed its independent prognostic value. Additionally, a nomogram incorporating m6ARLSig and clinicopathological parameters was constructed, providing a clinically adaptable tool for survival probability estimation. Notably, our findings align with and expand upon recent evidence from multiple studies. Zhang et al, constructed a regulatory network of m6A enzymes, lncRNAs, and mRNAs, identifying hub genes such as SH3PXD2A-AS1 and MAD2L1 that overlapped with our enriched cell cycle and mitotic progression pathways in the high-risk cohort.40 Shen et al, provided further insight into m6A-related lncRNAs and their role within the TIME, revealing distinct immune and pathway features across molecular subtypes.41 Liu et al, emphasized the utility of integrating transcriptomic and proteomic data across populations to construct robust survival models, highlighting the relevance of hub genes.42 Together, these studies support the robustness of our m6ARLSig model and underscore the biological significance of cell cycle regulation and immune microenvironment modulation, in LUAD prognosis.
The GSEA enrichment analysis revealed distinct biological processes and pathways between high- and low-risk LUAD cohorts, offering insights into potential mechanisms underlying disease progression. In high-risk patients, enrichment in pathways such as “cell cycle”, “homologous recombination”, and the “p53 signaling pathway” suggests a dysregulation of genomic stability and proliferative control, which are hallmarks of tumor aggressiveness. The concurrent activation of mitotic processes and proteasome signaling further supports a hyperproliferative phenotype that may contribute to rapid tumor progression. In contrast, low-risk LUAD samples showed enrichment in immune-related pathways, including “intestinal immune network for IgA production” and “negative regulation of B cell mediated immunity”, indicating a more active or regulated immune microenvironment potentially associated with better prognosis. The suppression of TORC1 signaling in these patients may also reflect lower metabolic and proliferative demands. Together, these findings highlight distinct mechanistic landscapes in LUAD and underscore the potential of these pathways as therapeutic targets or prognostic indicators.
The m6A modification is key in the pathological processes associated with cancer development.8 LncRNAs can regulate the expression of m6A regulators. For example, in, LINC00022 overexpression promoted esophageal squamous cell carcinoma progression via targeting FTO.43 In gastric cancer, the oncogenic THAP7-AS1 is activated transcriptionally by SP1 and stabilized through m6A modification by METTL3.44 The key achievement of this research lies in establishing the association between m6ARLSig and TME. Importantly, intricate interaction between tumor cells and TME not only plays a crucial role in tumor development but also significantly impacts OS and immunotherapeutic efficacy.45,46 Our results revealed that m6ARLSig primarily operates within immune-related pathways. High-risk-score patients exhibited higher levels of activated memory CD4 T cells, thus confirming the involvement of m6ARLSig in regulating tumor immune infiltration. Given the connection we observed between m6ARLSig and immune infiltration in LUAD, targeting m6ARLSig could potentially serve as a strategy for combined treatments involving ICIs.
Combining immune checkpoint blockade with immunotherapies shows promise as a strategy for treating diverse cancer types. It has been observed that activated tumor immune microenvironment is associated with positive responses to ICI intervention.47 Interestingly, low-risk group exhibited high expression of CTLA-4, indicating that patients in this group could potentially experience enhanced benefits from anti-CTLA-4 immunotherapy. These findings provide valuable new insights into tumor immunotherapy.
There are several limitations in the present study. Firstly, conducting functional experiments would be necessary to gain better understanding of molecular mechanisms underlying m6ARLSig. Secondly, our study is retrospective in design and relies solely on publicly available RNA-seq and clinical data from TCGA. While TCGA provides a valuable resource for hypothesis generation, its data may not fully represent the heterogeneity of real-world patient populations or clinical treatment settings. Thirdly, we relied on a single data source for our analysis. Additionally, due to incomplete data availability, well-established prognostic factors like tumor markers and chemotherapy data were not included in the nomogram. Therefore, further studies are required to validate m6ARLSig prognostic significance.
Conclusion
In conclusion, we developed an m6ASig for LUAD that demonstrates prognostic predictive capabilities. Furthermore, we successfully formulated a reliable nomogram incorporating the m6ASig. Importantly, our study suggests that the m6ARLSig identified may be linked to immune infiltration and potentially impact tumor immunotherapy effectiveness. Furthermore, FAM831-AS1 may play oncogenic role in LUAD.
Data Sharing Statement
All the data are available upon request from corresponding author.
Ethical Statement
In accordance with Item 1 and Item 2 of Article 32 of the Measures for Ethical Review of Life Science and Medical Research Involving Human Subjects dated February 18, 2023, China, this study is exempt from ethical approval.
Author Contributions
All authors made a significant contribution to the work reported, whether that is in the conception, study design, execution, acquisition of data, analysis and interpretation, or in all these areas; took part in drafting, revising or critically reviewing the article; gave final approval of the version to be published; have agreed on the journal to which the article has been submitted; and agree to be accountable for all aspects of the work.
Funding
This study was supported by Shenzhen Science and Technology Research and Development Fund (JCYJ20220530115203008), and Research Fund for the President of the Hospital of Southern University of Science and Technology, High-level Project and Cultivation Project (Class A) (2020-A2).
Disclosure
The authors report no conflicts of interest in this work.
References
1. Oudkerk M, Liu S, Heuvelmans MA, Walter JE, Field JK. Lung cancer LDCT screening and mortality reduction - evidence, pitfalls and future perspectives. Nat Rev Clin Oncol. 2021;18(3):135–151.
2. Vargas AJ, Harris CC. Biomarker development in the precision medicine era: lung cancer as a case study. Nat Rev Cancer. 2016;16(8):525–537. doi:10.1038/nrc.2016.56
3. Keith RL, Miller YE. Lung cancer chemoprevention: current status and future prospects. Nat Rev Clin Oncol. 2013;10(6):334–343. doi:10.1038/nrclinonc.2013.64
4. Quintanal-Villalonga Á, Chan JM, Yu HA, et al. Lineage plasticity in cancer: a shared pathway of therapeutic resistance. Nat Rev Clin Oncol. 2020;17(6):360–371. doi:10.1038/s41571-020-0340-z
5. Wang Y, Su X, Zhao M, et al. Importance of N(6)-methyladenosine RNA modification in lung cancer (Review). Mol Clin Oncol. 2021;14(6):128. doi:10.3892/mco.2021.2290
6. He PC, He C. m6A RNA methylation: from mechanisms to therapeutic potential. EMBO J. 2021;40(3):e105977. doi:10.15252/embj.2020105977
7. Xu X, Huang J, Ocansey DKW, et al. The emerging clinical application of m6A RNA modification in inflammatory bowel disease and its associated colorectal cancer. J Inflamm Res. 2021;14:3289–3306. doi:10.2147/JIR.S320449
8. Jiang X, Liu B, Nie Z, et al. The role of m6A modification in the biological functions and diseases. Signal Transduction Targeted Ther. 2021;6(1):74. doi:10.1038/s41392-020-00450-x
9. Huang W, Chen T-Q, Fang K, Zeng Z-C, Ye H, Chen Y-Q. N6-methyladenosine methyltransferases: functions, regulation, and clinical potential. J Hematol Oncol. 2021;14(1):117. doi:10.1186/s13045-021-01129-8
10. Hu Y, Wang S, Liu J, et al. New sights in cancer: component and function of N6-methyladenosine modification. Biomed Pharmacother. 2020;122:109694. doi:10.1016/j.biopha.2019.109694
11. Li F, Wang H, Huang H, Zhang L, Wang D, Wan Y. m6A RNA methylation regulators participate in the malignant progression and have clinical prognostic value in lung adenocarcinoma. Front Genetics. 2020;11:994. doi:10.3389/fgene.2020.00994
12. Hinshaw DC, Shevde LA. The tumor microenvironment innately modulates cancer progression. Cancer Res. 2019;79(18):4557–4566. doi:10.1158/0008-5472.CAN-18-3962
13. Vitale I, Manic G, Coussens LM, Kroemer G, Galluzzi L. Macrophages and metabolism in the tumor microenvironment. Cell Metab. 2019;30(1):36–50. doi:10.1016/j.cmet.2019.06.001
14. Xiao Y, Yu D. Tumor microenvironment as a therapeutic target in cancer. Pharmacol Ther. 2021;221:107753. doi:10.1016/j.pharmthera.2020.107753
15. Noy R, Pollard JW. Tumor-associated macrophages: from mechanisms to therapy. Immunity. 2014;41(1):49–61. doi:10.1016/j.immuni.2014.06.010
16. Hombach S, Kretz M. Non-coding RNAs: classification, biology and functioning. Adv Exp Med Biol. 2016;937:3–17.
17. Mercer TR, Dinger ME, Mattick JS. Long non-coding RNAs: insights into functions. Nat Rev Genet. 2009;10(3):155–159. doi:10.1038/nrg2521
18. Beermann J, Piccoli MT, Viereck J, Thum T. Non-coding RNAs in development and disease: background, mechanisms, and therapeutic approaches. Physiol Rev. 2016;96(4):1297–1325. doi:10.1152/physrev.00041.2015
19. Sangeeth A, Malleswarapu M, Mishra A, Gutti RK. Long non-coding RNA therapeutics: recent advances and challenges. Curr Drug Targets. 2022;23(16):1457–1464. doi:10.2174/1389450123666220919122520
20. Chen Y, Li Z, Chen X, Zhang S. Long non-coding RNAs: from disease code to drug role. Acta pharmaceutica Sinica B. 2021;11(2):340–354. doi:10.1016/j.apsb.2020.10.001
21. Chen Z, Lei T, Chen X, et al. Long non-coding RNA in lung cancer. Int J Clin Chem. 2020;504:190–200. doi:10.1016/j.cca.2019.11.031
22. Teng PC, Liang Y, Yarmishyn AA, et al. RNA modifications and epigenetics in modulation of lung cancer and pulmonary diseases. Int J Mol Sci. 2021;22(19):10592. doi:10.3390/ijms221910592
23. Dai S, Liu T, Liu YY, et al. Long non-coding RNAs in lung cancer: the role in tumor microenvironment. Front Cell Dev Biol. 2021;9:795874. doi:10.3389/fcell.2021.795874
24. Zhang M, Zhang J, Liu Y. Comprehensive analysis of molecular features, prognostic values, and immune landscape association of m6A-regulated immune-related lncRNAs in smoking-associated lung squamous cell carcinoma. Front Genet. 2022;13:887477. doi:10.3389/fgene.2022.887477
25. Zheng J, Zhao Z, Wan J, et al. N-6 methylation-related lncRNA is potential signature in lung adenocarcinoma and influences tumor microenvironment. J Clin Lab Anal. 2021;35(11):e23951. doi:10.1002/jcla.23951
26. Chen Z, Hu Z, Sui Q, et al. LncRNA FAM83A-AS1 facilitates tumor proliferation and the migration via the HIF-1α/ glycolysis axis in lung adenocarcinoma. Int J Biol Sci. 2022;18(2):522–535. doi:10.7150/ijbs.67556
27. Li JP, Li R, Liu X, et al. A seven immune-related lncRNAs model to increase the predicted value of lung adenocarcinoma. Front Oncol. 2020;10:560779. doi:10.3389/fonc.2020.560779
28. Guo Y, Qu Z, Li D, et al. Identification of a prognostic ferroptosis-related lncRNA signature in the tumor microenvironment of lung adenocarcinoma. Cell Death Discovery. 2021;7(1):190. doi:10.1038/s41420-021-00576-z
29. Liu J, Liu Q, Shen H, et al. Identification and validation of a three pyroptosis-related lncRNA signature for prognosis prediction in lung adenocarcinoma. Front Genetics. 2022;13:838624. doi:10.3389/fgene.2022.838624
30. Wu L, Wen Z, Song Y, Wang L. A novel autophagy-related lncRNA survival model for lung adenocarcinoma. J Cell Mol Med. 2021;25(12):5681–5690. doi:10.1111/jcmm.16582
31. Zheng Z, Zhang Q, Wu W, et al. Identification and validation of a ferroptosis-related long non-coding RNA signature for predicting the outcome of lung adenocarcinoma. Front Genetics. 2021;12:690509. doi:10.3389/fgene.2021.690509
32. Liu B, Yang S. A five autophagy-related long non-coding RNA prognostic model for patients with lung adenocarcinoma. Int J Gene Med. 2021;14:7145–7158. doi:10.2147/IJGM.S334601
33. Liang J, Jin W, Xu H. An efficient five-lncRNA signature for lung adenocarcinoma prognosis, with AL606489.1 showing sexual dimorphism. Front Genet. 2022;13:1052092. doi:10.3389/fgene.2022.1052092
34. Wang W, Zhao Z, Xu C, et al. LncRNA FAM83A-AS1 promotes lung adenocarcinoma progression by enhancing the pre-mRNA stability of FAM83A. Thoracic Cancer. 2021;12(10):1495–1502. doi:10.1111/1759-7714.13928
35. Song J, Sun Y, Cao H, et al. A novel pyroptosis-related lncRNA signature for prognostic prediction in patients with lung adenocarcinoma. Bioengineered. 2021;12(1):5932–5949. doi:10.1080/21655979.2021.1972078
36. Lu Y, Luo X, Wang Q, et al. A novel necroptosis-related lncRNA signature predicts the prognosis of lung adenocarcinoma. Front Genetics. 2022;13:862741. doi:10.3389/fgene.2022.862741
37. Ding Y, Li T, Li M, et al. A novel autophagy-related lncRNA gene signature to improve the prognosis of patients with melanoma. Biomed Res Int. 2021;2021(1):8848227. doi:10.1155/2021/8848227
38. Long J, Liu L, Zhou X, Lu X, Qin L. HLA-DQB1-AS1 promotes cell proliferation, inhibits apoptosis, and binds with ZRANB2 protein in hepatocellular carcinoma. J Oncol. 2022;2022:7130634. doi:10.1155/2022/7130634
39. Zhou SZ, Pan YL, Deng QC, et al. A prognostic signature for colon adenocarcinoma patients based on m6A-related lncRNAs. J Oncol. 2023;2023:7797710. doi:10.1155/2023/7797710
40. Zhang J, Bai S, Yan Y, et al. Construction of lncRNA-m6A gene-mRNA regulatory network to identify m6A-related lncRNAs associated with the progression of lung adenocarcinoma. BMC Pulm Med. 2023;23(1):284. doi:10.1186/s12890-023-02545-x
41. Shen Y, Hou N, Han F, Chen B, Shi J, Sun X. Comprehensive analysis of tumor immune microenvironment and prognosis of m6A-related IncRNAs in lung adenocarcinoma. Crit Rev Eukaryot Gene Expr. 2022;32(5):77–91. doi:10.1615/CritRevEukaryotGeneExpr.2022042417
42. Liu Y, Li Z, Meng Q, et al. Identification of the consistently differential expressed hub mRNAs and proteins in lung adenocarcinoma and construction of the prognostic signature: a multidimensional analysis. Int J Surg. 2024;110(2):1052–1067. doi:10.1097/JS9.0000000000000943
43. Cui Y, Zhang C, Ma S, et al. RNA m6A demethylase FTO-mediated epigenetic up-regulation of LINC00022 promotes tumorigenesis in esophageal squamous cell carcinoma. J Exp Clin Cancer Res. 2021;40(1):294. doi:10.1186/s13046-021-02096-1
44. Liu H-T, Zou Y-X, Zhu W-J, et al. lncRNA THAP7-AS1, transcriptionally activated by SP1 and post-transcriptionally stabilized by METTL3-mediated m6A modification, exerts oncogenic properties by improving CUL4B entry into the nucleus. Cell Death Differ. 2022;29(3):627–641. doi:10.1038/s41418-021-00879-9
45. Rameshbabu S, Labadie BW, Argulian A, Patnaik A. Targeting Innate Immunity in Cancer Therapy. Vaccines. 2021;9(2):138. doi:10.3390/vaccines9020138
46. Sui H, Dongye S, Liu X, et al. Immunotherapy of targeting MDSCs in tumor microenvironment. Front Immunol. 2022;13:990463. doi:10.3389/fimmu.2022.990463
47. Petitprez F, Meylan M, de Reyniès A, Sautès-Fridman C, Fridman WH. The tumor microenvironment in the response to immune checkpoint blockade therapies. Front Immunol. 2020;11:784. doi:10.3389/fimmu.2020.00784
 © 2025 The Author(s). This work is published and licensed by Dove Medical Press Limited. The
full terms of this license are available at https://www.dovepress.com/terms
and incorporate the Creative Commons Attribution
- Non Commercial (unported, 4.0) License.
By accessing the work you hereby accept the Terms. Non-commercial uses of the work are permitted
without any further permission from Dove Medical Press Limited, provided the work is properly
attributed. For permission for commercial use of this work, please see paragraphs 4.2 and 5 of our Terms.
© 2025 The Author(s). This work is published and licensed by Dove Medical Press Limited. The
full terms of this license are available at https://www.dovepress.com/terms
and incorporate the Creative Commons Attribution
- Non Commercial (unported, 4.0) License.
By accessing the work you hereby accept the Terms. Non-commercial uses of the work are permitted
without any further permission from Dove Medical Press Limited, provided the work is properly
attributed. For permission for commercial use of this work, please see paragraphs 4.2 and 5 of our Terms.