Back to Journals » International Journal of General Medicine » Volume 15
Development of a Nomogram for Predicting Very Low Bone Mineral Density (T-Scores <−3) in the Chinese Population
Authors Li YF, Wang QY, Xu LL, Yue C, Hu L, Ding N, Yang YY, Qu XL, Sheng ZF
Received 12 November 2021
Accepted for publication 25 January 2022
Published 4 February 2022 Volume 2022:15 Pages 1121—1130
DOI https://doi.org/10.2147/IJGM.S348947
Checked for plagiarism Yes
Review by Single anonymous peer review
Peer reviewer comments 2
Editor who approved publication: Dr Scott Fraser
Yong-Fang Li,1,* Qin-Yi Wang,1,* Lu-Lu Xu,2 Chun Yue,2 Li Hu,2 Na Ding,1 Yan-Yi Yang,2 Xiao-Li Qu,1 Zhi-Feng Sheng1,2
1National Clinical Research Center for Metabolic Diseases, Hunan Provincial Key Laboratory of Metabolic Bone Diseases, Department of Metabolism and Endocrinology, Health Management Center, The Second Xiangya Hospital of Central South University, Changsha, Hunan, People’s Republic of China; 2Health Management Center, The Second Xiangya Hospital of Central South University, Changsha, Hunan, People’s Republic of China
*These authors contributed equally to this work
Correspondence: Zhi-Feng Sheng, Tel +86-13574806523
, Email [email protected]
Purpose: Fragility fractures, the most serious complication of osteoporosis, affect life quality and increase medical expenses and economic burden. Strategies to identify populations with very low bone mineral density (T-scores <-3), indicating very high fracture risk according to the American Association of Clinical Endocrinologists/American College of Endocrinology (AACE/ACE), are necessary to achieve acceptable fracture risk levels. In this study, the characteristics of persons with T-scores <− 3 were analyzed in the Chinese population to identify risk factors and develop a nomogram for very low bone mineral density (T-scores <-3) identification.
Materials and Methods: We conducted a cross-sectional study using the datasets of the Health Improvement Program of Bone (HOPE), with 602 men aged ≥ 50 years and 482 postmenopausal women. Bone mineral density (BMD) was measured using dual energy X-ray absorptiometry (DXA). Data on clinical risk factors, including age, sex, weight, height, previous fracture, parental hip fracture history, smoking, alcohol intake > 3 units/day, glucocorticoid use, rheumatoid arthritis, and secondary osteoporosis were collected. A multivariate logistic regression to evaluate the relationship between the clinical risk factors and very low BMD (T-scores <-3) was conducted. Parameter estimates of the final model were then used to construct a nomogram.
Results: Sixty-three of 1084 participants (5.8%) had BMD T-score <− 3. In multivariable regression analysis, age (odds ratio [OR] = 1.068, 95% confidence interval [CI]: 1.037– 1.099) and weight (OR = 0.863, 95% CI: 0.830– 0.897) were significant factors that were associated with very low BMD (T-scores <-3). These variables were the factors considered in developing the nomogram. The area under the receiver operating characteristic (ROC) curve for the model was 0.861. The cut-off value of the ROC curve was 0.080.
Conclusion: The nomogram can effectively assist clinicians to identify persons with very low BMD (T-scores <-3) and very high fracture risk in the Chinese population.
Keywords: osteoporosis, fracture, risk factors, prediction tool
Introduction
Osteoporosis is a systemic skeletal disorder characterized by reduced bone mass and destruction of bone microstructures, which ultimately leads to increased bone fragility and fracture risk.1 With the aging of the population, osteoporosis has become a serious social and public health problem. Presently, about 200 million people live with osteoporosis globally, which translates to the seventh commonest chronic disease.2 An epidemiological survey in China revealed that the prevalence of osteoporosis is directly proportional to age, and among the population aged >50 years, the prevalence was 29% among women and 13.5% among men.3 With the rapidly aging Chinese population, the prevalence of osteoporosis will increase steeply. Fragility fractures are the most serious complication of osteoporosis. Common sites of fractures include the spine, hips, and wrists. Spine and hip fractures may cause disability in middle or old age, affecting patients’ quality of life and life expectancy, and increasing medical expenses and economic burden. In 2010, China spent about $9.45 billion on osteoporotic fractures, accounting for 1.8% of national health-care expenditure, whereas the United States’ cost was $18.7 billion, accounting for 0.7% of national health-care expenditure.4
The process of osteoporosis is always insidious, and it is often not recognized by patients until osteoporotic fractures occur. Fracture Risk Assessment (FRAX) is an online-based tool developed to assess the risk for hip fractures or major osteoporotic fractures among men and women. The assessment was based on clinical risk factors, while considering the inclusion or exclusion of femoral neck bone mineral density (BMD).5 FRAX considers age, sex, weight, height, previous fracture, parental hip fracture history, current smoking, alcohol intake ≥3 units/day, glucocorticoid use, rheumatoid arthritis, and secondary osteoporosis in assessing osteoporotic fracture risk.5 It is non-invasive and reliable for use in primary care.6 Advancing age, women, higher body weight, a history of fracture, smoking, heavy alcohol consumption, use glucocorticoid and rheumatoid arthritis also have been shown to be associated with low bone mass.7
The WHO classifies BMD diagnosis into normal, low bone mass (osteopenia), osteoporosis, and severe or established osteoporosis.8 Stratification of patients by level of fracture risk is appropriate, because this may influence initial treatment choice. Most patients receive initial treatment because of high fracture risk.9 The American Association of Clinical Endocrinologists/American College of Endocrinology (AACE/ACE) classifies fracture risk into high risk and very high risk, where T-score <−3.0 is one of the diagnostic criteria for very high fracture risk.9 Patients with very high fracture risk may require more aggressive treatment options to achieve an acceptable level of fracture risk.9 There are many methods of bone density measurement, for example, BMD by dual-energy x-ray absorptiometry (DXA), the so-called gold standard for the diagnosis of osteoporosis,10 is not widely available in some communities and the cost of BMD and lack of reimbursement may limit its widespread use in some Asian countries.11 Therefore, a simple tool would be useful if it can identify a proportion of the population more (or less) likely to have very low bone mineral density (T-scores <-3). Literature on the risk factors for very low bone mineral density (T-scores <-3) is minimal. Our study aimed to analyze the risk factors for very high fracture risk with very low bone mineral density (T-scores <-3) as the standard, and to develop a nomogram that incorporates noninvasive risk factors for identifying persons with very low bone mineral density (T-scores <-3) in the population of Central and South China.
Materials and Methods
Study Participants
We conducted a cross-sectional study using the datasets of Health Improvement Program of Bone (HOPE), an ongoing prospective study, in which patients who underwent physical examination at the Health Management Center of the Second Xiangya Hospital were invited to participate. The HOPE study, which aims to achieve a sample size of 5000 participants over a period of one year, has already recruited more than 1800 participants since January 2021. Patients are eligible for enrollment in the HOPE study, if they 1) are ≥40 years old and 2) undergo DXA for BMD measurement. The exclusion criteria are 1) history of hip joint replacement or lumbar spine surgery, 2) inability to undergo DXA for any reason, 3) history of treatment with antiosteoporosis drugs, or 4) history of malignant tumor.
For the present study, 1084 healthy postmenopausal women and men aged ≥50 years from the HOPE cohort were recruited. Participants who did not complete surveys, physical examinations, or body density measurements were excluded.
Informed consent was obtained from all patients, and the proposal for this study was approved by the Ethics Committee of the Second Xiangya Hospital, Central South University, Changsha, Hunan, China.
Associated Factors
Data on study participants were obtained using a questionnaire with questions on variables such as sex, age, alcohol intake, smoking, prior fracture and parental hip fracture history, glucocorticoid use, rheumatoid arthritis, and secondary osteoporosis. Prior fracture history referred to fractures that occurred naturally or under mild external forces during adulthood. Current use of glucocorticoids was defined as receiving glucocorticoid therapy or having received the equivalent of prednisone >5 mg/d for more than three months. Secondary osteoporosis was defined as osteoporosis due to underlying diseases, such as type 1 diabetes, adult osteogenesis imperfecta, chronic untreated hyperthyroidism, hypogonadism or early menopause (menopause at age <45 years), chronic malnutrition or malabsorption, and chronic liver disease. Alcohol intake was significant if intake was ≥3 units/d.
Well-trained examiners performed anthropometric measurements, including of body weight and height, according to standard protocols. Body mass index (BMI) was defined as weight (kg) per unit square of the body height (m2), expressed in kg/m2.
BMD Measurements
BMD was measured by dual-energy X-ray absorptiometry (DXA; Discovery Wi S/N87556, Hologic, USA). Well-trained and qualified technicians performed standardized daily quality control of DXA instruments using a spine phantom, prior to the examination. BMD measurement sites included the femoral neck, total hip, and lumbar spine (L1–L4). According to the manufacturer (Discovery Wi S/N87556, Hologic, USA), a daily controlled phantom scan of the spine showed a longterm (>2 years) coefficient of variation (CV) of less than 0.7%. Based on repetitive scanning, the CVs were 1.1% for the femoral neck, 0.9% for the total hip, and 1.2% for the lumbar spine. The guidelines for diagnosis and treatment of primary osteoporosis in China were updated in 2017. One diagnostic criterion of osteoporosis was T-score of BMD measured by DXA in the medial axial skeletons (L1–L4, femoral neck, and total hip) or one-third of the distal radius of ≤−2.5 for postmenopausal women and men aged ≥50 years.12 According to the AACE/ACE, patients with very low bone mineral density (T-scores <-3) were considered to have very high fracture risk. FRAX was used to determine the 10-year probability of major osteoporotic fractures (MOFs) and hip fractures (HFs).9
Statistical Analysis
Continuous data were summarized by mean ± standard difference (SD), and analyzed using t-test when the data was normally distributed, otherwise using the Mann–Whitney U-test, and one-way analysis of variance or Kruskal–Wallis H-test. Categorical data were described as frequencies (percentages) and analyzed using the Chi-square test or Fisher’s exact test, as appropriate. Participants were stratified by BMD T-score. To investigate independent associated risk factors for very low bone mineral density (T-scores <-3), variables with significant differences in univariable analyses were incorporated into multivariable logistic regression analysis (forward: LR method), expressed by odds ratios (ORs) and their 95% confidence intervals (CIs). Only statistically significant variables in multiple variable analysis were considered for inclusion in the final binary logistic regression model and were used to develop the nomogram model using R software. The prediction results of the nomogram prediction model were internally validated; that is, the modeling data were used to verify the prediction effect of the model. The area under the receiver operating characteristic (ROC) curve was used to assess the ability of the predictive model to correctly distinguish individuals with a high probability of very low bone mineral density (T-scores <-3) from individuals with a low probability. The point closest to the upper left corner of the ROC curve is the cut-off value, which is the most appropriate value for distinguishing people at very low bone mineral density (T-scores <-3) from non-very low bone mineral density. Calibration degree referred to the degree of consistency between the predicted probability from the prediction model and the real probability, which is usually displayed by the calibration curve. Two-tailed P-values <0.05 were considered to be statistically significant. All data were analyzed using SPSS software version 23.0 (IBM Corp., Armonk, NY, USA) and R version 4.0.5.
Results
A total of 1084 participants, including 602 men aged ≥50 years (59.48 ± 8.10 years) and 482 postmenopausal women (60.19 ± 8.49 years), with mean age of 59.79 ± 8.28 were included in the study. Of all participants, 169 (15.6%) were diagnosed with osteoporosis (BMD T-score ≤−2.5). Sixty-three (37.3%) participants had T-score <−3 among these osteoporosis patients. The incidence of osteoporosis in men aged ≥50 years and postmenopausal women was 11.0% and 21.4%, respectively. In both sexes, the mean age was significantly higher in the osteoporotic group (BMD T-score ≤−2.5) than in the non-osteoporotic group (BMD T-score >−2.5), but height, weight and BMI were significantly higher in the non-osteoporotic group. In addition, smoking and glucocorticoid use were associated with osteoporosis in men aged ≥50 years (Table 1).
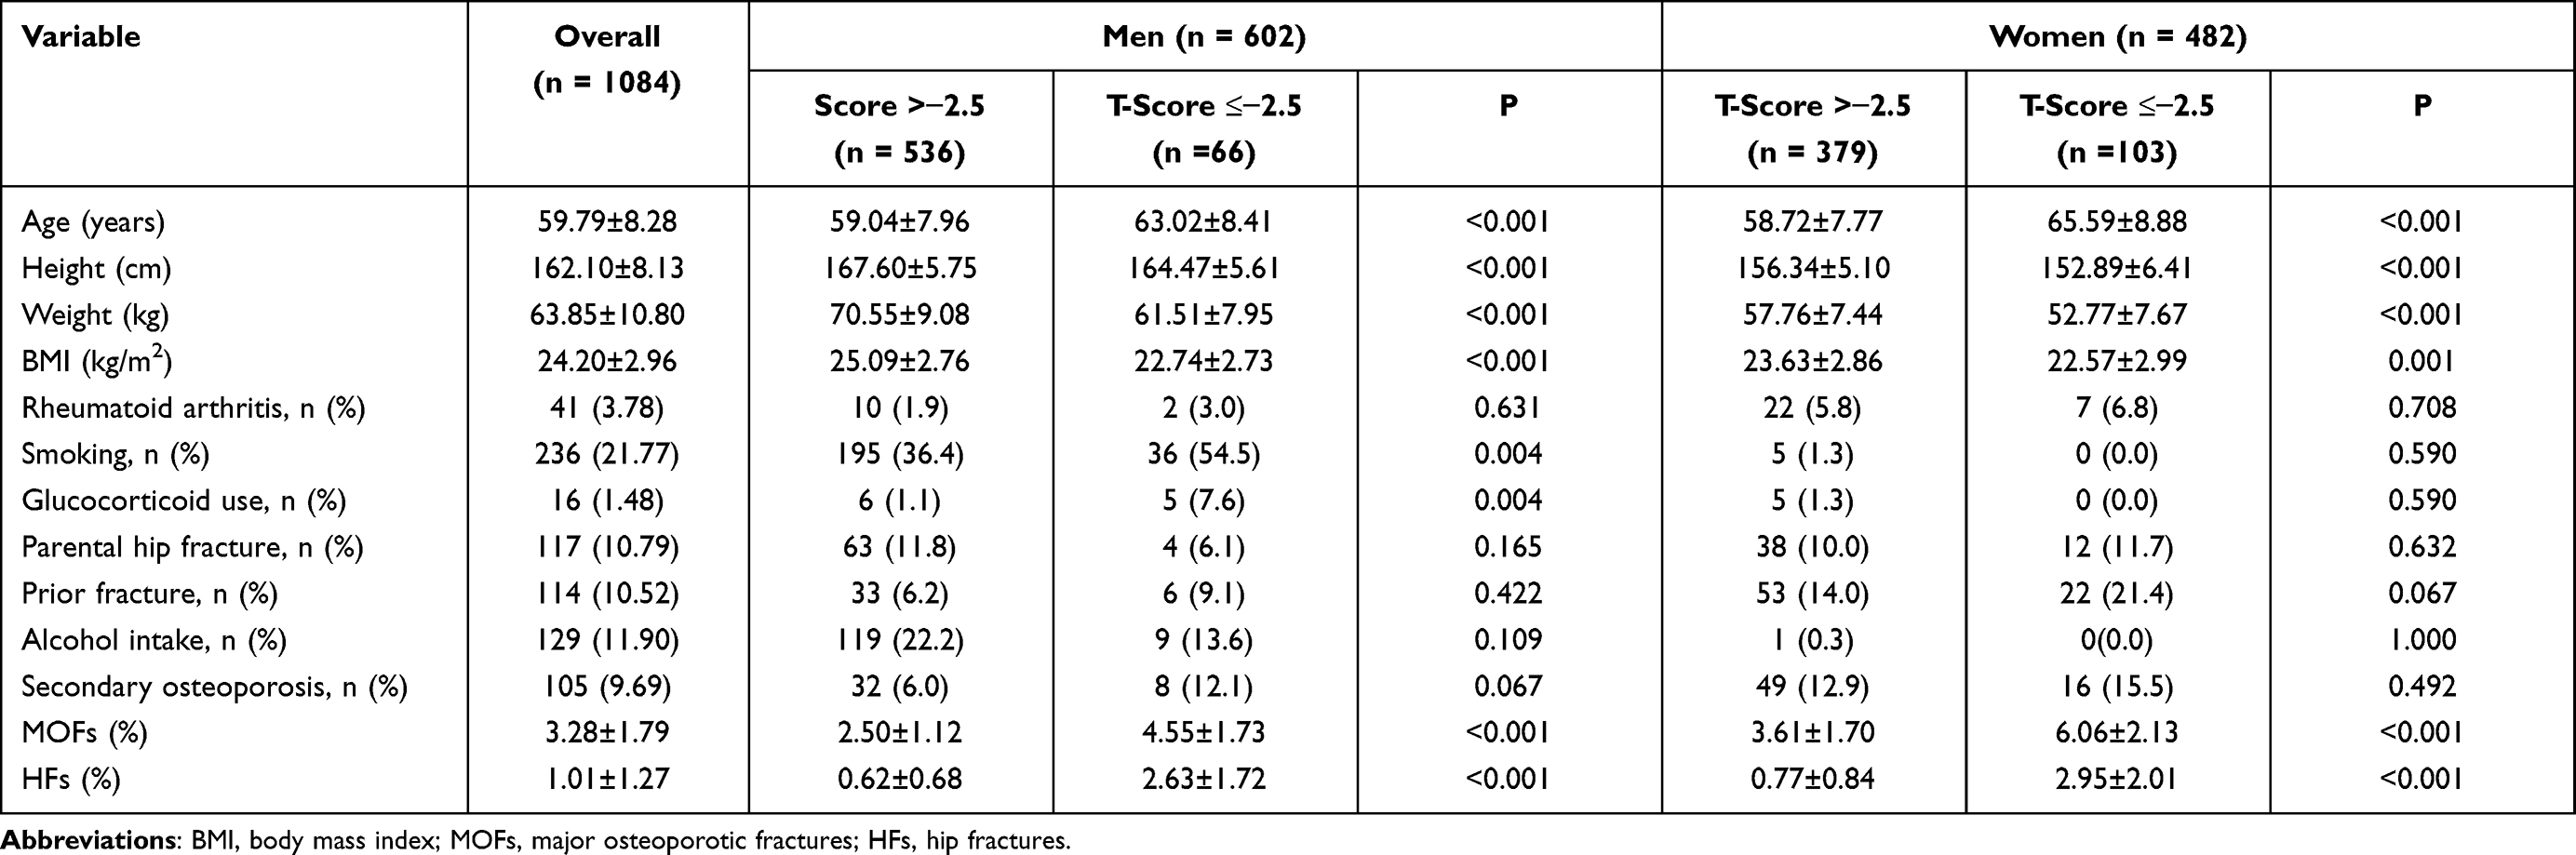 |
Table 1 Demographic, Anthropometric and Clinical Characteristics of the Osteoporosis and Non-Osteoporosis Individuals |
Participants were stratified by BMD T-score into four groups: normal (T ≥−1), low bone mass (−2.5 < T <−1), osteoporotic (−3 ≤ T ≤−2.5), and very low bone mineral density (T <−3). The incidence of very low bone mineral density (T-scores <-3) in men aged ≥50 years and postmenopausal women was 2.5% and 10.0%, respectively (Figure 1).
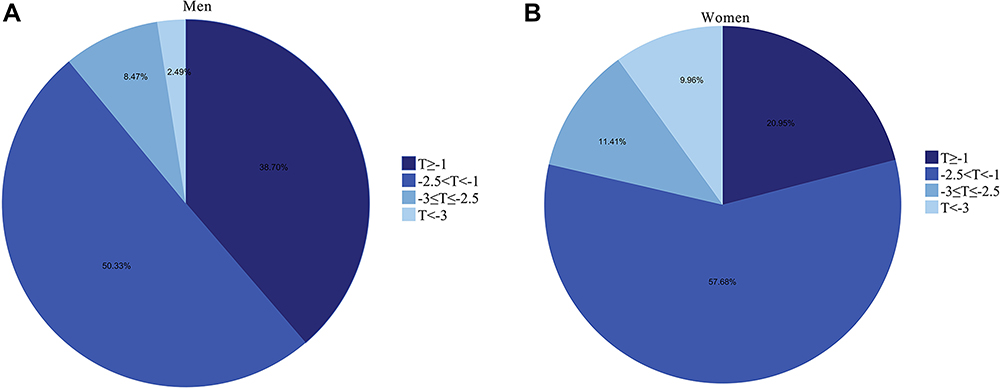 |
Figure 1 The proportion of various T-score in men aged ≥50 and postmenopausal women. Participants were grouped by BMD T-score: normal (T ≥−1), low bone mass (−2.5 < T <−1), osteoporotic (−3 ≤ T ≤−2.5), and very low bone mineral density (T <−3). (A) is the incidence of each group based on various T-score in men aged ≥50. (B) is the incidence of each group based on various T-score in postmenopausal women. |
In univariate analysis, advancing age, women, lower weight, shorter height, prior fractures, and secondary osteoporosis contributed to very low bone mineral density (T-scores <-3) in men and women. The multivariable regression analysis found that age (odds ratio [OR] = 1.068, 95% confidence interval [CI]: 1.037–1.099, P < 0.001) and weight (OR = 0.863, 95% CI: 0.830–0.897, P < 0.001) had significant, independent associations with very low bone mineral density (T-scores <-3), and they were included in the final prediction model (Table 2).
 |
Table 2 Associated Factors for Very High Fracture Risk (T-Score <−3) in the Study Population with Calculation of Odds Ratio (OR), Adjusted OR and Corresponding 95% Confidence Interval (95% CI) |
From this model, a nomogram was created to predict the probability of very low bone mineral density (T-scores <-3) based on patients’ characteristics (Figure 2). The scoring part, marked “Points” in the figure, represented the score corresponding to the value for each variable. The subsequent two lines (“age” and “weight”) were the risk factors (variables) used in the model. The line segment corresponding to each variable was marked with a scale, which represented the range of possible values of each variable. The length of the line reflected the contribution of each variable to the occurrence of very low bone mineral density (T-scores <-3). A vertical line was drawn from the value for each variable to the “Points” scale, to obtain the score for each variable. The two scales toward the bottom of the figure are “Total Points” and “VLBMD (very low bone mineral density) Probability”. “Total Points” was the sum of the scores for all variables. “VLBMD Probability” was the predicted probability of patients developing very low bone mineral density (T-scores <-3); the point on the “VLBMD Probability” axis corresponding to the total score was the probability of very low bone mineral density (T-scores <-3) for the patient.
 |
Figure 2 Prediction model nomogram. For each variable, the patient’s status/numerical value is plotted on the unique scale for that variable and a vertical line is drawn from that location up to the points line to determine a points value for that variable. The points for all variables are then added for a total point score. From the location of the total value on the total points line on the bottom, a vertical line is drawn perpendicularly from that location down to the probability of goal attainment line. The probability of very low bone mineral density (T-scores <-3) for the patient is predicted according to the value at which the vertical line intersects the probability of very low bone mineral density (T-scores <-3). Example: Mrs. X, 70 years old, weighs 50 kg; her score for age is approximately 15, her weight score is 77.5. Her total score is therefore 15+77.5=92.5, and her probability of having very high fracture risk is around 0.25. In other words, in 100 women like her, one would expect 25 of them have very low bone mineral density (T-scores <-3). Abbreviation: VLBMD, very low bone mineral density. |
The model was assessed with calibration curves, which measured the relationship between the probability of very low bone mineral density (T-scores <-3) predicted by the nomogram and the actual probability. The findings suggested that the predictions by the nomogram approximated the actual outcomes (Figure 3). The area under the ROC curves for this model was 0.861. The cut-off value of the ROC curve was 0.080. When the point on the “VLBMD Probability” axis was not less than 0.08 based on the age and weight of the subject, the subject was thought to be very low bone mineral density (T-scores <-3) population (Figure 4).
 |
Figure 3 The calibration curves of the prediction model. The diagonal dotted line indicates reference line on which ideal nomogram would lie (perfect prediction). Solid line indicates current nomogram performance. |
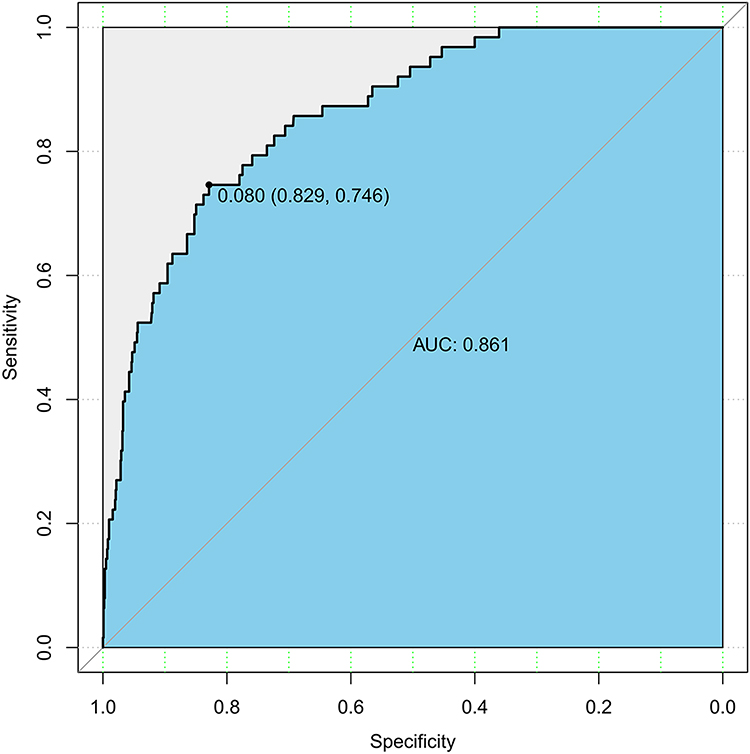 |
Figure 4 The receiver operating characteristic (ROC) curves of the prediction model. Abbreviation: AUC, area under the receiver operating characteristic. |
Variance inflation factors were calculated to evaluate possible interrelationships of the model variables with one another. For all variables, the variance inflation factors ranged between 1 and 3, which suggested substantial multicollinearity was unlikely to be present.13
Discussion
Osteoporosis is increasingly becoming a major public health concern in Asia, as the population is progressively aging. Ideally, all elderly persons at high fracture risk should be screened using BMD measurements and followed up. However, since the DXA densitometer is not widely available in Asian countries due to high cost, such a screening program is impractical and perhaps not cost-effective.14 According to AACE/ACE, patients at very high fracture risk include those who have suffered recent fractures (eg, within the past 12 months), those who have fractures while receiving approved osteoporosis therapy, multiple fractures, fractures while taking drugs causing skeletal harm (eg, long-term glucocorticoids), those with a very low T-score (eg, <−3.0), those at high risk of falls or with history of injurious falls, and those with a very high fracture probability by FRAX® (eg, major osteoporosis fracture >30%, hip fracture >4.5%) or other validated fracture risk algorithms. Those at very high fracture risk may require more aggressive treatment to achieve an acceptable level of fracture risk.9 However, a fraction of individuals with very high fracture risk needs BMD testing. FRAX is among the most widely used tools to predict risk for fractures.15 However, this study suggested that the mean 10-year probabilities of major osteoporotic fractures (MOFs) and hip fractures (HFs), calculated using FRAX in patients with T-score <−3, were 6.56% and 3.84%, respectively. These probabilities did not meet the FRAX-related standards recommended by the AACE/ACE. Therefore, with T <−3 as the standard, a simple clinical risk identification tool for individuals at very high fracture risk should be established.
Seemingly quite unusual, the final prediction model used only two variables (age and body weight). However, a study developed a tool, named OSTA (the osteoporosis risk self-assessment tool for Asia), only using age and weight and efficiently predicting osteoporosis risk with AUC of 0.79.11 In fact, increasing age and weight loss have been consistently associated with low BMD and increased fracture risk in another study. Weight plays an important role in bone mass maintenance by acting as a load exerted on bones and promoting bone formation.16 The Study of Osteoporotic Fractures reported that body weight was a useful predictor of hip and other non-spine fractures, when BMD had not been measured.17 A study of almost 7000 women in France concluded that body weight performed as well as a score based on six risk factors in identifying women with very low femoral neck BMD (T <–3.5), and also identified important differences in hip fracture risk.18
The present study revealed that except for age and weight, only height in both sexes, as well as smoking and glucocorticoid use in men aged ≥50 years, was associated with osteoporosis. However, a significant relationship could not be established between rheumatoid arthritis, parental hip fracture, prior fracture, alcohol intake, or secondary osteoporosis and osteoporosis. Unlike our findings, other studies have shown that previous fracture, parental hip fracture, current smoking, alcohol use, glucocorticoid use, rheumatoid arthritis, and secondary osteoporosis are related to BMD among both men and women.19–24 For example, previous studies have reported that smokers have lower BMD than ex-smokers, whereas ex-smokers have lower BMD than non-smokers.25 However, a significant association could not be established between smoking and osteoporosis in both sexes in this study. The findings of non-significant associations mentioned above might be due to the cross-sectional design of this study. Concurrently, our study did not consider the effect of dose. Moderate alcohol consumption has been reported to be associated with increased BMD in many studies, which may be due to higher endogenous estrogen levels among moderate consumers.26–28 However, chronic consumption of excessive alcohol eventually results in an osteopenic skeleton and increased risk for osteoporosis.29
As with most studies, our findings had some limitations. First, due to the retrospective nature of the study, causal relationships between very low bone mineral density (T-scores <-3) and its associated factors could not be established. Second, the possibility of recall bias may have reduced the tool’s ability to predict very low bone mineral density (T-scores <-3). Third, our analyses involved women who were primarily from the Central and Southern regions of China, which may affect generalizability. Further evaluation is needed to determine how this model performs in other populations. Fourth, the very high risk of fracture proposed by AACE is for postmenopausal women, and whether it is applicable to men is still unknown. However, one population-based prospective cohort study suggested that the hip fracture risk in men and women of the same age and at the same absolute BMD is very similar.30 Another large population-based longitudinal cohort study found no significant sex difference in the association between BMD and vertebral fractures (clinical or radiographic) or for all fractures.31
Conclusion
The nomogram developed in this study, based on only two variables, age and body weight, can be used for predicting very low bone mineral density (T-scores <-3), which is thought to be very high fracture risk, without BMD measurement. With this model, more active treatment choices can possibly be administered in time to achieve acceptable fracture risk levels. The present model visually translates clinical risk factors into a paper-based nomogram for readily available use in clinical practice.6
Informed Consent Statement
Informed consent was obtained from all subjects involved in the study.
Acknowledgments
This is a short text to acknowledge the contributions of specific colleagues, institutions, or agencies that aided the efforts of the authors.
Author Contributions
All authors made substantial contributions to conception and design, acquisition of data, or analysis and interpretation of data; took part in drafting the article or revising it critically for important intellectual content; agreed to submit to the current journal; gave final approval of the version to be published; and agree to be accountable for all aspects of the work.
Funding
This work was supported by grants from the National Natural Science Foundation of China [grant number 81870622], the Hunan Provincial Natural Science Foundation of China [grant number 2018JJ2574], the Changsha Municipal Natural Science Foundation [grant number kq2014251], the Bethune Charitable Foundation, BCF [grant number G-X-2019-1107-3], the Fundamental Research Funds for the Central Universities of Central South University [grant number 512191022] and 2021 Postgraduate Education Reform Project of Central South University [grant number 512190112].
Disclosure
The authors report no conflicts of interest in this work.
References
1. Peck WA. Consensus development conference: diagnosis, prophylaxis, and treatment of osteoporosis. Am J Med. 1993;94(6):646–650. doi:10.1016/0002-9343(93)90218-E
2. Wang Y, Ding H, Wang X, Wei Z, Feng S. Associated factors for osteoporosis and fracture in Chinese elderly. Med Sci Monit. 2019;25:5580–5588. doi:10.12659/MSM.914182
3. Cheng X, Zhao K, Zha X, et al. Opportunistic screening using low-dose CT and the prevalence of osteoporosis in China: a Nationwide, Multicenter Study. J Bone Miner Res. 2021;36(3):427–435. doi:10.1002/jbmr.4187
4. Si L, Winzenberg TM, Jiang Q, Chen M, Palmer AJ. Projection of osteoporosis-related fractures and costs in China: 2010–2050. Osteoporos Int. 2015;26(7):1929–1937.
5. Kanis JA. Assessment of Osteoporosis at the Primary Health-Care Level. World Health Organization Collaborating Centre for Metabolic Bone Diseases, University of Sheffield, UK and the World Health Organization; 2007.
6. Nguyen ND, Frost SA, Center JR, Eisman JA, Nguyen TV. Development of prognostic nomograms for individualizing 5-year and 10-year fracture risks. Osteoporos Int. 2008;19(10):1431–1444. doi:10.1007/s00198-008-0588-0
7. U.S. Department of Health and Human Services. Bone Health and Osteoporosis: A Report of the Surgeon General. Rockville (MD): Office of the Surgeon General (US); 2004.
8. Cosman F, de Beur SJ, LeBoff MS, et al. Clinician’s guide to prevention and treatment of osteoporosis. Osteoporos Int. 2014;25(10):2359–2381. doi:10.1007/s00198-014-2794-2
9. Camacho PM, Petak SM, Binkley N, et al. American Association of Clinical Endocrinologists/American College of Endocrinology clinical practice guidelines for the diagnosis and treatment of postmenopausal osteoporosis-2020 update. Endocr Pract. 2020;26(Suppl 1):1–46.
10. Unnanuntana A, Gladnick BP, Donnelly E, Lane JM. The assessment of fracture risk. J Bone Joint Surg Am. 2010;92(3):743–753. doi:10.2106/JBJS.I.00919
11. Koh LKH, Sedrine WB, Torralba TP, et al. A simple tool to identify Asian women at increased risk of osteoporosis. Osteoporos Int. 2001;12(8):699–705. doi:10.1007/s001980170070
12. Liu S, Chen R, Ding N, et al. Setting the new FRAX reference threshold without bone mineral density in Chinese postmenopausal women. J Endocrinol Invest. 2021;44(2):347–352. doi:10.1007/s40618-020-01315-4
13. Snee RD. Validation of regression models: methods and examples. Technometrics. 1977;19(4):415. doi:10.1080/00401706.1977.10489581
14. Pongchaiyakul C, Panichkul S, Songpatanasilp T, Nguyen TV. A nomogram for predicting osteoporosis risk based on age, weight and quantitative ultrasound measurement. Osteoporos Int. 2007;18(4):525–531. doi:10.1007/s00198-006-0279-7
15. Ghannam S, Blaney H, Gelfond J, Bruder JM. The use of FRAX in identifying women less than 65 years needing bone mineral density testing. J Clin Densitom. 2021;24(1):36–43. doi:10.1016/j.jocd.2020.05.002
16. Yoo JE, Park HS. Prevalence and associated risk factors for osteoporosis in Korean men. Arch Osteoporos. 2018;13(1):88. doi:10.1007/s11657-018-0506-9
17. Margolis K, Ensrud K, Schreiner P, Tabor H. Body size and risk for clinical fractures in older women. Study of Osteoporotic Fractures Research Group. Ann Intern Med. 2000;133(2):123–127. doi:10.7326/0003-4819-133-2-200007180-00011
18. Dargent-Molina P, Poitiers F, Bréart G. In elderly women weight is the best predictor of a very low bone mineral density: evidence from the EPIDOS study. Osteoporos Int. 2000;11(10):881–888. doi:10.1007/s001980070048
19. Cauley JA, Fullman RL, Stone KL, et al. Factors associated with the lumbar spine and proximal femur bone mineral density in older men. Osteoporos Int. 2005;16(12):1525–1537. doi:10.1007/s00198-005-1866-8
20. Orwoll ES, Bevan L, Phipps KR. Determinants of bone mineral density in older men. Osteoporos Int. 2000;11(10):815–821. doi:10.1007/s001980070039
21. Ribot C, Pouilles J, Bonneu M, Tremollieres F. Assessment of the risk of post-menopausal osteoporosis using clinical factors. Clin Endocrinol (Oxf). 1992;36(3):225–228. doi:10.1111/j.1365-2265.1992.tb01436.x
22. Lydick E, Cook K, Turpin J, Melton M, Stine R, Byrnes C. Development and validation of a simple questionnaire to facilitate identification of women likely to have low bone density. Am J Manag Care. 1998;4(1):37–48.
23. Pinheiro MM, Reis Neto ET, Machado FS, et al. Risk factors for osteoporotic fractures and low bone density in pre and postmenopausal women. Rev Saude Publica. 2010;44(3):479–485. doi:10.1590/S0034-89102010000300011
24. Heidari B, Hosseini R, Javadian Y, Bijani A, Sateri MH, Nouroddini HG. Factors affecting bone mineral density in postmenopausal women. Arch Osteoporos. 2015;10:15. doi:10.1007/s11657-015-0217-4
25. Egger P, Duggleby S, Hobbs R, Fall C, Cooper C. Cigarette smoking and bone mineral density in the elderly. J Epidemiol Community Health. 1996;50(1):47–50. doi:10.1136/jech.50.1.47
26. Mukamal KJ, Robbins JA, Cauley JA, Kern LM, Siscovick DS. Alcohol consumption, bone density, and hip fracture among older adults: the cardiovascular health study. Osteoporos Int. 2007;18(5):593–602. doi:10.1007/s00198-006-0287-7
27. Felson DT, Zhang Y, Hannan MT, Kannel WB, Kiel DP. Alcohol intake and bone mineral density in elderly men and women. The Framingham Study. Am J Epidemiol. 1995;142(5):485–492. doi:10.1093/oxfordjournals.aje.a117664
28. Hankinson SE, Willett WC, Manson JE, et al. Alcohol, height, and adiposity in relation to estrogen and prolactin levels in postmenopausal women. J Natl Cancer Inst. 1995;87(17):1297–1302. doi:10.1093/jnci/87.17.1297
29. Chakkalakal DA. Alcohol-induced bone loss and deficient bone repair. Alcohol Clin Exp Res. 2005;29(12):2077–2090. doi:10.1097/01.alc.0000192039.21305.55
30. de Laet CE, Van Der Klift M, Hofman A, Pols HA. Osteoporosis in men and women: a story about bone mineral density thresholds and hip fracture risk. J Bone Miner Res. 2002;17:2231–2236. doi:10.1359/jbmr.2002.17.12.2231
31. Leslie WD, Langsetmo L, Zhou W, et al. Choice of lumbar spine bone density reference database for fracture prediction in men and women: a population-based analysis. J Clin Densitom. 2014;17(2):295–300.
 © 2022 The Author(s). This work is published and licensed by Dove Medical Press Limited. The
full terms of this license are available at https://www.dovepress.com/terms
and incorporate the Creative Commons Attribution
- Non Commercial (unported, 3.0) License.
By accessing the work you hereby accept the Terms. Non-commercial uses of the work are permitted
without any further permission from Dove Medical Press Limited, provided the work is properly
attributed. For permission for commercial use of this work, please see paragraphs 4.2 and 5 of our Terms.
© 2022 The Author(s). This work is published and licensed by Dove Medical Press Limited. The
full terms of this license are available at https://www.dovepress.com/terms
and incorporate the Creative Commons Attribution
- Non Commercial (unported, 3.0) License.
By accessing the work you hereby accept the Terms. Non-commercial uses of the work are permitted
without any further permission from Dove Medical Press Limited, provided the work is properly
attributed. For permission for commercial use of this work, please see paragraphs 4.2 and 5 of our Terms.