
Back to Journals » Diabetes, Metabolic Syndrome and Obesity » Volume 19
Development of a Glycated Albumin-Based Algorithm to Evaluate Diabetic Retinopathy in Adults with Type 2 Diabetes: A Cross-Sectional Study at a Hospital-Affiliated Physical Examination Center
Authors Bai J, Liu Y, Wang F, Yu S, Pu Y, Luo B  , Meng Q , Jin M , Chen D, Liu X
Received 19 September 2025
Accepted for publication 19 December 2025
Published 8 January 2026 Volume 2026:19 567164
DOI https://doi.org/10.2147/DMSO.S567164
Checked for plagiarism Yes
Review by Single anonymous peer review
Peer reviewer comments 2
Editor who approved publication: Dr Rebecca Baqiyyah Conway
Jing Bai,1 Yu Liu,1 Fan Wang,2 Shan Yu,1 Yungang Pu,1 Baobin Luo,1 Qingchen Meng,1 Mingze Jin,1 Dongning Chen,2 Xiangyi Liu1
1Department of Clinical Laboratory, Beijing Tongren Hospital, Capital Medical University, Beijing, 100730, People’s Republic of China; 2Beijing Tongren Hospital Health Management Center, Capital Medical University, Beijing, 100730, People’s Republic of China
Correspondence: : Xiangyi Liu, Department of Clinical Laboratory, Beijing Tongren Hospital, Capital Medical University, No. 1, Dongjiaominxiang Street, Dongcheng District, Beijing, 100730, People’s Republic of China, Tel +8601058268695, Email [email protected] Dongning Chen, Beijing Tongren Hospital Health Management Center, Capital Medical University, No. 1, Dongjiaominxiang Street, Dongcheng District, Beijing, 100730, People’s Republic of China, Tel +86010585363574, Email [email protected]
Background: Early diagnosis and management of diabetic retinopathy are essential to avoid vision impairment. We explored different glycated albumin levels in patients with or without diabetic retinopathy, and further constructed a glycated albumin based-model to predict the presence of diabetic retinopathy.
Methods: This cross-sectional study, which was conducted at a physical examination center from June 2022 to June 2024, collected clinical information, laboratory test results, and information on diabetic retinopathy from type 2 diabetes adults. Least absolute shrinkage and selection operator regression was applied to select the variables associated with diabetic retinopathy, with optimal threshold determined by receiver operating characteristic curve analysis. Eight machine learning algorithms, including eXtreme Gradient Boosting, logistic regression, Light Gradient-Boosting Machine, random forest, adaptive boosting, K-nearest neighbors, support vector machine, and Gaussian naïve Bayes, were compared to select the model with the best performance in predicting the risk of diabetic retinopathy.
Results: Of the 809 eligible patients, 85 (10.5%) and 724 (89.5%) had or had no diabetic retinopathy. Glycated albumin and glycated hemoglobin levels were higher in patients with diabetic retinopathy than in those without diabetic retinopathy. Glycated albumin had satisfactory performance for predicting diabetic retinopathy (area under the curve 0.657 at a threshold of 18.0%). Multivariate regression logistic analysis revealed that glycated albumin was independently correlated with diabetic retinopathy. Machine learning algorithm analysis illustrated that the random forest model had the best performance in predicting the presence of diabetic retinopathy (area under the curve 0.648 and 0.725 in validation and final test sets, respectively). Both calibration curve and decision curve analyses suggested high clinical predication value and applicability for this model.
Conclusion: High glycated albumin levels were associated with diabetic retinopathy in patients with type 2 diabetes. A novel prediction model based on glycated albumin could be used to predict the risk of diabetic retinopathy.
Keywords: diabetic retinopathy, glycated albumin, machine learning algorithm
Introduction
Diabetes is a global public health issue.1 According to the International Diabetes Federation, approximately 10.5% of adults globally have diabetes.2 This percentage is expected to rise rapidly, especially in low- and middle-income countries. In addition, nearly half of adults with diabetes have not been diagnosed, leading to increased morbidity and mortality.3
Diabetic retinopathy (DR) is a microvascular disease that occurs as a complication of uncontrolled diabetes.4 Persistent hyperglycemia damages endothelial cells and pericytes in the retinal microvasculature and causes chronic inflammation and oxidative stress, contributing to structural and functional changes in the retinal capillaries together with small-vessel occlusion, fluid leakage, ischemia, microaneurysms, and neovascularization, finally causing vision loss and blindness.5 Early diagnosis and prompt management of DR can prevent vision loss, reduce healthcare costs, and improve the quality of life of affected individuals, which has a great impact on individuals and society. It is recommended that patients with diabetes undergo ophthalmologic examinations at least once every 1–2 years.6 The gold standard for diagnosing DR is fundus examination by an ophthalmologist.7 If a simple and practical method or model, such as a serum biomarker, can effectively monitor and indicate the presence of DR, it would significantly improve the prompt management of DR in patients with diabetes.
Glycated hemoglobin (HbA1c) is a widely recognized glycated protein that reflects the average blood glucose level over 2–3 months. It is commonly applied to evaluate long-term glucose control, and it is a key factor in clinical decisions regarding treatment adjustments.8 However, it was reported that HbA1c accounted for only 11% of the DR risk, leaving 89% unexplained by other factors not captured by the average HbA1c level.9,10 Serum glycated albumin is another circulating glycemic control marker for diabetes evaluation.11 Glycated albumin can reflect short-term glycemic control over approximately 2–3 weeks and respond more rapidly to the fluctuations in blood glucose than HbA1c.12 In addition, unlike HbA1c, glycated albumin is not affected by alterations in hemoglobin levels or red blood cell turnover and other conditions that interfere with the measurement or interpretation of HbA1c. Glycated albumin was recommended for laboratory use in 2023 and for clinical use in 2024 by the American Diabetes Association as an alternative measure of glycemia control to provide standards of care in patients with diabetes.13 Glycated albumin is a precursor of advanced glycation-end products (AGEs), and it plays crucial roles in oxidative stress, inflammation, and vascular damage, all of which can contribute to the development of diabetic complications.14 In clinical studies, glycated albumin has emerged as a biomarker for diagnosing diabetes and monitoring the progression of renal, cerebral, and cardiovascular diseases.15 However, large-scale research on the potential different levels of glycated albumin in Chinese patients with or without DR remained limited.
Therefore, we performed a cross-sectional study and analyzed glycated albumin, HbA1c, and other blood test and physical examination indices in patients with type 2 diabetes (T2DM) with or without DR undergoing physical examination. Our research objective was to identify a potential indicator and develop a simple, accurate, and convenient DR risk prediction model to facilitate the clinical evaluation and early identification of DR, with the ultimate purpose of preventing and reducing diabetes-related blindness and other complications.
Materials and Methods
Study Design and Participant Selection
This cross-sectional study enrolled adults undergoing physical examinations at the East, West, and South divisions of the Health Examination Center of TongRen Hospital, Capital Medical University (Beijing, China) between June 2022 and June 2024. The study was performed in accordance with the principles of the Declaration of Helsinki. The study protocol was approved by the Ethics Committee of Beijing Tongren Hospital, Capital Medical University (approval number TREC2024-KY205). Informed consent was obtained from every study participant.
Adults aged 20–70 years who were diagnosed with T2DM were eligible. The exclusion criteria were as follows: missing data on glycated albumin, HbA1c, or body mass index (BMI); presence of conditions that might affect the study, including chronic kidney disease (estimated glomerular filtration rate [eGFR] < 60 mL/min/1.73 m2), cirrhosis (alanine aminotransferase > 3 × upper normal range), albumin (ALB) ≤ 30, anemia (hemoglobin: <13.0 g/dL in men and <12.0 g/dL in women), uncontrolled or untreated thyroid disease, malignant tumors, or pregnancy; use of medications including thyroid medications, steroid hormones, and insulin therapy (excluding oral hypoglycemic medications); and incomplete medical records.
Data Collection
Information on age, sex, weight, height, medical history, and medications was retrieved from patients’ medical records. Peripheral blood samples were collected in the morning after at least 8 h of fasting. Serum glucose, albumin (ALB), triglyceride (TG), total cholesterol, lipoprotein, and creatinine (SCR) levels were measured using the BECKMAN AU5800 automatic biochemical analyzer (Beckman Coulter, Brea, CA, USA). Glycated albumin levels were measured using the Lucica GA-L reagent kit (Asahi Kasei Pharma, Tokyo, Japan). HbA1c levels were analyzed using the Tosoh G8 automatic glycated hemoglobin analyzer (Tosoh Corporation, Tokyo, Japan). Body mass index (BMI) was calculated according to the standard formula and eGFR was calculated using Chronic Kidney Disease Epidemiology equation.16
Diagnosis of Diabetes and DR
T2DM was diagnosed according to the 2020 Chinese Guidelines for the Prevention and Treatment of T2DM.17 A participant was diagnosed with T2DM if he/she met any of the following criteria: fasting plasma glucose ≥ 7.0 mmol/L, HbA1c ≥ 6.5%, a history of T2DM in the medical record, or treatment with oral hypoglycemic agents for more than 3 months.
DR was assessed through fundus photography of each eye by professional doctors according to the criteria recommended by the Chinese Ophthalmological Society, Fundus Disease Group.7,18 Based on these examinations, participants were classified into the non-DR or DR group.
Prediction Model Construction and Statistical Analysis
After group assignment, propensity score matching (PSM) by age and sex was applied to match patients in the DR and non-DR groups at a 1:3 ratio. Continuous data were presented as the mean ± standard deviation or median and interquartile range (IQR) and compared using the independent-samples t-test or Mann–Whitney U-test depending on the normality of the data. Categorical data were presented as numbers and percentages and compared using the chi-squared test. Multicollinearity was evaluated. Univariate and multivariate logistic regression analyses were performed to identify variables associated with DR, followed by DR risk prediction model construction. The glycated albumin and HbA1c levels cutoffs for discrimination of DR patients from non-DR patients were determined by receiver operating characteristic (ROC) analysis.
The risk prediction model was constructed with 10-fold cross-validation method. Among patients in the PSM dataset, 20% were randomly selected as the test set. The remaining 80% were randomly split into 10 equal subsets, with nine subsets used as the training set and the other subset used as the internal validation set. The process was repeated 10 times, ensuring that each subset served as the validation set once. The average performance across 10 tests was used as the final model performance metric. Variables were selected by least absolute shrinkage and selection operator (LASSO) regression analysis. The optimal regularization parameter (λ) was determined via 10-fold cross-validation. LASSO regression was used to shrink insignificant variable coefficients to zero, resulting in a parsimonious model with fewer variables that were used in further machine learning model construction.
After determining the optimal threshold values for variables in predicting DR risk, eight machine learning algorithms, including eXtreme Gradient Boosting (XGBoost), logistic regression (LR), Light Gradient-Boosting Machine (LightGBM), random forest (RF), adaptive boosting, K-nearest neighbors (KNN), support vector machine (SVM), and Gaussian naïve Bayes (GNB), were used for model established.
The performance of the established models was examined using the area under ROC curve (AUC), sensitivity, and specificity. The best-performing model was selected according to the validation results. The AUC, calibration curve, and results of decision curve analysis (DCA) were presented.
All analyses were performed using the Beckman DxAI Smart Research Platform, R software (version 4.2.3), and Python (version 3.11.4). P < 0.05 was considered statistically significant.
Results
Study Participant Characteristics
We screened 21,070 adults who underwent a physical examination between June 2022 and June 2024. After applying the inclusion and exclusion criteria, 809 individuals with T2DM were entered into the analysis. Their baseline characteristics are presented in Table 1.
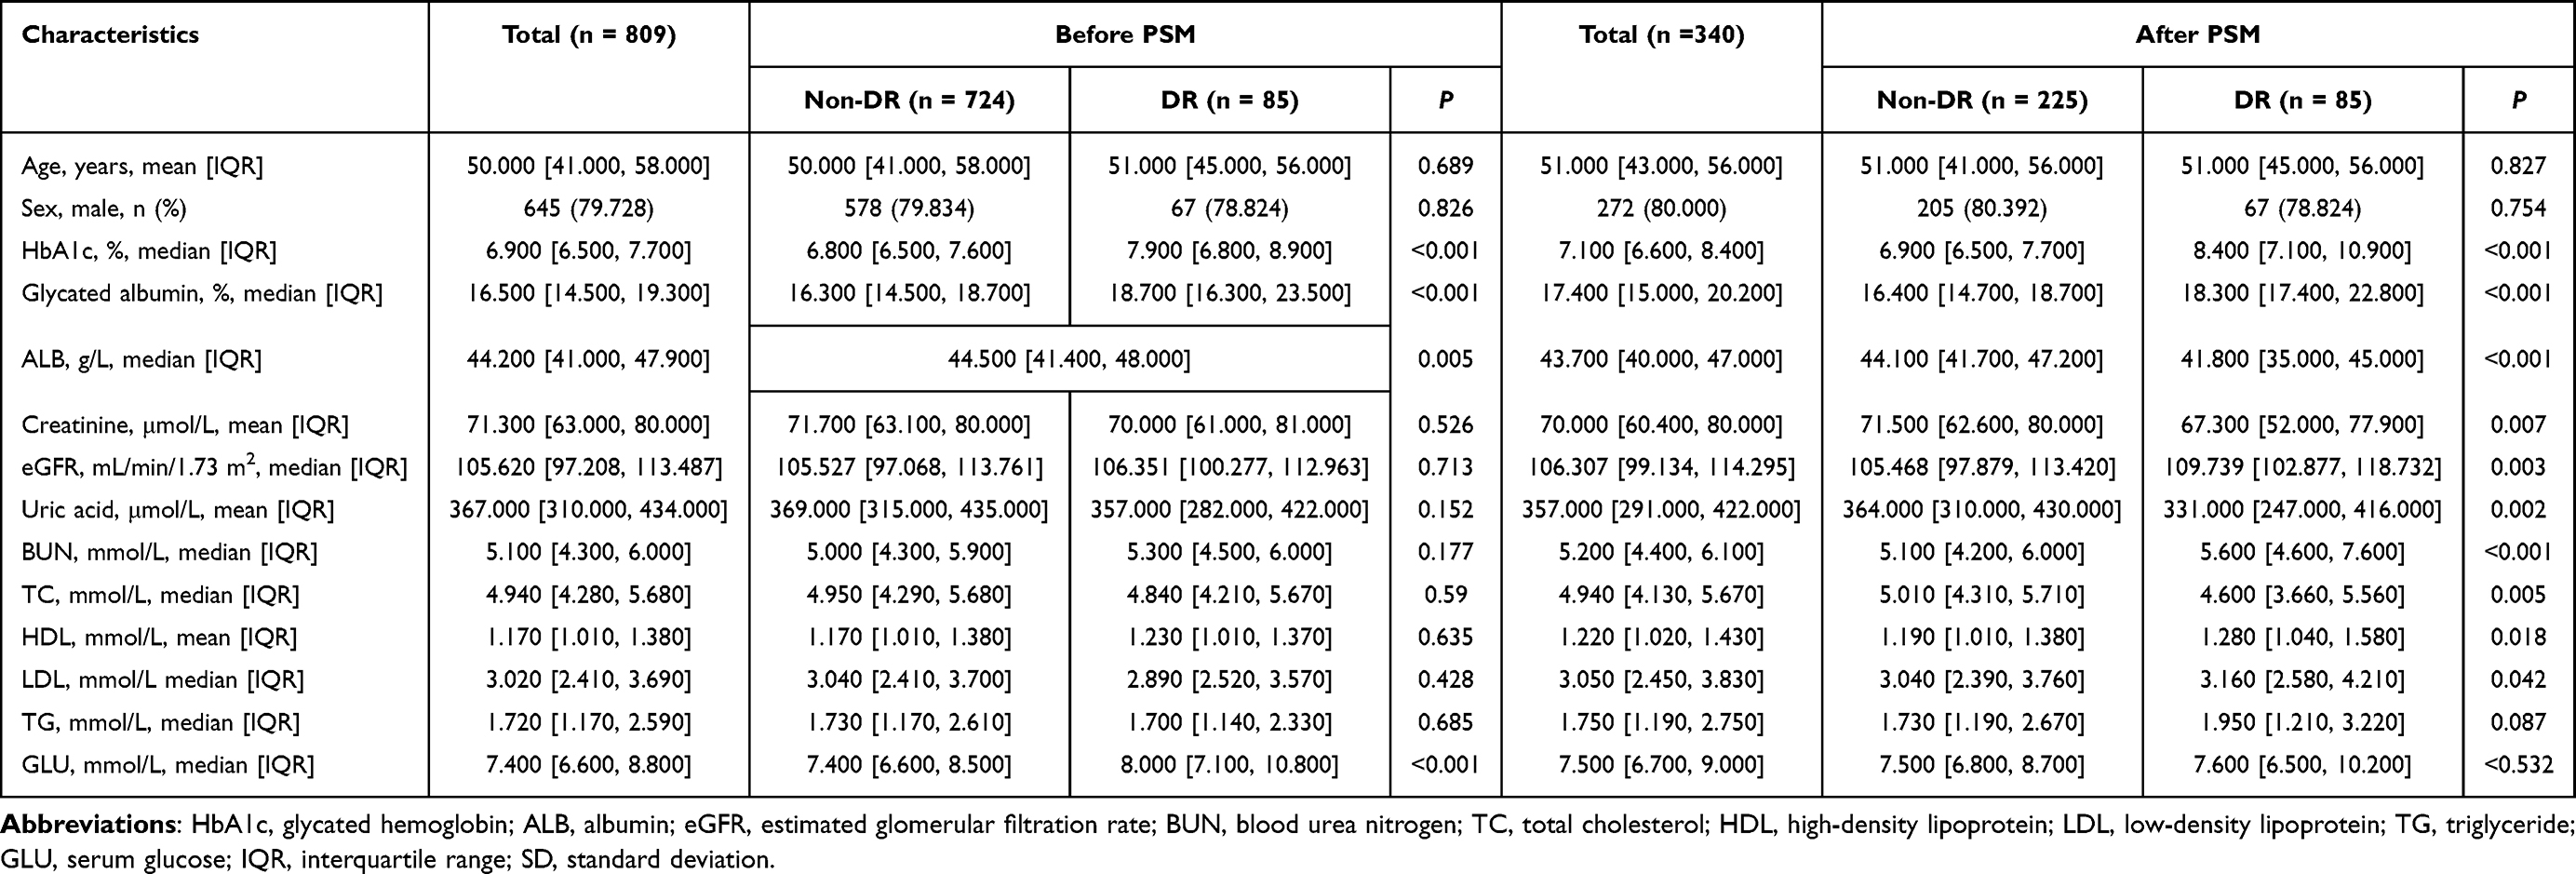 |
Table 1 Characteristics of the Study Participants |
Of the enrolled patients, 85 diabetics had DR (10.5%). Compared with the non-DR group, the DR group had higher HbA1c and glycated albumin levels (Table 1). After PSM, 255 patients in the non-DR group were matched with 85 patients in the DR group. Significant differences in blood urea nitrogen, SCR, uric acid, ALB, TC, high-density lipoprotein cholesterol (HDL-C), low-density lipoprotein cholesterol (LDL-C), HbA1c, glycated albumin level, and eGFR were detected between the DR and non-DR groups (all P < 0.05).
ROC Curve Analysis
At the optimal thresholds of 18.0% for glycated albumin level and 7.7% for HbA1c level, the sensitivity and specificity for predicting DR risk were 68.2% and 65.9%, respectively, for glycated albumin level and 61.2% and 74.5%, respectively, for HbA1c level, and the AUCs for glycated albumin and HbA1c levels were 0.657 and 0.726, respectively (Table 2 and Figure 1).
 |
Table 2 Receiver Operating Characteristic Curve Analysis |
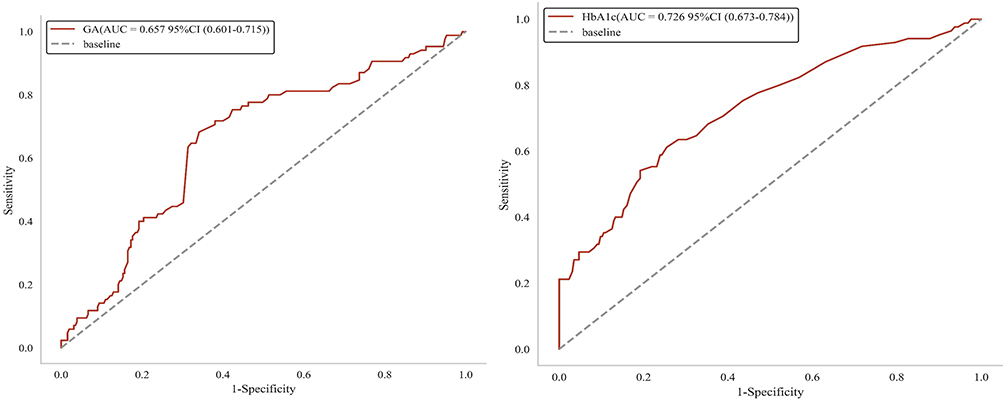 |
Figure 1 Receiver operating characteristic curves of glycated albumin and glycated hemoglobin (HbA1c) in the risk identification of diabetic retinopathy. Abbreviations: AUC, area under the curve; CI, confidence interval. |
Univariate and Multivariate Analyses
Multicollinearity was identified between SCR and eGFR and between TC and HDL-C. Considering clinical practice, SCR and HDL-C were selected as variables. Although multicollinearity was detected between glycated albumin and HbA1c, they are both key indicators of glycemia, and thus, separate explorations were conducted for them.
In the glycated albumin group, univariate analysis revealed that SCR, uric acid, ALB, TG, HDL-C, LDL-C, and glycated albumin levels were associated with DR. However, only the glycated albumin level was associated with DR in multivariate analysis. Similarly, univariate and multivariate analyses were performed in the HbA1c group, revealing that only HbA1c levels was independently associated with DR.
Univariate Machine Learning Algorithms and Performance Evaluation
Glycated albumin and HbA1c were each modeled as a single factor through eight machine learning models. After 10-fold cross-validation to ensure model robustness and generalizability, LR was the optimal model for both variables. The final glycated albumin model had an AUC of 0.680, with sensitivity, specificity, and accuracy of 55.6%, 72.0%, 0.676, respectively. The final HbA1c model had an AUC of 0.734, with sensitivity, specificity, and accuracy of 73.7%, 49.0%, and 0.559, respectively. Both models had a strong discriminative ability between patients with and without DR (Table 3).
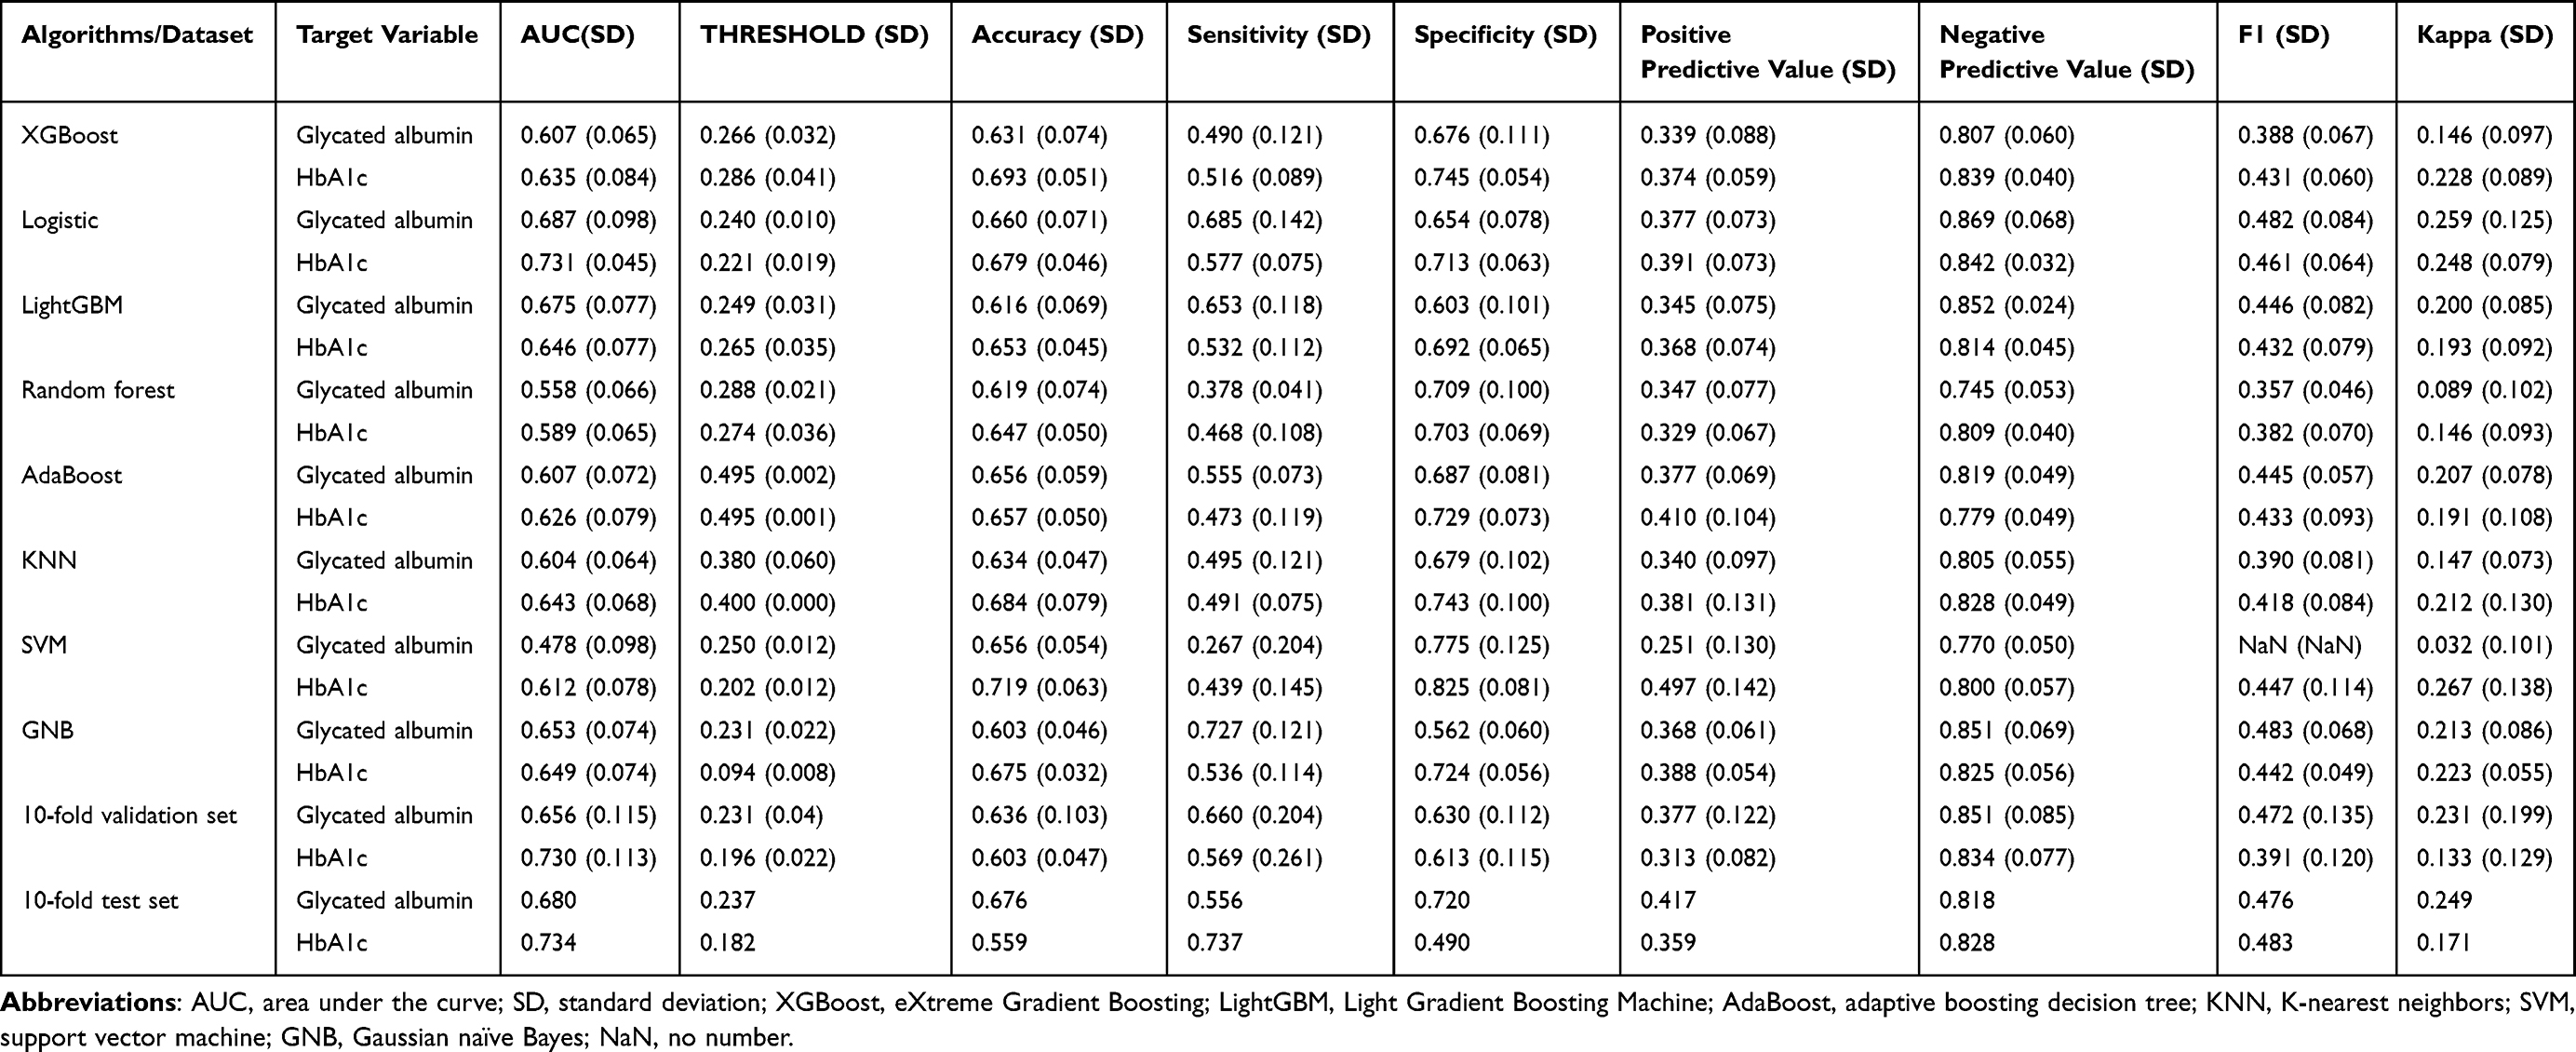 |
Table 3 Univariate Machine Learning Algorithms and Performance for Glycated Albumin and HbA1c |
LASSO Regression Analysis
Next, we applied LASSO regression analysis to identify key variables associated with DR. To maximize prediction accuracy, we selected the model associated with the smallest λ, as it corresponded to the minimum cross-validation error and demonstrated the strongest fitting performance. In the glycated albumin group, the λ value corresponding to the minimum mean square error was 0.009, and the variables, including SCR, ALB, HDL-C, LDL-C, and glycated albumin, were selected to construct a glycated albumin group model. The bar chart presents the mean absolute Shapley additive explanations values for each variable and reflects the average magnitude of their contribution to the model output. Glycated albumin level was the most important predictor, followed by ALB, LDL-C, HDL-C, and SCR. Similarly, in the HbA1c group, the λ value corresponding to the minimum mean square error was 0.007, and variables, including SCR, ALB, HDL-C, TG, and HbA1c, were selected to construct a HbA1c group model. HbA1c level was the third strongest predictor (Table 4 and Figure 2).
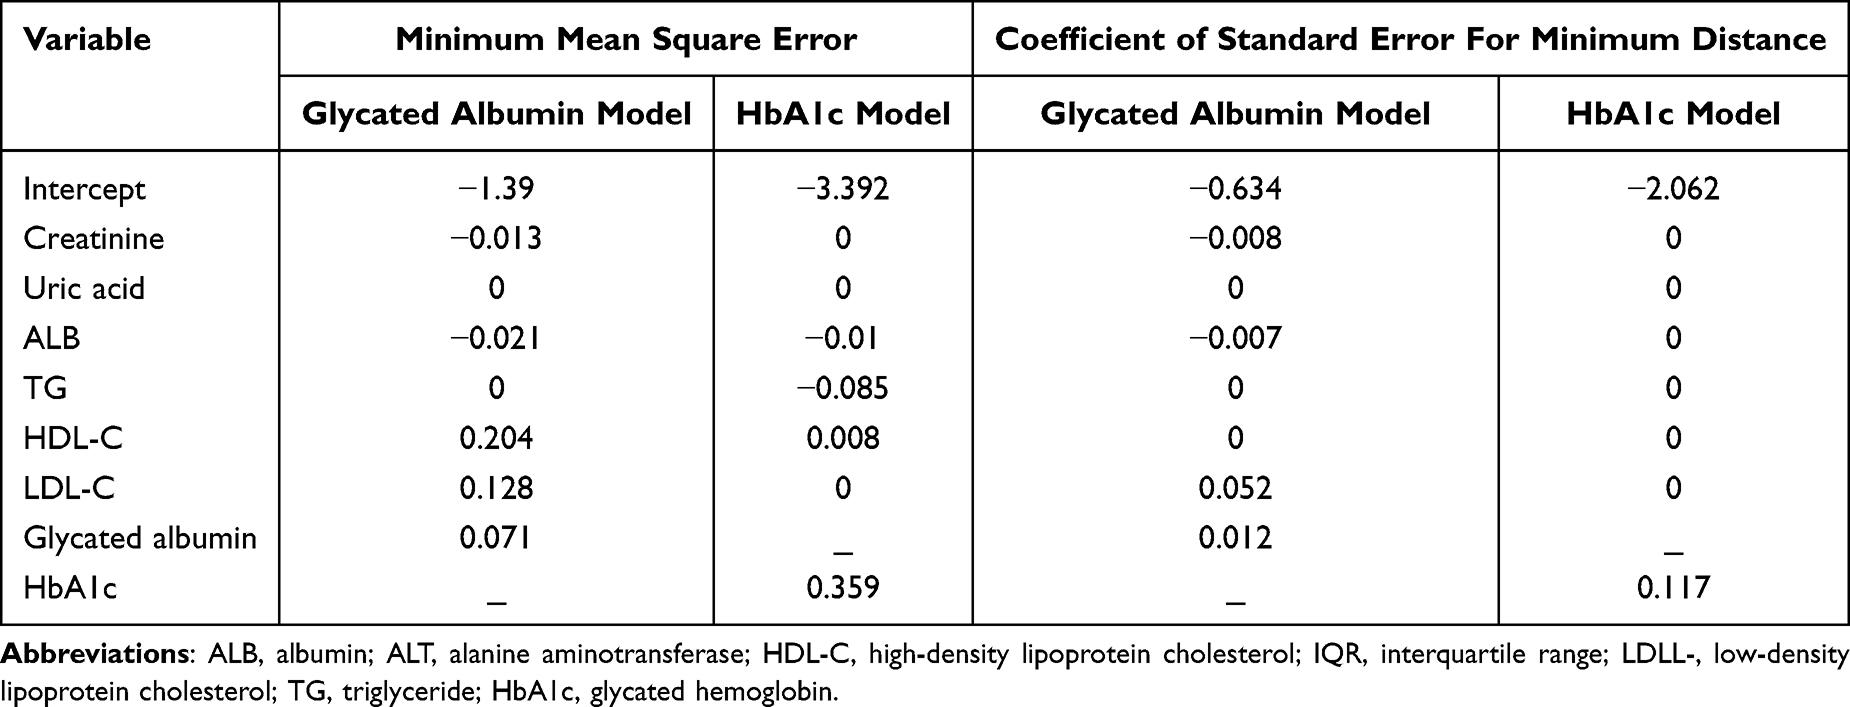 |
Table 4 Results of Variable Selection by LASSO Regression Based on the Glycated Albumin Model and HbA1c Model |
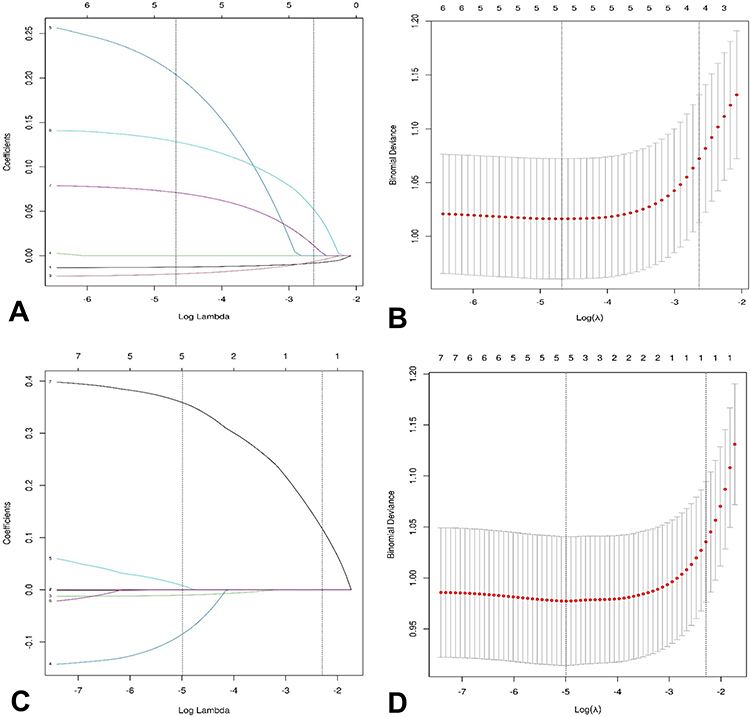 |
Figure 2 Least absolute shrinkage and selection operator coefficient profile plot ((A), glycated albumin; (C), glycated hemoglobin) and cross-validation curve for LASSO ((B), glycated albumin; (D), glycated hemoglobin). |
Multivariate Machine Learning Algorithms and Performance Evaluation
Based on the LASSO regression results, the glycated albumin and HbA1c group models were used to develop a risk prediction model for DR. After 10-fold cross-validation to ensure model robustness and generalizability, RF was the optimal model for both variables. The final glycated albumin and HbA1c group models had AUCs of 0.725 and 0.783, respectively. Both models displayed strong discriminative ability between patients with and without DR. The calibration curves exhibited a good fit, with a Brier score of 0.199 (95% CI = 0.140–0.267) for the glycated albumin group model and 0.141 (95% CI = 0.097–0.189) for the HbA1c group model (<0.2), with the predicted risk probability consistent with the actual observations. The results of DCA illustrated that both models had a high clinical net benefit and the ability to provide accurate predictions for DR risk (Table 5, Figures 3 and 4).
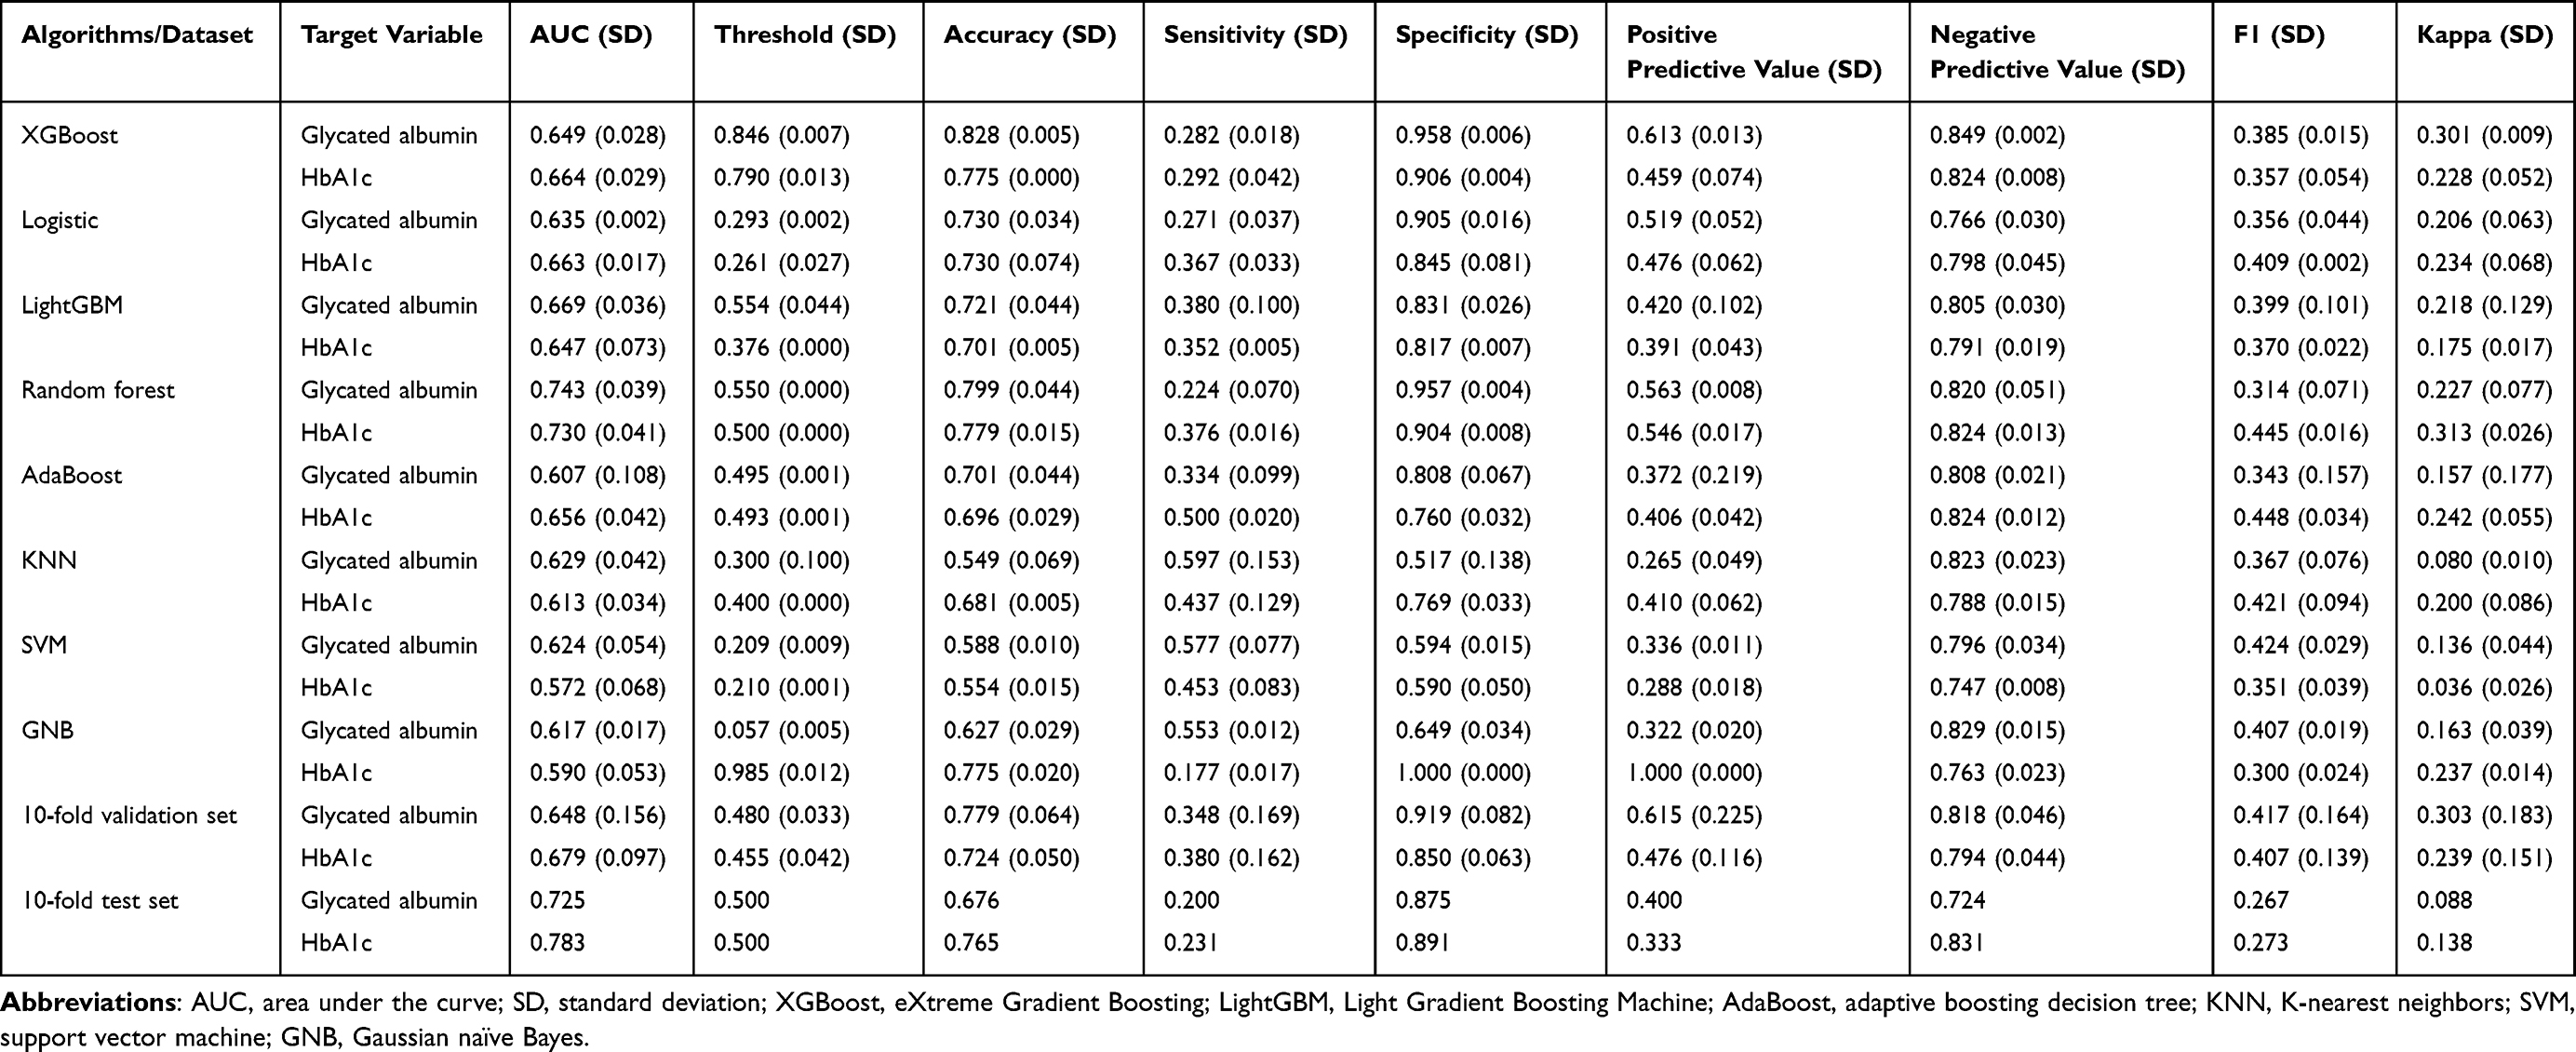 |
Table 5 Multivariate Machine Learning Algorithms and Performance for Glycated Albumin and HbA1c |
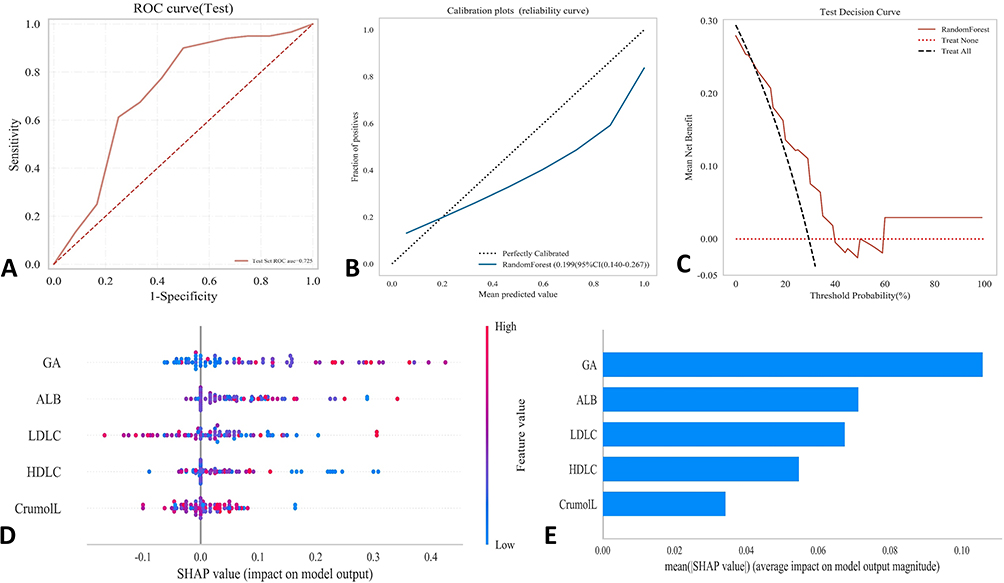 |
Figure 3 Evaluations of the random forest model based on glycated albumin. (A) Receiver operating characteristic curve in the test set; (B) Calibration plot; (C) Decision curve analysis; (D) Shapley additive explanations (SHAP) summary plot, (E) SHAP feature importance ranking. |
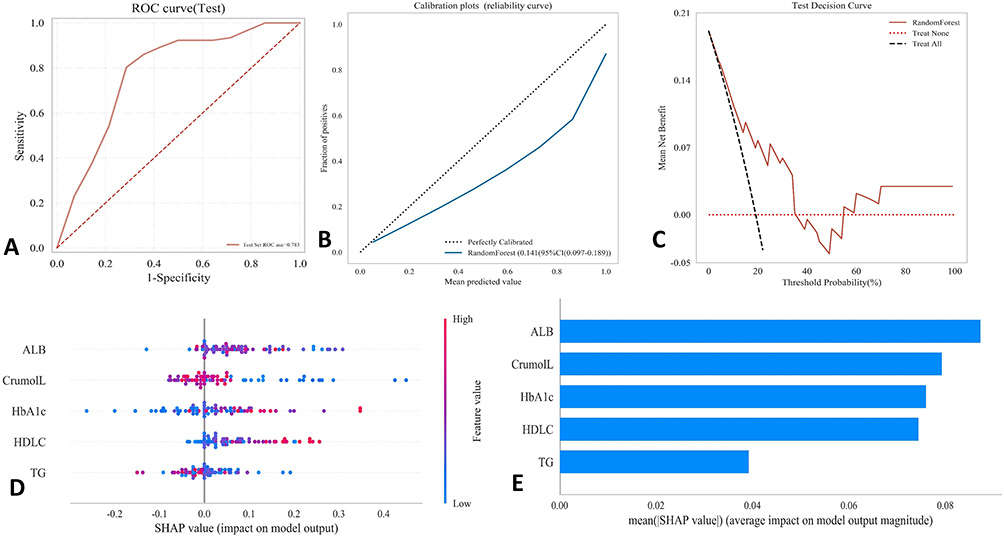 |
Figure 4 Evaluations of the random forest model based on glycated hemoglobin. (A) Receiver operating characteristic curve in the test set; (B) Calibration plot; (C) Decision curve analysis; (D) Shapley additive explanations (SHAP) summary plot, (E) SHAP feature importance ranking. |
Discussion
Patients with uncontrolled T2DM can develop various complications. Approximately 22.3% of these patients develop DR, which can lead to vision loss and impaired quality of life.19 A recent study reported that DR was the leading cause of blindness among the working-age population.20 Early accurate diagnosis and appropriate management can reduce the serious outcomes of DR. Our findings indicated that serum glycated albumin and HbA1c levels were independently correlated with DR. Through the establishment of predictive models using machine learning techniques, the risk of DR can be identified at an early stage.
The main pathological features of DR include thickening of the capillary basement membrane, microvascular thrombosis, endothelial damage, neovascularization, and fibrovascular scar formation.21 These pathological changes are closely related to AGE formation and accumulation.22 In patients with poorly controlled diabetes, high blood sugar levels lead to AGE formation from various proteins. AGEs impair vascular dilation responses, exacerbate tissue ischemia and hypoxia, increase endothelial cell permeability, and reduce pericyte proliferation, ultimately causing capillary wall dysfunction. Furthermore, AGEs can trigger oxidative stress and inflammatory responses, promote the expression of cytokines such as matrix metalloproteinases and vascular endothelial growth factor, and increase the production of basic fibroblast growth factor in Müller glial cells. Therefore, controlling and reducing AGE levels might help mitigate or slow the progression of diabetic complications, including DR. Both HbA1c and glycated albumin are precursors of AGEs, and these two biomarkers have been studied for diagnosing diabetes and monitoring its progression.23
Various biomarkers have been identified as useful tools for DR risk identification.24 Among them, HbA1c is the most commonly tested biomarker. A recent study revealed that an HbA1c level of 6.2% was the best threshold for predicting DR in the Chinese Han and Korean populations (AUC = 0.721, sensitivity = 60.0%, and specificity = 81.2%).25 Our ROC analysis illustrated that, at a threshold of 7.7%, HbA1c level could predict the presence of DR (AUC = 0.726, sensitivity = 61.2%, and specificity = 74.5%). Another study found no significant difference in the prevalence of DR in patients with diabetes and HbA1c level of 6.0%–8.0%, but the prevalence of DR in patients with HbA1c level ≥ 8.0% was significantly higher than that in patients with HbA1c levels< 8.0%.26 The small difference in the HbA1c level threshold among different studies might be attributable to regional and ethnic disparities between our research and previous studies.
Glycated albumin is formed when glucose binds to ALB in the blood through a non-enzymatic glycation process. Previous research reported that the mean glycated albumin levels in the DR and non-DR groups were 30.7% and 11.8%, respectively (P = 0.001), suggesting that elevated glycated albumin levels in patients with diabetes could be associated with DR development.27 A Japanese study identified 17.1% as the optimal glycated albumin level threshold for diagnosing diabetes based on the prevalence of DR.28 A 5-year cohort study of 359 Chinese patients reported an optimal glycated albumin level threshold of 21.9% for predicting DR progression in patients with T2DM.29 In our study, the optimal thresholds for predicting DR were 18.0% for glycated albumin level. In comparison to the aforementioned Chinese study, the investigators defined DR progression as both the development of non-proliferative DR from non-DR and the progression from non-proliferative DR to proliferative DR, and the research participants were adults visiting the hospital clinic. Conversely, our study participants were adults visiting a hospital-affiliated physical examination center, which might contribute to the different reported glycated albumin level thresholds. In our study, the AUC of the glycated albumin model was slightly lower than that of the HbA1c model (0.680 vs 0.734). However, the discriminative ability of the final glycated albumin group model achieved an AUC of 0.725, indicating that glycated albumin might have equivalent ability as HbA1c in discriminating between the presence or absence of DR. Meanwhile, as other biomarkers in the glycated albumin group were also measured in plasma, which could be integrated for combined detection. A recent study reported that an XGBoost machine learning model had a highly satisfactory performance for detecting DR (AUC = 67.0%, accuracy = 91.3%),30 but that model included six important biomarkers (tryptophan, phosphatidylcholine diacyl C42:2, butyrylcarnitine, tyrosine, hexadecanoyl carnitine, and total dimethylarginine), which are not commonly tested in clinical laboratories. In our study, the glycated albumin group model could differentiate DR from non-DR.
The duration of diabetes is a well-established risk factor for DR. However, no significant association was observed between the duration of diabetes and the presence of DR. Among the 85 patients with DR, 61 had a diabetes duration shorter than 10 years (or unknown), whereas 24 had a duration of 10 years or longer. The small number of patients might have prevented a conclusive demonstration of the impact of the diabetes duration on the development of DR. Furthermore, fasting blood glucose levels, which are highly susceptible to short-term influences such as dietary intake within the prior 3 days, emotional stress, and physical activity preceding blood collection, exhibited high variability and therefore failed to exhibit statistically significant differences between the groups after PSM (P = 0.532).
The strength of our study lied in the fact that it represented a large-scale investigation in China to establish a threshold of glycated albumin level for predicting DR risk within a nationally renowned hospital for ophthalmic care, possessing authoritative expertise in interpreting fundus lesions. The study population was drawn from individuals undergoing routine health examinations, and it reflects a community-based sample within a certain geographic radius around the hospital, thereby providing an approximate reflection of the epidemiological characteristics of DR in the region. The limitations included its cross-sectional study design, which did not allow us to explore the impact of dynamic glycated albumin level changes on the occurrence of DR, and the enrollment of participants from one hospital with small number of patients with DR, which might limit the generalizability of the study results. Including more DR patients from other areas or medical institutions in the model, or observing dynamic changes in glycated albumin levels, may further improve the performance of the DR prediction model. Our model also requires external validation before its wide application in clinical practice.
In conclusion, glycated albumin could be a valuable biomarker for detecting DR at an early stage in patients with T2DM. With its simplicity of the sample collecting and testing, efficiency and enhanced performance through machine learning, our model could serve as a practical tool for early risk assessment of DR in patients with T2DM.
Data Sharing Statement
The data that support the findings of this study are available from the corresponding author upon reasonable request.
Ethics Approval and Informed Consent
The study protocol was approved by the Ethics Committee of Beijing Tongren Hospital, Capital Medical University (approval number TREC2024-KY205). Informed consent was obtained from every study participant.
Author Contributions
Jing Bai: Conceptualization; Data curation; Formal analysis; Investigation; Methodology; Project administration; Writing – original draft; Writing – review and editing. Yu Liu, Fan Wang, Shan Yu, Yungang Pu, and Baobin Luo: Data curation; Investigation; Resources; Writing – review and editing. Qingchen Meng, and Mingze Jin: Conceptualization; Methodology; Supervision; Writing – review and editing. Xiangyi Liu and Dongning Chen: Conceptualization; Methodology; Project administration; Supervision; Writing – review and editing. All authors have given final approval of the version to be published; have agreed on the journal to which the article has been submitted; and agree to be accountable for all aspects of the work. Xiangyi Liu is the main corresponding author, while Dongning Chen is the co-corresponding author.
Funding
This research did not receive any specific grant from any funding agency in the public, commercial or not-for-profit sector.
Disclosure
The authors have no conflicts of interest to disclose.
References
1. Hossain MJ, Al-Mamun M, Islam MR. Diabetes mellitus, the fastest growing global public health concern: early detection should be focused. Health Sci Rep. 2024;7(3):e2004. doi:10.1002/hsr2.2004
2. Sun H, Saeedi P, Karuranga S, et al. IDF diabetes atlas: global, regional and country-level diabetes prevalence estimates for 2021 and projections for 2045. Diabet Res Clin Pract. 2022;183:109119. doi:10.1016/j.diabres.2021.109119
3. Ogurtsova K, Guariguata L, Barengo NC, et al. IDF diabetes atlas: global estimates of undiagnosed diabetes in adults for 2021. Diabet Res Clin Pract. 2022;183:109118. doi:10.1016/j.diabres.2021.109118
4. Pushparani DS, Varalakshmi J, Roobini K, Hamshapriya P, Livitha A. Diabetic retinopathy-a review. Curr Diabetes Rev. 2025;21(7):43–13. doi:10.2174/0115733998296228240521151050
5. Haydinger CD, Oliver GF, Ashander LM, Smith JR. Oxidative stress and its regulation in diabetic retinopathy. Antioxidants. 2023;12(8):1649. doi:10.3390/antiox12081649
6. Jia W, Weng J, Zhu D, et al. Standards of medical care for type 2 diabetes in China 2019. Diabetes Metab Res Rev. 2019;35(6):e3158. doi:10.1002/dmrr.3158
7. Yang Z, Tan TE, Shao Y, Wong TY, Li X. Classification of diabetic retinopathy: past, present and future. Front Endocrinol. 2022;13:1079217. doi:10.3389/fendo.2022.1079217
8. Copur S, Siriopol D, Afsar B, et al. Serum glycated albumin predicts all-cause mortality in dialysis patients with diabetes mellitus: meta-analysis and systematic review of a predictive biomarker. Acta Diabetol. 2021;58(1):81–91. doi:10.1007/s00592-020-01581-x
9. Zhong X, Li H, Tan S, et al. Initial retinal nerve fiber layer loss and risk of diabetic retinopathy over a four-year period. Invest Ophthalmol Vis Sci. 2024;65(12):5. doi:10.1167/iovs.65.12.5
10. Vujosevic S, Aldington SJ, Silva P, et al. Screening for diabetic retinopathy: new perspectives and challenges. Lancet Diabetes Endocrinol. 2020;8(4):337–347. doi:10.1016/S2213-8587(19)30411-5
11. Al-Lahham Y, Volanski W, Signorini L, et al. Reference interval for glycated albumin, 1,5-AG/GA, and GA/HbA1c ratios and cut-off values for type 1, Type 2, and gestational diabetes: a cross-sectional study. Biomedicines. 2024;12(12):2651. doi:10.3390/biomedicines12122651
12. Lee MY, Hsu WH, Lai CW, Chen SC, Liang CC. The association between glycated albumin, glycohemoglobin, and glycated albumin to glycohemoglobin ratio in diabetic retinopathy of prediabetes. Kaohsiung J Med Sci. 2019;35(11):695–701. doi:10.1002/kjm2.12125
13. Daya NR, Fang M, Shin JI, et al. Detecting hyperglycemia using biomarkers versus continuous glucose monitoring. Diabetes Care. 2025;48(8):1446–1452. doi:10.2337/dc25-0595
14. Xiong JY, Wang JM, Zhao XL, et al. Glycated albumin as a biomarker for diagnosis of diabetes mellitus: a systematic review and meta-analysis. World J Clin Cases. 2021;9(31):9520–9534. doi:10.12998/wjcc.v9.i31.9520
15. Giglio RV, Lo Sasso B, Agnello L, et al. Recent updates and advances in the use of glycated albumin for the diagnosis and monitoring of diabetes and renal, cerebro- and cardio-metabolic diseases. J Clin Med. 2020;9(11):3634. doi:10.3390/jcm9113634
16. Inker LA, Eneanya ND, Coresh J, et al. New creatinine- and cystatin C-based equations to estimate GFR without race. N Engl J Med. 2021;385(19):1737–1749. doi:10.1056/NEJMoa2102953
17. Chinese Elderly Type 2 Diabetes P, Treatment of Clinical Guidelines Writing G, Geriatric E, et al. Clinical guidelines for prevention and treatment of type 2 diabetes mellitus in the elderly in China (2022 edition).Zhonghua Nei Ke Za Zhi.2022;61(1):12–50. doi:10.3760/cma.j.cn112138-20211027-00751
18. Li X, Tan TE, Wong TY, Sun X. Diabetic retinopathy in China: epidemiology, screening and treatment trends-A review. Clin Exp Ophthalmol. 2023;51(6):607–626. doi:10.1111/ceo.14269
19. Teo ZL, Tham YC, Yu M, et al. Global prevalence of diabetic retinopathy and projection of burden through 2045: systematic review and meta-analysis. Ophthalmology. 2021;128(11):1580–1591. doi:10.1016/j.ophtha.2021.04.027
20. Kropp M, Golubnitschaja O, Mazurakova A, et al. Diabetic retinopathy as the leading cause of blindness and early predictor of cascading complications-risks and mitigation. EPMA J. 2023;14(1):21–42. doi:10.1007/s13167-023-00314-8
21. Roy S, Kim D. Retinal capillary basement membrane thickening: role in the pathogenesis of diabetic retinopathy. Prog Retin Eye Res. 2021;82:100903. doi:10.1016/j.preteyeres.2020.100903
22. Kang Q, Dai H, Jiang S, Yu L. Advanced glycation end products in diabetic retinopathy and phytochemical therapy. Front Nutr. 2022;9:1037186. doi:10.3389/fnut.2022.1037186
23. Rabbani N, Thornalley PJ. Protein glycation - biomarkers of metabolic dysfunction and early-stage decline in health in the era of precision medicine. Redox Biol. 2021;42:101920. doi:10.1016/j.redox.2021.101920
24. Xie Z, Xiao X. Novel biomarkers and therapeutic approaches for diabetic retinopathy and nephropathy: recent progress and future perspectives. Front Endocrinol. 2022;13:1065856. doi:10.3389/fendo.2022.1065856
25. Wen Y, Wang Q. Cut-off value of glycated hemoglobin A1c for detecting diabetic retinopathy in the Chinese population. World J Diabetes. 2024;15(7):1531–1536. doi:10.4239/wjd.v15.i7.1531
26. Aiello LP, Davis MD, Girach A, et al. Effect of ruboxistaurin on visual loss in patients with diabetic retinopathy. Ophthalmology. 2006;113(12):2221–2230.
27. Ijaz K, Bahoo MLA, Niaz S, Ahmad HU. Glycated albumin and angiopoietin-2: possible indicators of diabetic retinopathy in type-two diabetes. Pak J Med Sci. 2022;38(8):2202–2207. doi:10.12669/pjms.38.8.5579
28. Mukai N, Yasuda M, Ninomiya T, et al. Thresholds of various glycemic measures for diagnosing diabetes based on prevalence of retinopathy in community-dwelling Japanese subjects: the Hisayama Study. Cardiovasc Diabetol. 2014;13:45. doi:10.1186/1475-2840-13-45
29. Pan J, Li Q, Zhang L, et al. Serum glycated albumin predicts the progression of diabetic retinopathy--a five year retrospective longitudinal study. J Diabetes Complications. 2014;28(6):772–778. doi:10.1016/j.jdiacomp.2014.06.015
30. Yagin FH, Yasar S, Gormez Y, et al. Explainable artificial intelligence paves the way in precision diagnostics and biomarker discovery for the subclass of diabetic retinopathy in type 2 diabetics. Metabolites. 2023;13(12):1204. doi:10.3390/metabo13121204
 © 2026 The Author(s). This work is published and licensed by Dove Medical Press Limited. The
full terms of this license are available at https://www.dovepress.com/terms
and incorporate the Creative Commons Attribution
- Non Commercial (unported, 4.0) License.
By accessing the work you hereby accept the Terms. Non-commercial uses of the work are permitted
without any further permission from Dove Medical Press Limited, provided the work is properly
attributed. For permission for commercial use of this work, please see paragraphs 4.2 and 5 of our Terms.
© 2026 The Author(s). This work is published and licensed by Dove Medical Press Limited. The
full terms of this license are available at https://www.dovepress.com/terms
and incorporate the Creative Commons Attribution
- Non Commercial (unported, 4.0) License.
By accessing the work you hereby accept the Terms. Non-commercial uses of the work are permitted
without any further permission from Dove Medical Press Limited, provided the work is properly
attributed. For permission for commercial use of this work, please see paragraphs 4.2 and 5 of our Terms.
Recommended articles
Non-Linear Relationship Between Fasting C-Peptide and Retinopathy in Patients with Type 2 Diabetes Mellitus - A Retrospective Study
Ma J, Han C, Lv Y, Cai H
Diabetes, Metabolic Syndrome and Obesity 2025, 18:1035-1045
Published Date: 7 April 2025