Back to Journals » International Journal of General Medicine » Volume 18
Development of a Diagnostic Model for Focal Segmental Glomerulosclerosis: Integrating Machine Learning on Activated Pathways and Clinical Validation
Authors Ge Y, Liu X ![]() , Shu J, Jiang X, Wu Y
, Shu J, Jiang X, Wu Y
Received 28 September 2024
Accepted for publication 18 February 2025
Published 26 February 2025 Volume 2025:18 Pages 1127—1142
DOI https://doi.org/10.2147/IJGM.S498407
Checked for plagiarism Yes
Review by Single anonymous peer review
Peer reviewer comments 2
Editor who approved publication: Dr Franco Musio
Yating Ge,1,2,* Xueqi Liu,1,3,* Jinlian Shu,1,2 Xiao Jiang,1,3 Yonggui Wu1,3
1The Department of Nephrology, The First Affiliated Hospital of Anhui Medical University, Hefei, Anhui, People’s Republic of China; 2Department of Nephrology, The Second People’s Hospital of Hefei, Hefei Hospital Affiliated to Anhui Medical University, Hefei, Anhui, People’s Republic of China; 3Center for Scientific Research of Anhui Medical University, Hefei, Anhui, People’s Republic of China
*These authors contributed equally to this work
Correspondence: Yonggui Wu, The Department of Nephrology, The First Affiliated Hospital of Anhui Medical University, Hefei, People’s Republic of China, Email [email protected]
Background: Focal segmental glomerulosclerosis (FSGS) represents a major global health challenge, with its incidence rising in parallel with advances in diagnostic techniques and the growing prevalence of chronic diseases. This study seeks to enhance the diagnostic accuracy of FSGS by integrating machine learning approaches to identify activated pathways, complemented by robust clinical validation.
Methods: We analyzed data from 163 FSGS patients and 42 living donors across multiple GEO cohorts via the ComBat algorithm to address batch effects and ensure the comparability of gene expression profiles. Gene set enrichment analysis (GSEA) identified key signaling pathways involved in FSGS pathogenesis. We then developed a highly accurate diagnostic model by integrating nine machine learning algorithms into 101 combinations, achieving near-perfect AUC values across training, validation, and external cohorts. The model identified six genes as potential biomarkers for FSGS. Additionally, immune cell infiltration patterns, particularly those involving natural killer (NK) cells, were explored, revealing the complex interplay between genetics and the immune response in FSGS patients. Immunohistochemical analysis validated the expression of the key markers CD99 and OAZ2 and confirmed the association between NK cells and FSGS.
Results: The glmBoost+Ridge model exhibited exceptional diagnostic accuracy, achieving an AUC of 0.998 using just six genes: BANF1, TUSC2, SMAD3, TGFB1, CD99, and OAZ2. The prediction score was calculated as follows: score = (0.3997×BANF1) + (0.5543×TUSC2) + (0.5279×SMAD3) + (0.4118×TGFB1) + (0.8665×CD99) + (0.5996×OAZ2). Immunohistochemical analysis confirmed significantly elevated expression levels of CD99 and OAZ2 in the glomeruli and tubulointerstitial tissues of FSGS patients compared with those of controls.
Conclusion: This study demonstrates a highly accurate machine learning model for FSGS diagnosis. Immunohistochemical validation confirmed elevated expression of CD99 and OAZ2, offering valuable insights into FSGS pathogenesis and potential biomarkers for clinical application.
Keywords: focal segmental glomerulosclerosis (FSGS), machine learning diagnostic model, gene set enrichment analysis (GSEA), immune cell infiltration
Introduction
Focal segmental glomerulosclerosis (FSGS) represents a significant global health concern characterized by varying incidence rates and prevalence rates across different regions and populations.1–3 Recently, an increasing trend in the incidence of FSGS has been reported,4,5 which is likely linked to advancements in diagnostic techniques, an aging population, and an increasing burden of chronic diseases. Globally, FSGS accounts for a substantial proportion of primary glomerular diseases, particularly among adults, and is estimated to account for between 20% and 40% of all cases.6–8 However, this proportion varies significantly across different geographical areas and ethnic groups.6,9,10 For example, FSGS is the most common cause of primary glomerular diseases among African Americans in the United States, whereas it is less prevalent but growing in Asian countries.11–13
The pathogenesis of FSGS involves factors such as podocyte injury, abnormal cytokine and chemokine activity, and increased glomerular filtration pressure.3,14–17 Genetic studies have identified several mutations associated with FSGS, including mutations in the NPHS1, NPHS2, APOL1, ACTN4, and TRPC6 genes,3,14–19 which affect the structure and function of podocytes, contributing to disease progression. Renal biopsy, the gold standard for diagnosing FSGS,20 provides crucial information on the type and extent of renal damage, guiding therapeutic decisions. However, owing to its invasive nature, potential for sampling error, and limitations in prognosis evaluation and target development, biopsy results should be integrated with clinical presentation, laboratory tests, and other noninvasive diagnostic methods for the comprehensive assessment and management of FSGS patients. Recently, diagnostic models based on gene expression profiles have been reported for chronic kidney diseases. The NEPTUNE Knowledge Network has registered over 850 pediatric and adult patients with proteinuria glomerular diseases, providing extensive clinical, histological, genetic, and molecular profiles intricately connected to long-term outcomes.21,22 Mariani et al23 identified a subgroup of patients by molecular profiling, with either MCD or FSGS patients who shared kidney TNF pathway activation and poor outcomes.
The development of models based on sequencing data from FSGS renal biopsies represents a promising advance in personalized medicine. These models could improve the accuracy of FSGS diagnosis, while the activated signaling pathways identified may serve as potential therapeutic targets.
Materials and Methods
Basic Information of the Enrolled Cohorts
We downloaded all the samples from the Gene Expression Omnibus (GEO) database, a publicly accessible repository that archives and distributes high-throughput gene expression data submitted by the research community. Each dataset within GEO is assigned a unique identifier called GSE (GEO series), which contains gene expression profiles and corresponding metadata. These datasets are generated via a specific gene platform (GPL), which denotes the microarray or sequencing technology used in the experiments.
For this study, the total number of individuals across all cohorts included 163 FSGS patients and 42 living donors (LDs).24,25 Among the 42 LDs, 37 were from healthy controls, and 5 were from patients who underwent tumor resection and donated adjacent normal kidney tissue. All the FSGS samples were validated by a pathologist as described in the source literature. GSE133288 served as the training cohort because of its high number of FSGS patients, whereas GSE108109 and GSE108112 were utilized for the validation of the diagnostic model. GSE104948 was used as the external validation cohort and contains two batches of sequencing data from GPL22945 and GPL24120. Table 1 lists the number of FSGS patients and LDs for each cohort.
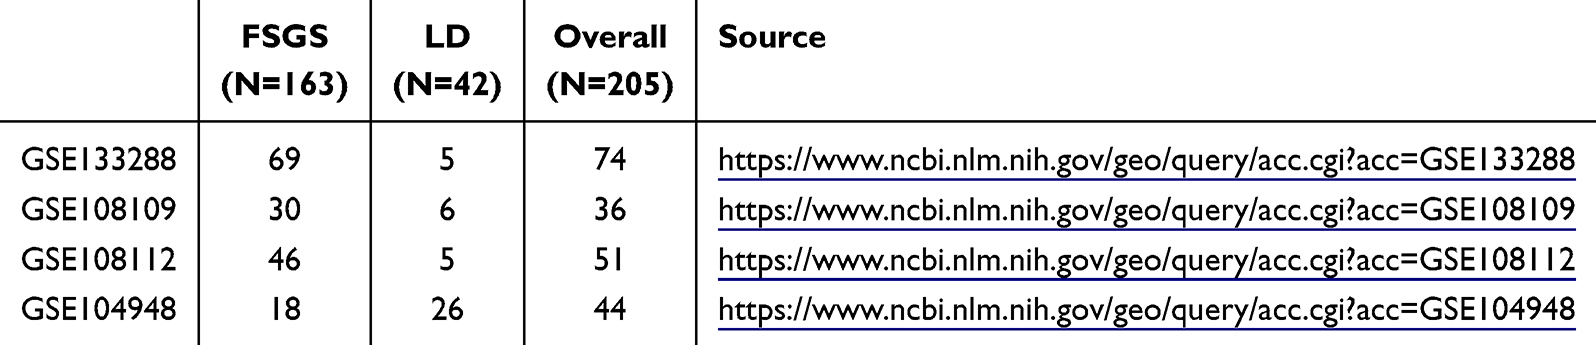 |
Table 1 Basic Information of Enrolled Cohorts |
Dismissal of Batch Effects
Batch effects are the nonbiological differences between two or more datasets. To eliminate the bias caused by batch effects in this study and make the transcription profiles in the three GEO cohorts more similar, the ComBat algorithms in the “sva” package were used to remove the batch effects between the GSE133288, GSE108109 and GSE108112 cohorts.
Calculation of the Scores of Signaling Pathways
Gene set enrichment analysis (GSEA) is a computational method that determines whether a set of genes shows statistically significant differences between two groups. We employed GSEA to compare the diverse activated signaling pathways between FSGS patients and LDs. The background files of the molecular signature gene sets were downloaded from MSigDB, C5: Biological Process, with a total of 7530 gene sets.26,27
Predictive Model Generated From Machine Learning-Based Integrative Approaches
(1) Pathway analysis and gene selection: First, we identified the significantly activated biological pathways in FSGS patients via gene expression data from the GEO database (GSE133288, GSE108109, and GSE108112 datasets). Gene set enrichment analysis (GSEA) was used to select these key biological pathways, and genes associated with these pathways were then chosen for further analysis. (2) Machine learning model training: The selected genes were used as input features, and nine machine learning algorithms (Elastic Net, Lasso, Ridge, stepwise regression, gradient boosting machines (glmBoost), generalized boosted regression modeling (GBM), linear discriminant analysis (LDA), and naive Bayes) were employed to train the model. Each algorithm was tested in multiple combinations and hyperparameters to form 101 different algorithmic combinations aimed at distinguishing FSGS patients from healthy controls. (3) Validation and External Testing: After training, the model was validated via two independent datasets (GSE108109 and GSE108112) to evaluate its generalizability and avoid overfitting. Additionally, GSE104948, which is not involved in pathway selection or model training, was used for external testing to further validate the robustness of the model. (4) Model performance evaluation: For each model, the area under the receiver operating characteristic curve (AUC) was calculated to assess its classification performance. The higher the AUC value is, the better the model’s ability to discriminate between FSGS patients and healthy individuals. The AUC was calculated for each model across the training, validation, and external testing datasets, and the best-performing model was selected.
Infiltration of Immune Cells
To gauge the unique immune infiltration within a population, we employed single-sample gene set enrichment analysis (ssGSEA), which ascertains an enrichment score reflecting the extent of absolute enrichment of an immune cell-associated gene set within each individual sample of the dataset in question. Normalized enrichment scores were computed for each immunological category.28 The ssGSEA analyses were conducted via the GSVA package in R.
Patient Enrollment and Tissue Collection
This study included both FSGS patients and healthy controls, with all patients rigorously screened. FSGS patients were enrolled between 2022 and 2023 after secondary causes such as diabetic nephropathy, obesity-related kidney disease, and viral infections were excluded. The diagnosis of FSGS was confirmed by renal biopsy, and a total of 16 patients were included. The control group consisted of 7 patients who underwent kidney cancer resection in 2023 and whose adjacent normal kidney tissue was used for analysis.
Comprehensive clinical data, including demographic and clinical parameters such as sex, age, Body Mass Index (BMI), Systolic Blood Pressure (SBP), Diastolic Blood Pressure (DBP), Albumin (ALB); Blood Urea Nitrogen (BUN), Serum Creatinine (Scr), Estimated Glomerular Filtration Rate (eGFR), Uric Acid (UA), Total Cholesterol (TC), Triglycerides (TG), Low-Density Lipoprotein (LDL), 24-hour Urinary Total Protein (24h-UTP), 24-hour Urinary Creatinine (24h-UScr), Urinary Transferrin (U-TRF), Urinary N-Acetyl-beta-D-Glucosaminidase (U-NAG), Urinary Immunoglobulin G (U-IgG), Urinary Beta-2 Microglobulin (U-β2MG), Urinary Alpha-1 Microglobulin (U-α1MG), Urinary Albumin to Creatinine Ratio (U-A/C).
Immunohistochemical Staining
FSGS patients and controls were selected for the validation of critical genes or immunocytes (Table 2). For immunohistochemistry, paraffin-embedded sections were initially deparaffinized in xylene and then rehydrated through a series of graded ethanol solutions. Antigen retrieval was performed in a microwave in EDTA buffer (pH 9.0). After the slides had cooled naturally, they were placed in PBS (pH 7.4) and washed on a decolorization shaker three times for 5 minutes each. The slides were then immersed in a 3% hydrogen peroxide solution and incubated at room temperature in the dark for 20 minutes. The sections were subsequently incubated overnight at 4°C with primary antibodies against OAZ2 (BIOSS, 1:200), CD99 (Abcam, 1:2000), and NK-p46 (BIOSS, 1:200). After washing, the sections were incubated with an HRP-conjugated secondary antibody (Shanghai Huilan Biotechnology) for 2 hours and developed with DAB substrate to visualize positive signals as brown staining. Finally, counterstaining was performed with Harris hematoxylin, followed by dehydration, clearing in xylene, and mounting with neutral resin. We employed a scoring system for the quantitative analysis of immunohistochemical results. This method evaluates both the intensity of cell staining and the percentage of positive cells. Staining intensity is graded on a scale of four levels (0 to 3), while the percentage of positive cells is also scored on a scale of four levels (1 to 4). The final score is obtained by multiplying the two individual scores.
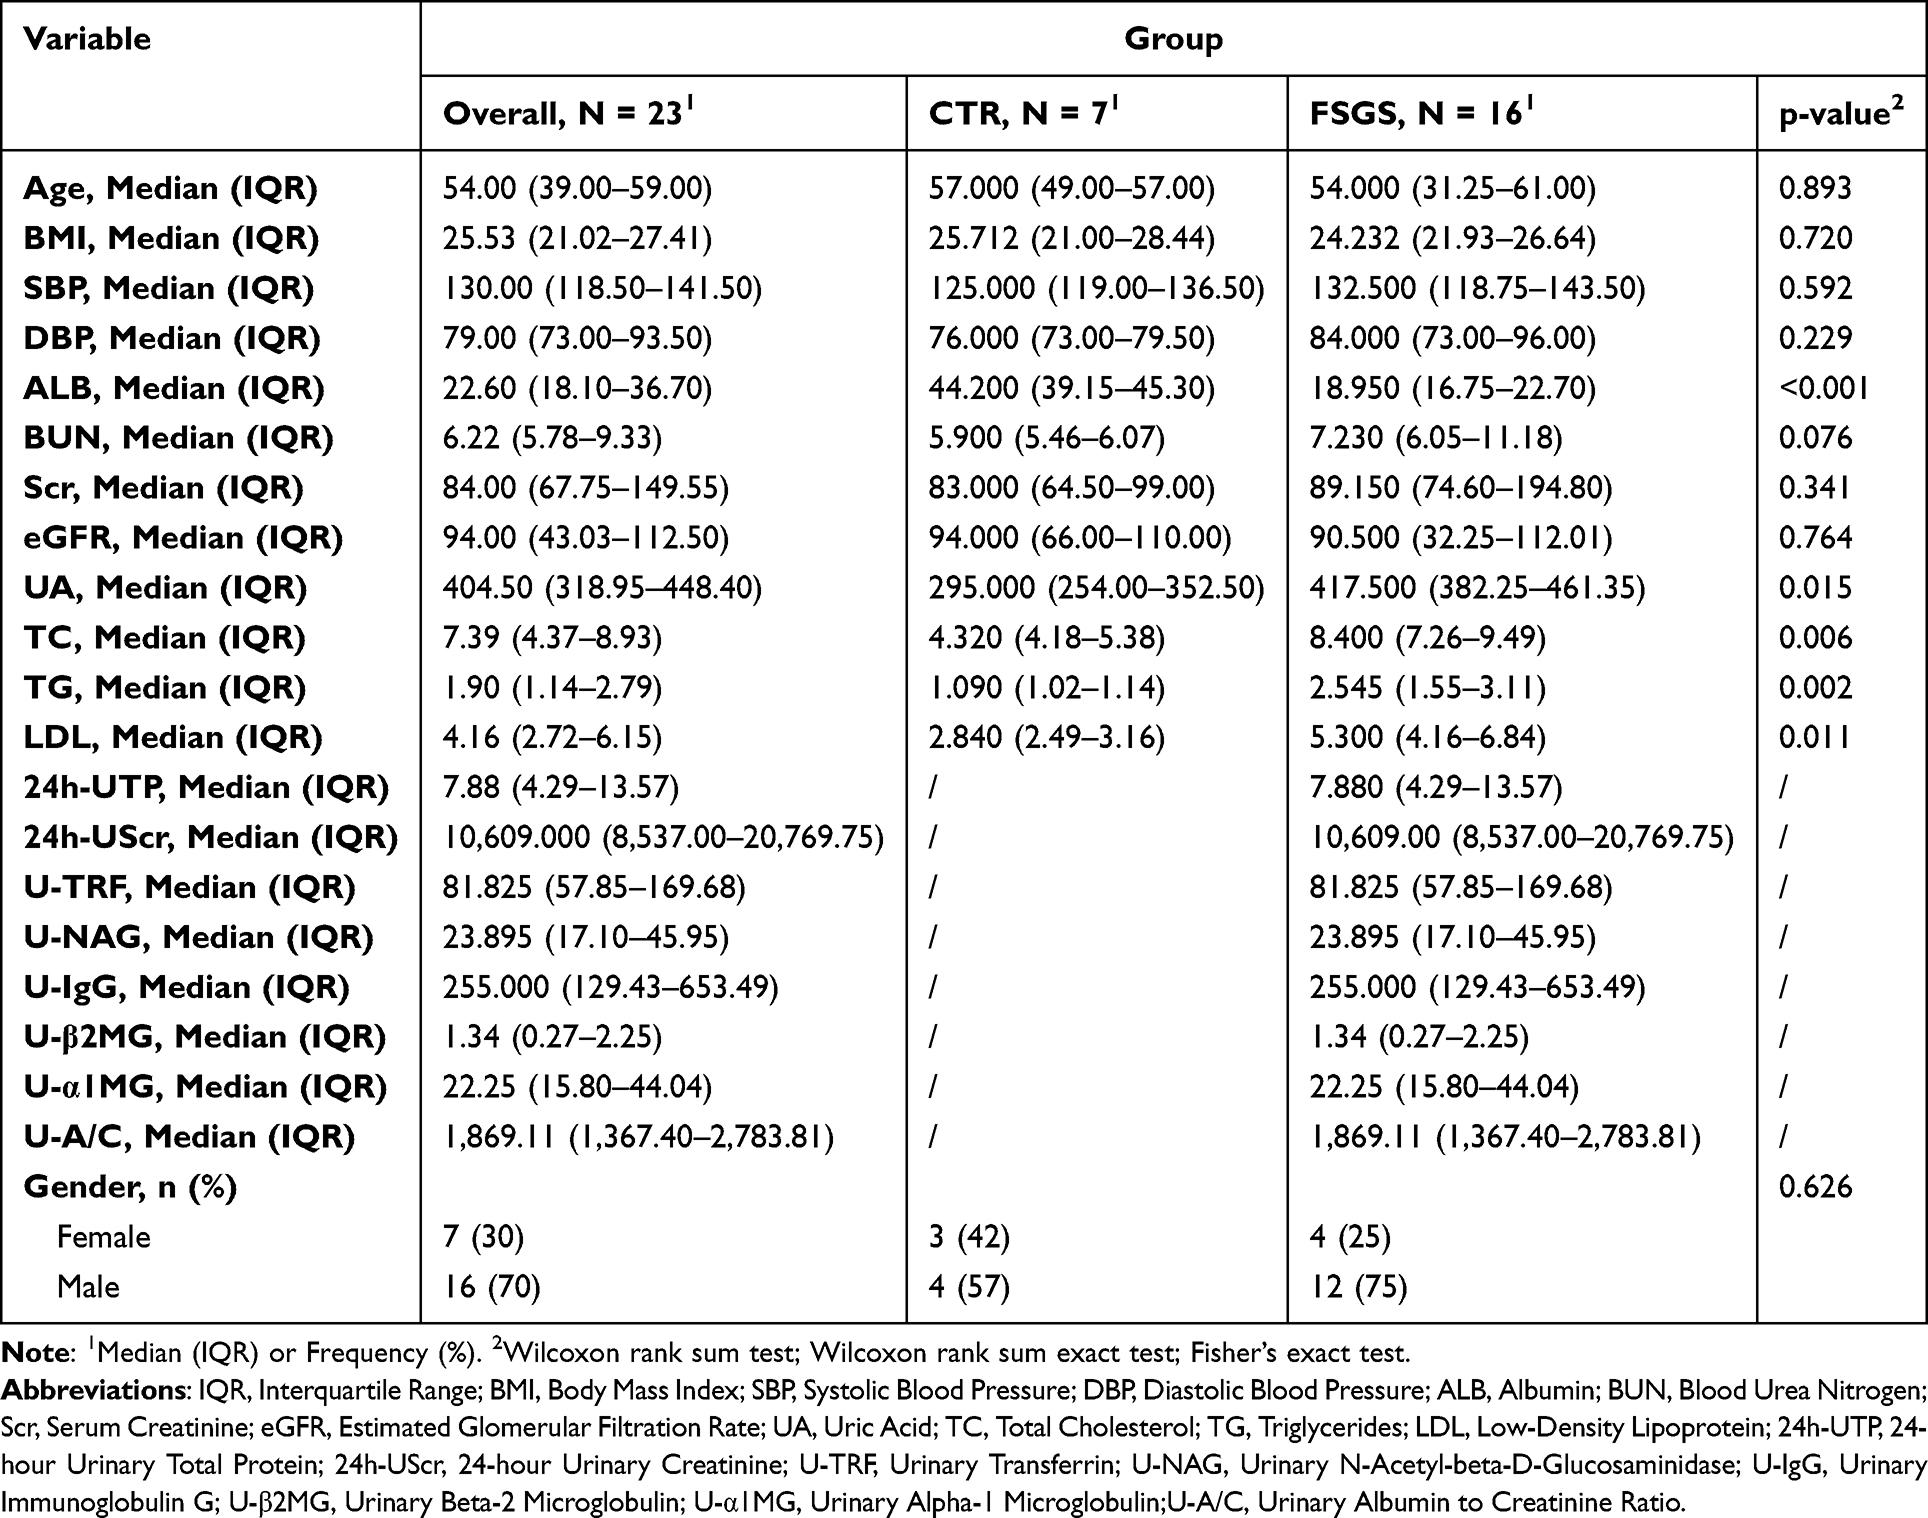 |
Table 2 Baseline Characteristics of FSGS Patients and Control Subjects |
Statistics
All the statistical analyses were executed via R software (Version: 4.2.2). Fisher’s exact test was used for the analysis of categorical data, whereas Pearson’s correlation coefficient was used for the examination of continuous variables. The identified pathways were visualized in a heatmap generated by the “pheatmap” package in R. The kappa statistic served as a quantitative measure of the concordance between the predicted and actual subtypes. For statistical comparisons involving more than two groups, the Kruskal‒Wallis test was applied, whereas the Wilcoxon rank‒sum test was used for comparisons between two groups.29 A two-tailed P value of less than 0.05 was considered statistically significant.
Results
Normalization and Comparative Analysis of Signaling Pathway Activation in FSGS Patients Across Multiple Cohorts
We initially included three cohorts: GSE133288, GSE108109, and GSE108112. Owing to the cohorts originating from different datasets, we performed batch normalization procedures to eliminate batch effects caused by sequencing operations. We subsequently utilized gene set enrichment analysis (GSEA) to assess the activation levels of different cellular signaling pathways in all included samples. Within each cohort, we compared the signaling pathways with differential activation levels between FSGS patients and LD patients. Signaling pathways exhibiting a log2-fold change greater than 0.5 and a P value less than 0.001 were considered statistically significant. In the GSE133288 cohort, 34 signaling pathways were significantly activated in FSGS patients (Figure 1A); in the GSE108109 cohort, 166 signaling pathways were significantly activated (Figure 1B); and in the GSE108112 cohort, 28 pathways were activated (Figure 1C). Ultimately, we identified a total of 5 signaling pathways that were significantly activated in FSGS patients. On the basis of the consistent results from the three cohorts (Figure 1D), the pathways focused on T-cell extravasation, regulation of T-cell extravasation, mitotic nuclear envelope reassembly, response to defense, and polyamine transport. After removing the duplicated genes, we obtained 31 unique genes for subsequent analysis (Figure 2A). We also verified the potential functions of these 31 genes via the MetaScape website (https://metascape.org/), which was consistent with the enrichment of pathways related to T-cell extravasation and polyamine transmembrane transport, as well as pathways related to leukocyte migration, signaling by interleukins and the inflammatory response (Figure 2B and C).
 |
Figure 1 Differential pathway analysis in the focal segmental glomerulosclerosis (FSGS) cohort. (A–C) Volcano plots for cohorts GSE133288 (A), GSE108109 (B), and GSE108112 (C). Each plot shows -log10 p values (y-axis) against log2-fold changes (x-axis) for the differentially expressed pathways. Significantly activated pathways are indicated in red (p value < 0.05 and log2-fold change (FC) > 0.3 or 0.5), whereas nonsignificant pathways are shown in gray. (D) Venn diagram summarizing the overlap of significantly activated pathways across the three cohorts, with the number of shared pathways indicated in the intersecting areas. The five pathways that were consistently activated across all cohorts are highlighted next to the Venn diagram. The bar plot below the Venn diagram represents the number of significant pathways unique to or shared between the cohorts, labeled on the x-axis. Abbreviation: NS, not significant. |
 |
Figure 2 Key Consensus Gene Expression and Enrichment Analysis in focal segmental glomerulosclerosis (FSGS). (A) Heatmap showing the expression of 31 overlapping genes across FSGS patient samples and living donor (LD) samples within the GSE133288, GSE108109, and GSE108112 cohorts. The expression levels are color-coded, with red indicating upregulation, black indicating no significant change, and white indicating downregulation. The genes are listed on the right, with cohort identifiers at the bottom. (B) Bar chart displaying the significance of pathway enrichment for the 31 genes, based on the -log10 (p-value). The chart highlights the pathways most implicated in FSGS, such as T-cell extravasation and polyamine transmembrane transport. (C) Network diagram illustrating the connections between the 31 genes and their associated pathways, indicating complex interactions and the potential roles of these genes in key biological processes relevant to FSGS pathogenesis. |
The FSGS Diagnostic Model Was Developed via Machine Learning Approaches
As delineated in the methodology, the construction of the diagnostic model included 101 different algorithms. Among these methods, the results of 73 combinational methods were successfully produced, with the remainder potentially unsuitable for the present study owing to the limited quantity of input data. The AUC values for each method, as depicted in Figure 3A, indicate that the Ridge, Enet, GBM, LDA and NaiveBayes models achieved the best prediction values, with an average AUC value of 1, with the requirement of a total of 31 enrolled genes, which presents a considerable challenge for clinical application. Therefore, we chose a two-step model, glmBoost+Ridge, which not only demonstrated a high AUC value of 0.998 but also necessitated only 6 input genes, including BANF1, TUSC2, SMAD3, TGFB1, CD99, and OAZ2. The prediction score can be calculated via the following equation: score = (0.3997×BANF1) + (0.5543×TUSC2) + (0.5279×SMAD3) + (0.4118×TGFB1) + (0.8665×CD99) + (0.5996×OAZ2). Additionally, the predictive value of this model was corroborated through kappa analysis, which revealed significant concordance in GSE133288 (Kappa = 1.000, P < 0.001), GSE108109 (Kappa = 0.906, P < 0.001), and GSE108112 (Kappa = 1.000, P < 0.001) (Figure 3B), as well as the preferable AUC values (GSE133288: AUC = 1.000, GSE108109: AUC = 0.994, GSE108112: AUC = 1.000, Figure 3C).
 |
Figure 3 Machine Learning Model Performance and Diagnostic Accuracy in focal segmental glomerulosclerosis (FSGS). (A) Heatmap displaying the area under the receiver operating characteristic curve (AUC) values for various machine learning algorithm combinations across three cohorts (GSE133288, GSE108109, and GSE108112). Each cell in the heatmap corresponds to an algorithm combination, with color intensity representing the AUC value (legend at the bottom left), indicating the model’s performance from 0.5 (chance level) to 1.0 (perfect discrimination). (B) Kappa consistency heatmaps showing the concordance between actual clinical diagnoses and predictions made by the best-performing machine learning model in each cohort. The numbers within the cells represent the number of samples for which the diagnosis was correctly predicted (LD: living donors). (C) Receiver operating characteristic (ROC) curves for the performance of the glmBoost+Ridge model in differentiating FSGS patients from LDs in each cohort, with AUC values indicating the model’s accuracy. Note: Ridge (L2 reg.), Enet[α=x] (Elastic Net with α values ranging from 0.1 to 0.9, representing different mixes of L1 and L2 regularization), GBM (Gradient Boosting Machine), LDA (Linear Discriminant Analysis), NaiveBayes, and their combinations with glmBoost (boosting ensemble method). Additionally, stepwise regression methods (Stepglm[forward], Stepglm[backward], Stepglm[both]) with forward selection, backward elimination, and both strategies were applied to enhance model performance. |
Confirming the Diagnostic Performance in Independent Cohorts
To ascertain the efficacy of the diagnostic model we developed, we harvested samples from the external independent cohort of GSE104948. Employing the previously established methodology, we conducted predictive analyses using 73 models across these separate cohorts. Notably, the glmBoost+Ridge model demonstrated exceptional diagnostic precision, as depicted in Figure 4A, yielding the following outcomes: GSE104948_GPL22945 (AUC=0.910, Kappa=0.688, P < 0.001) and GSE104948_GPL24120 (AUC=0.775, Kappa=0.530; P=0.030; Figure 4B and C). The overall prognostic value of this model for the overall sample in GSE104948 was approximately 0.885 (Figure 4C). These findings suggest that the model’s predictive validity is remarkably robust and holds promise for effective clinical application.
 |
Figure 4 Validation of the focal segmental glomerulosclerosis (FSGS) diagnostic model in an independent cohort. (A) Heatmap depicting the area under the receiver operating characteristic curve (AUC) for 73 machine learning models, including the glmBoost+Ridge model, validated against the independent cohort GSE104948. The AUC values range from 0.5 (indicated by white color, representing chance level) to 1.0 (indicated by dark blue color, representing perfect prediction). The glmBoost+Ridge model shows superior performance, with high AUC values. (B) Kappa statistics heatmap comparing the actual and predicted FSGS and living donor (LD) classifications in the GSE104948 cohort, split by the GPL platform. The counts in the heatmap represent the number of correctly predicted samples. High kappa values suggest strong concordance, indicating that the glmBoost+Ridge model has high reliability. (C) Receiver operating characteristic (ROC) curves for the glmBoost+Ridge model for two GPL platforms of the GSE104948 cohort and the combined overall samples, demonstrating the model’s diagnostic accuracy. The AUC values are annotated within the plots, confirming the model’s effectiveness in clinical diagnostics across diverse datasets. |
Expression of 6 Characteristic Genes in FSGS Patients
The glmBoost+Ridge model incorporates 6 genes into the diagnostic model for FSGS. To analyze the behavior of these genes, their expression differences between FSGS patients and LDs were examined across three cohorts. The expression levels of the genes BANF1, TUSC2, SMAD3, TGFB1, CD99 and OAZ2 were assessed. In the combined cohort of GSE133288, GSE108109, and GSE108112, we observed elevated expression of all six genes in FSGS patients compared with LD patients (all P < 0.05, Figure 5A). With respect to the validation GSE104948 cohort, similar patterns were observed; the elevated levels of genes in FSGS patients were observed not only in TUSC2, CD99 and OAZ2 but also in BANF1 and SMAD3 (Figure 5B). These findings suggest that BANF1, TUSC2, SMAD3, TGFB1, CD99 and OAZ2 play significant roles in distinguishing FSGS from LDs and could serve as potential biomarkers for the diagnosis of FSGS.
 |
Figure 5 Gene expression analysis for focal segmental glomerulosclerosis (FSGS) diagnosis. (A) Box plots depicting the expression levels of six genes (BANF1, TUSC2, SMAD3, TGFB1, CD99, and OAZ2) used in the glmBoost+Ridge diagnostic model for FSGS. The expression data from the combined cohorts GSE133288, GSE108109, and GSE108112 were compared between FSGS patients and living donors (LD), with significant upregulation of all genes observed in FSGS patients (p < 0.05). (B) Validation of gene expression in an independent cohort, GSE104948, which showed similar upregulation patterns in FSGS patients, particularly for CD99 and OAZ2. The plots show median values, interquartile ranges, and outlier points, highlighting the differential expression, which supports the use of these genes as biomarkers for FSGS diagnosis. Abbreviation: ns, not significant. Notes: *, P < 0.05; ***, P < 0.001; ****, P < 0.0001. |
Relationships Between Key Biomarkers and the Infiltration of Immune Cells
Subsequent investigations investigated the associations between CD99 and OAZ2 expression and the degree of immune cell infiltration in FSGS patients. The CD99 gene was found to be correlated with diverse immune cells, with the most pronounced positive correlations with natural killer cells, plasmacytoid dendritic cells and type 1 T helper cells (Figure 6A and C). Furthermore, OAZ2 was also positively correlated with an array of immune cells, with the most substantial links observed with natural killer cells (Figure 6B and D).
 |
Figure 6 Correlations of the biomarkers CD99 and OAZ2 with immune cell infiltration in FSGS patients. (A) Bubble chart representing the correlation between CD99 expression and the infiltration level of various immune cells in FSGS patients. The size of each bubble indicates the strength of the correlation (abs(cor)), and the color signifies the p value. Natural killer cells, plasmacytoid dendritic cells, and type 1 T helper cells presented the most significant positive correlations. (B) A similar bubble chart for OAZ2, illustrating its positive correlation with immune cell populations, most notably with natural killer cells. (C) Scatter plot with a fitted line displaying the positive correlation between CD99 gene expression and natural killer cell infiltration levels, with a Pearson correlation coefficient (r) of 0.6 and a p value < 0.001. (D) Scatter plot for OAZ2 showing its positive correlation with natural killer cell infiltration, with a Pearson correlation coefficient (r) of 0.31 and a p value < 0.001. The strength of these correlations highlights the potential of CD99 and OAZ2 as markers for immune involvement in FSGS patients. Abbreviations: TPM, Transcripts per million; NES, Normalized enrichment score; n, Number of samples; r, Pearson’s correlation coefficient; MDSC, Myeloid-derived suppressor cells; cor, Correlation. |
Validation of Key Biomarkers in FSGS
To validate the significance of the identified markers, we conducted a comprehensive analysis of patients with FSGS (Table 2). Pathological diagnostic results from clinical patients revealed substantial structural and immunological alterations in kidney tissues via various staining techniques (Figure 7A). Immunohistochemical analysis revealed a pronounced increase in CD99, OAZ2, and NK-p46 expression in FSGS patients compared with controls, with quantitative analysis confirming statistically significant increases (nonparametric t test, P < 0.05; Figure 7B‒G). Specifically, the immunohistochemistry results indicate that CD99, OAZ2, and NK-p46 are expressed at significantly higher levels in the glomeruli and tubulointerstitial tissues of FSGS patients than in those of control individuals. Collectively, these findings underscore the pathological changes and immune cell infiltration characteristics of FSGS, identifying CD99, OAZ2, and NK-p46 as critical biomarkers and highlighting the pivotal role of natural killer cells in the disease mechanism.
 |
Figure 7 Validation of Pathological and Immunological Markers in focal segmental glomerulosclerosis (FSGS) patients. (A) Pathological diagnostic results of clinical FSGS patients, showing structural and immunological changes in kidney tissues via hematoxylin and eosin (HE), periodic acid-Schiff (PAS), periodic acid-Schiff methenamine (PASM), and Masson’s trichrome (MASSON) staining techniques. (B–G) Immunohistochemical validation of OAZ2, CD99, and NK-p46 expression in FSGS patients and controls (CTR). (B–D) Representative images of immunohistochemical staining for OAZ2, CD99, and NK-p46 expression in FSGS patients and controls. (E–G) Quantitative analysis showing a significant increase in OAZ2, CD99, and NK-p46 expression in FSGS patients compared with controls (nonparametric t test, **, P < 0. 01; ***, P < 0.001). |
Discussion
FSGS is a prevalent glomerular disease characterized by segmental glomerulosclerosis and tubulointerstitial lesions. Clinically, it presents with proteinuria and declining renal function and can progress to end-stage renal disease (ESRD). While the precise etiology of FSGS remains elusive, evidence suggests that genetic factors, immune abnormalities, and environmental influences all contribute to its development.1 Given the complex and heterogeneous nature of FSGS, traditional clinical and pathological approaches fail to fully elucidate its molecular mechanisms. Consequently, bioinformatics analyses offer valuable insights into potential molecular markers and signaling pathways implicated in the onset or progression of FSGS, paving the way for novel diagnostic and therapeutic strategies.
In this study, we performed an extensive analysis using publicly available gene expression datasets from the GEO database, which included samples from 163 FSGS patients and 42 control subjects. Our results highlight significant biological pathways activated in FSGS patients, such as T-cell extravasation and polyamine transport, alongside the identification of 31 unique key genes, which are critical to the disease’s pathology. The primary contribution of our study lies in the development of a robust diagnostic model using a combination of 73 machine learning algorithms, where the glmBoost+Ridge model demonstrated an outstanding AUC of 0.998. This suggests that the model, based on the six identified key genes (BANF1, TUSC2, SMAD3, TGFB1, CD99, and OAZ2), holds significant potential for diagnostic accuracy in distinguishing FSGS patients from healthy controls. The high AUC value and the robustness of the model across different cohorts underscore its diagnostic potential, which could be a valuable tool in clinical practice for the early detection and differentiation of FSGS. Furthermore, we conducted external validation which revealed that CD99 and OAZ2 exhibited the most significant differences between FSGS patients and healthy donors, reinforcing their potential as diagnostic biomarkers for FSGS. These findings support the use of CD99 and OAZ2 as possible diagnostic markers in clinical settings, facilitating a more precise and personalized approach to diagnosing FSGS. Additionally, by leveraging the GSVA package, we assessed immune cell composition in FSGS patients, revealing a significant correlation between CD99 and OAZ2 expression and the infiltration of natural killer cells and plasmacytoid dendritic cells. This insight into the immune landscape further emphasizes the relevance of our findings in understanding disease progression and could guide future therapeutic strategies targeting immune cell infiltration in FSGS.
Previous studies have shown that key intracellular signaling pathways, such as the TNF, TGF-β/Smad pathways, are activated following podocyte injury in FSGS patients. In Mariani et al’s23 study, they identified three subclusters (T1, T2, and T3) in kidney biopsies, with T3 showing the most severe clinical and molecular features, including lower eGFR, higher fibrosis, and a higher proportion of FSGS. T3 participants were more likely to progress to end-stage renal disease (ESRD). Molecular analysis highlighted TNF signaling as a key driver in T3, suggesting its potential as a therapeutic target in FSGS and chronic kidney disease. Epithelial‒mesenchymal transition (EMT) is a critical process in fibrosis, where epithelial cells lose their characteristics and acquire mesenchymal features, contributing to tissue remodeling and scarring.30 TGF-β1, a key regulator of fibrosis, induces EMT and fibrosis through both canonical (Smad-dependent) and non-canonical (non-Smad) signaling pathways.31 These pathways promote the activation of myofibroblasts, excessive production of extracellular matrix (ECM), and inhibition of ECM degradation, ultimately leading to tissue fibrosis. Smad proteins play a complex role in fibrosis regulation, exhibiting both pro-fibrotic and anti-fibrotic effects, including in the regulation of mesenchymal transition. Moreover, there is intricate crosstalk between TGF-β/Smads and other signaling pathways, further complicating the regulation of fibrosis. In the clinical trial of fresolimumab, a monoclonal anti-TGF-β1 antibody,32 the primary endpoint of proteinuria reduction was not achieved in patients with steroid-resistant focal segmental glomerulosclerosis (SR-FSGS). Despite this, the trial showed a trend toward reduced urinary protein/creatinine ratio with fresolimumab 1 mg/kg, suggesting potential therapeutic benefit. However, the study failed to meet its primary or secondary endpoints, likely due to its underpowered design. This highlights the complexity of targeting TGF-β signaling in kidney fibrosis and the need for further investigation in larger trials.
On the other hand, Yao et al33 demonstrated that BANF1 upregulation promoted glutamate-induced apoptosis of HT-22 cells by enhancing ROS generation. The BANF1 gene encodes the BAF protein, and obtusilactone B from Machilus Thunbergii, which binds to BAF, suppresses VRK1-mediated BAF phosphorylation, thereby inducing potent tumor cell death in vitro.34 The BAF chromatin remodeling complex plays a crucial role in the maintenance of HIV-1 latency, and small molecule inhibitors of BAF, such as Caffeic Acid Phenethyl Ester and Pyrimethamine, have been reported by Stoszko et al35 to induce the reversal of HIV-1 latency. These findings suggest that targeting BANF1 or its associated pathways may represent a potential therapeutic strategy for human disease.
CD99, encoded by the MIC2 gene, is a transmembrane molecule whose exact mechanism is not fully understood. It plays a role in critical biological processes, including cell adhesion, migration, death, differentiation, and transendothelial migration, and impacts inflammation, the immune response, and cancer-related processes. Maria et al36 reported that CD99 might enhance the antitumor activity of macrophages. Serena et al37 identified a population of leukemic progenitor cells (LPCs) with a CD34/CD123/CD25/CD99+ immunophenotype at the initial diagnosis of acute myeloid leukemia (AML) that overexpress the CD99 antigen, suggesting that this population is a target for monoclonal antibody therapy. The metalloproteases meprin α and meprin β exhibit proinflammatory activity and contribute to extracellular matrix (ECM) remodeling, and their expression is upregulated in chronic inflammation and fibrosis.38 CD99 on leukocytes is a substrate for meprin β, and meprin β activation of CD99 induces cell migration in vitro.39 Vijaya et al40 recently developed anti-CD99-A192 (α-CD99-A192) nanoparticles that are composed of α-CD99 single chain variable fragment, α-CD99-A192 exhibits specific binding to cells expressing CD99, these fusion proteins can increase apoptosis of acute myeloid leukemia cells. Our systematic analysis and immunohistochemical validation revealed that CD99 expression is upregulated in FSGS patients, highlighting its potential key role in disease pathogenesis and warranting further functional studies for confirmation.
OAZ2 (ornithine decarboxylase antizyme 2) is a member of the antizyme gene family. Antizymes inhibit the activity of ornithine decarboxylase (ODC), a key enzyme in polyamine biosynthesis, by promoting its proteasomal degradation via a ubiquitin-independent mechanism.41,42 Polyamines, including putrescine, spermidine, and spermine, have been shown to possess anti-inflammatory and immunosuppressive properties.43 However, their levels must be tightly regulated to prevent abnormal cell proliferation and tumor development. However, there is limited research on OAZ2 in disease contexts. Our immunohistochemical analysis of FSGS and adjacent noncancer kidney tissues revealed OAZ2 expression in both the renal tubules and interstitium, with significantly increased expression in FSGS patients. However, further biological experiments are needed to validate its function.
Meyrier et al’s44 findings suggest that FSGS is not a type of T-cell-driven autoimmune glomerulopathy, particularly in infection- and inflammation-related FSGS, where a closer association with NK cells is observed. Our systematic analysis revealed that the CD99 and OAZ2 genes had the highest correlation with natural killer cells. Immunohistochemical staining for NK-p46 revealed increased expression in FSGS patients, further supporting the involvement of NK cells in FSGS pathogenesis. Our study highlighted the pathological changes and immune cell infiltration characteristics in FSGS, identifying CD99 and OAZ2 as critical biomarkers and emphasizing the pivotal role of natural killer cells in the disease mechanism. However, the roles of these biomarkers in FSGS still need to be confirmed through further experimental studies.
There are certain limitations in the current study. First, we included only a small number of FSGS and control samples due to the limited availability of sequencing data, which may not fully represent the broader population. Future studies should incorporate a larger and more diverse population from different geographic regions to validate our new findings. Second, owing to the challenges in obtaining healthy control kidney tissue samples and the lack of demographic matching (eg, gender, age) in the included public datasets, future research should ensure proper demographic matching when collecting patient and control samples. Third, the current study is a preclinical scientific investigation that does not specifically consider cost‒benefit analysis. Identifying key markers to increase cost-effectiveness is essential to promote eventual clinical application.
Conclusion
The machine learning-based diagnostic model developed in this study demonstrates high accuracy and robustness, offering a promising tool for clinical application. Validation across multiple cohorts further confirms its potential as an effective diagnostic tool for FSGS.
Data Sharing Statement
The data that support the findings of this study, including any relevant details needed to reproduce the published results, are available from the corresponding author upon reasonable request.
Ethical Statement and Consent
The study was conducted in accordance with the Declaration of Helsinki (as revised in 2013) and was approved by the Medical Ethics Committee of the First Affiliated Hospital of Anhui Medical University (PJ2018-05-09). All enrolled patients provided written informed consent.
Acknowledgments
We extend our profound appreciation to the First Affiliated Hospital of Anhui Medical University for the essential resources and facilities that were pivotal in the execution of this research. Our gratitude is further extended to Jialin Meng (Department of Urology, the First Affiliated Hospital of Anhui Medical University) for their unwavering support, expert guidance, and invaluable contributions throughout the duration of this study. We are very grateful to all the participants in this research project.
Disclosure
The authors report no conflicts of interest in this work.
References
1. D’Agati VD, Kaskel FJ, Falk RJ. Focal segmental glomerulosclerosis. N Engl J Med. 2011;365(25):2398–2411. doi:10.1056/NEJMra1106556
2. De Vriese AS, Wetzels JF, Glassock RJ, Sethi S, Fervenza FC. Therapeutic trials in adult FSGS: lessons learned and the road forward. Nat Rev Nephrol. 2021;17(9):619–630. doi:10.1038/s41581-021-00427-1
3. Fogo AB. Causes and pathogenesis of focal segmental glomerulosclerosis. Nat Rev Nephrol. 2015;11(2):76–87. doi:10.1038/nrneph.2014.216
4. Hommos MS, De Vriese AS, Alexander MP, et al. The incidence of primary vs secondary focal segmental glomerulosclerosis: a clinicopathologic study. Mayo Clin Proc. 2017;92(12):1772–1781. doi:10.1016/j.mayocp.2017.09.011
5. Kiffel J, Rahimzada Y, Trachtman H. Focal segmental glomerulosclerosis and chronic kidney disease in pediatric patients. Adv Chronic Kidney Dis. 2011;18(5):332–338. doi:10.1053/j.ackd.2011.03.005
6. Sim JJ, Batech M, Hever A, et al. Distribution of biopsy-proven presumed primary glomerulonephropathies in 2000–2011 among a racially and ethnically diverse US population. Am J Kidney Dis. 2016;68(4):533–544. doi:10.1053/j.ajkd.2016.03.416
7. O’Shaughnessy MM, Hogan SL, Poulton CJ, et al. Temporal and demographic trends in glomerular disease epidemiology in the Southeastern United States, 1986–2015. Clin J Am Soc Nephrol. 2017;12(4):614–623. doi:10.2215/CJN.10871016
8. Gipson DS, Troost JP, Lafayette RA, et al. Complete remission in the Nephrotic Syndrome Study Network. Clin J Am Soc Nephrol. 2016;11(1):81–89. doi:10.2215/CJN.02560315
9. Parsa A, Kao WL, Xie D, et al. APOL1 risk variants, race, and progression of chronic kidney disease. N Engl J Med. 2013;369(23):2183–2196. doi:10.1056/NEJMoa1310345
10. Kitiyakara C, Kopp JB, Eggers P. Trends in the epidemiology of focal segmental glomerulosclerosis. Semin Nephrol. 2003;23(2):172–182. doi:10.1053/snep.2003.50025
11. O’Shaughnessy MM, Hogan SL, Thompson BD, Coppo R, Fogo AB, Jennette JC. Glomerular disease frequencies by race, sex and region: results from the International Kidney Biopsy Survey. Nephrol Dial Transplant. 2018;33(4):661–669. doi:10.1093/ndt/gfx189
12. Ekrikpo U, Obiagwu P, Chika-Onu U, et al. Epidemiology and outcomes of glomerular diseases in low- and middle-income countries. Semin Nephrol. 2022;42(5):151316. doi:10.1016/j.semnephrol.2023.151316
13. Dragovic D, Rosenstock JL, Wahl SJ, Panagopoulos G, DeVita MV, Michelis MF. Increasing incidence of focal segmental glomerulosclerosis and an examination of demographic patterns. Clin Nephrol. 2005;63(1):1–7. doi:10.5414/CNP63001
14. Ahn W, Bomback AS. Approach to diagnosis and management of primary glomerular diseases due to podocytopathies in adults: core curriculum 2020. Am J Kidney Dis. 2020;75(6):955–964. doi:10.1053/j.ajkd.2019.12.019
15. De Vriese AS, Sethi S, Nath KA, Glassock RJ, Fervenza FC. Differentiating primary, genetic, and secondary FSGS in adults: a clinicopathologic approach. J Am Soc Nephrol. 2018;29(3):759–774. doi:10.1681/ASN.2017090958
16. Liu J, Wang W. Genetic basis of adult-onset nephrotic syndrome and focal segmental glomerulosclerosis. Front Med. 2017;11(3):333–339. doi:10.1007/s11684-017-0564-1
17. Rosenberg AZ, Kopp JB. Focal segmental glomerulosclerosis. Clin J Am Soc Nephrol. 2017;12(3):502–517. doi:10.2215/CJN.05960616
18. Bouchireb K, Boyer O, Gribouval O, et al. NPHS2 mutations in steroid-resistant nephrotic syndrome: a mutation update and the associated phenotypic spectrum. Human Mutation. 2014;35(2):178–186. doi:10.1002/humu.22485
19. Nandlal L, Winkler CA, Bhimma R, et al. Causal and putative pathogenic mutations identified in 39% of children with primary steroid-resistant nephrotic syndrome in South Africa. Eur J Pediatr. 2022;181(10):3595–3606. doi:10.1007/s00431-022-04581-x
20. Hoy WE, Samuel T, Mott SA, et al. Renal biopsy findings among Indigenous Australians: a nationwide review. Kidney Int. 2012;82(12):1321–1331. doi:10.1038/ki.2012.307
21. Trachtman H, Desmond H, Williams AL, et al. Rationale and design of the Nephrotic Syndrome Study Network (Neptune) match in glomerular diseases: designing the right trial for the right patient, today. Kidney Int. 2024;105(2):218–230. doi:10.1016/j.kint.2023.11.018
22. Gadegbeku CA, Gipson DS, Holzman LB, et al. Design of the Nephrotic Syndrome Study Network (Neptune) to evaluate primary glomerular nephropathy by a multidisciplinary approach. Kidney Int. 2013;83(4):749–756. doi:10.1038/ki.2012.428
23. Mariani LH, Eddy S, AlAkwaa FM, et al. Precision nephrology identified tumor necrosis factor activation variability in minimal change disease and focal segmental glomerulosclerosis. Kidney Int. 2023;103(3):565–579. doi:10.1016/j.kint.2022.10.023
24. Grayson PC, Eddy S, Taroni JN, et al. Metabolic pathways and immunometabolism in rare kidney diseases. Ann Rheum Dis. 2018;77(8):1226–1233. doi:10.1136/annrheumdis-2017-212935
25. Mariani LH, Martini S, Barisoni L, et al. Interstitial fibrosis scored on whole-slide digital imaging of kidney biopsies is a predictor of outcome in proteinuric glomerulopathies. Nephrol Dial Transplant. 2018;33(2):310–318. doi:10.1093/ndt/gfw443
26. Hanzelmann S, Castelo R, Guinney J. GSVA: gene set variation analysis for microarray and RNA-seq data. BMC Bioinf. 2013;14:7. doi:10.1186/1471-2105-14-7
27. Subramanian A, Tamayo P, Mootha VK, et al. Gene set enrichment analysis: a knowledge-based approach for interpreting genome-wide expression profiles. Proc Natl Acad Sci USA. 2005;102(43):15545–15550. doi:10.1073/pnas.0506580102
28. Charoentong P, Finotello F, Angelova M, et al. Pan-cancer immunogenomic analyses reveal genotype-immunophenotype relationships and predictors of response to checkpoint blockade. Cell Rep. 2017;18(1):248–262. doi:10.1016/j.celrep.2016.12.019
29. Hazra A, Gogtay N. Biostatistics series module 3: comparing groups: numerical variables. Indian J Dermatol. 2016;61(3):251–260. doi:10.4103/0019-5154.182416
30. Meyrier A. Focal and segmental glomerulosclerosis: multiple pathways are involved. Semin Nephrol. 2011;31(4):326–332. doi:10.1016/j.semnephrol.2011.06.003
31. Meng XM, Nikolic-Paterson DJ, Lan HY. TGF-β: the master regulator of fibrosis. Nat Rev Nephrol. 2016;12(6):325–338. doi:10.1038/nrneph.2016.48
32. Vincenti F, Fervenza FC, Campbell KN, et al. A phase 2, double-blind, placebo-controlled, randomized study of fresolimumab in patients with steroid-resistant primary focal segmental glomerulosclerosis. Kidney Int Rep. 2017;2(5):800–810. doi:10.1016/j.ekir.2017.03.011
33. Yao X, Xu X, Hu K, Yang Z, Deng S. BANF1 promotes glutamate-induced apoptosis of HT-22 hippocampal neurons. Mol Biol Rep. 2023;50(11):9441–9452. doi:10.1007/s11033-023-08889-1
34. Kim W, Lyu HN, Kwon HS, et al. Obtusilactone B from Machilus Thunbergii targets barrier-to-autointegration factor to treat cancer. Mol Pharmacol. 2013;83(2):367–376. doi:10.1124/mol.112.082578
35. Stoszko M, De Crignis E, Rokx C, et al. Small molecule inhibitors of BAF; A promising family of compounds in HIV-1 latency reversal. EBioMedicine. 2016;3:108–121. doi:10.1016/j.ebiom.2015.11.047
36. Manara MC, Manferdini C, Cristalli C, et al. Engagement of CD99 activates distinct programs in Ewing Sarcoma and Macrophages. Cancer Immunol Res. 2024;12(2):247–260. doi:10.1158/2326-6066.CIR-23-0440
37. Travaglini S, Ottone T, Angelini DF, et al. CD99 as a novel therapeutic target on leukemic progenitor cells in FLT3-ITD(mut) AML. Leukemia. 2022;36(6):1685–1688. doi:10.1038/s41375-022-01566-5
38. Prox J, Arnold P, Becker-Pauly C. Meprin α and meprin β: procollagen proteinases in health and disease. Matrix Biol. 2015;44–46:7–13. doi:10.1016/j.matbio.2015.01.010
39. Arnold P, Otte A, Becker-Pauly C. Meprin metalloproteases: molecular regulation and function in inflammation and fibrosis. Biochim Biophys Acta mol Cell Res. 2017;1864(11 Pt B):2096–2104. doi:10.1016/j.bbamcr.2017.05.011
40. Vaikari VP, Park M, Keossayan L, MacKay JA, Alachkar H. Anti-CD99 scFv-ELP nanoworms for the treatment of acute myeloid leukemia. Nanomedicine. 2020;29:102236. doi:10.1016/j.nano.2020.102236
41. Mangold U, Hayakawa H, Coughlin M, Münger K, Zetter BR. Antizyme, a mediator of ubiquitin-independent proteasomal degradation and its inhibitor localize to centrosomes and modulate centriole amplification. Oncogene. 2008;27(5):604–613. doi:10.1038/sj.onc.1210685
42. Erales J, Coffino P. Ubiquitin-independent proteasomal degradation. Biochim Biophys Acta. 2014;1843(1):216–221. doi:10.1016/j.bbamcr.2013.05.008
43. Casero RA, Murray Stewart T, Pegg AE. Polyamine metabolism and cancer: treatments, challenges and opportunities. Nat Rev Cancer. 2018;18(11):681–695. doi:10.1038/s41568-018-0050-3
44. Meyrier AY. Treatment of focal segmental glomerulosclerosis with immunophilin modulation: when did we stop thinking about pathogenesis? Kidney Int. 2009;76(5):487–491. doi:10.1038/ki.2009.204
 © 2025 The Author(s). This work is published and licensed by Dove Medical Press Limited. The
full terms of this license are available at https://www.dovepress.com/terms
and incorporate the Creative Commons Attribution
- Non Commercial (unported, 3.0) License.
By accessing the work you hereby accept the Terms. Non-commercial uses of the work are permitted
without any further permission from Dove Medical Press Limited, provided the work is properly
attributed. For permission for commercial use of this work, please see paragraphs 4.2 and 5 of our Terms.
© 2025 The Author(s). This work is published and licensed by Dove Medical Press Limited. The
full terms of this license are available at https://www.dovepress.com/terms
and incorporate the Creative Commons Attribution
- Non Commercial (unported, 3.0) License.
By accessing the work you hereby accept the Terms. Non-commercial uses of the work are permitted
without any further permission from Dove Medical Press Limited, provided the work is properly
attributed. For permission for commercial use of this work, please see paragraphs 4.2 and 5 of our Terms.
Recommended articles
Awareness and Predictors of the Use of Bioinformatics in Genome Research in Saudi Arabia
Alomair L, Abolfotouh MA
International Journal of General Medicine 2023, 16:3413-3425
Published Date: 11 August 2023