Back to Journals » Journal of Pain Research » Volume 16
Development and Validation of Short Forms of the Pain Catastrophizing Scale (F-PCS-5) and Tampa Scale for Kinesiophobia (F-TSK-6) in Musculoskeletal Chronic Pain Patients
Authors Le Carré J, Luthi F ![]() , Burrus C
, Burrus C ![]() , Konzelmann M
, Konzelmann M ![]() , Vuistiner P
, Vuistiner P ![]() , Léger B
, Léger B ![]() , Benaïm C
, Benaïm C ![]()
Received 21 July 2022
Accepted for publication 31 December 2022
Published 20 January 2023 Volume 2023:16 Pages 153—167
DOI https://doi.org/10.2147/JPR.S379337
Checked for plagiarism Yes
Review by Single anonymous peer review
Peer reviewer comments 2
Editor who approved publication: Dr Robert Twillman
Joane Le Carré,1,2 François Luthi,2– 4 Cyrille Burrus,2,3 Michel Konzelmann,2,5 Philippe Vuistiner,1,2 Bertrand Léger,1,2 Charles Benaïm1,4
1Department of Medical Research, Clinique Romande de Réadaptation, Sion, Switzerland; 2Institute for Research in Rehabilitation, Clinique Romande de Réadaptation, Sion, Switzerland; 3Department of Musculoskeletal Rehabilitation, Clinique Romande de Réadaptation, Sion, Switzerland; 4Department of Physical Medicine and Rehabilitation, Lausanne University Hospital and University of Lausanne, Lausanne, Switzerland; 5Assessment and Consultation Department, Clinique Romande de Réadaptation, Sion, Switzerland
Correspondence: Joane Le Carré, Ave Grand-Champsec 90, Sion, 1950, Switzerland, Tel +41 27 603 20 73, Email [email protected]
Purpose: Chronic pain is a complex phenomenon. Understanding its multiple dimensions requires the use of a combination of several patient-reported outcome measures (PROMs). However, completing multiple PROMs is time-consuming and can be a burden for patients. The objective of our study was to simultaneously reduce the French versions of the Pain Catastrophizing Scale (PCS) and Tampa Scale for Kinesiophobia (TSK) questionnaires to enable their use in an ambulatory and clinical settings.
Patients and Methods: We conducted a clinical study between May 2014 and August 2020 in our rehabilitation center. 1428 chronic musculoskeletal pain patients (CMSP) were included. The originality of our approach is that the reduction method included qualitative as well as quantitative analyses. The study was divided into two parts: 1) reduction of the questionnaires (n=1363) based on internal consistency (item-to-total correlation), principal component analysis (item loadings), Rasch analysis (infit/outfit), floor and ceiling effect (quantitative analyses) and expert judgment of items (qualitative analysis), and 2) validation of the reduced questionnaires (n=65), including test–retest reliability (intraclass correlation coefficient [ICC]), homogeneity (Cronbach α), criterion validity (Pearson correlation [r] with the long-version score), determination of the pathological cutoff and Minimal Clinically Important Difference (MCID). The two full-length questionnaires include 30 items in total.
Results: The reduction resulted in a 5-item PCS (score 0– 20) and 6-item TSK (score 0– 24). Psychometric properties of the reduced questionnaires were all acceptable as compared with other version (α=0.89 and 0.71, ICC=0.75 and 0.60, r=0.86 and 0.70, MCID=2 and 2 for PCS and TSK, respectively) while keeping the structure and coherence of the long versions.
Conclusion: The two reduced versions of the PCS and TSK can be used in CMSP patient. As their administration only requires a few minutes, they can be implemented in outpatient consultation as well as in clinical settings.
Keywords: chronic musculoskeletal pain, CMSP, patient-reported outcomes measures, PROMs, Pain Catastrophizing Scale, PCS, Tampa Scale for Kinesiophobia, TSK
Introduction
Chronic pain is a worldwide problem and the source of huge medical and social costs. Prevalence of chronic pain ranges from 11% to 40% in the world’s population.1 In Switzerland, musculoskeletal diseases and injuries are the second leading cause of health costs: 8.7 billion Swiss francs per year (9.5 billion USD).2,3 Chronic musculoskeletal pain (CMSP) is also a multifactorial phenomenon defined by a complex interaction between biological, psychological and social factors4 that can lead to a physical deconditioning.5 Based on this observation, the fear-avoidance model (FAM)6–10 describes how people with musculoskeletal pain develop a chronic pain through thoughts that increase pain and cause disuse and disability. Psychological processes such as fear of movement and pain catastrophizing seem to be keys factors in the development of chronic pain.9 Indeed, high level of catastrophizing and kinesiophobia are associated with high level of self-reported and performance-based disability11–13 as well as perceived pain intensity.14–17 These factors are implicated in the chronicization of the pain. Thus, their detection is necessary for both research and clinical purposes to assist in clinical-decision making in order to optimize introduction of targeted therapeutic programs based on cognitive behavioral therapies.18,19 Moreover, measured from the onset of the chronic pain, it may be useful in identifying patients who are at risk of poor outcomes.
The Pain Catastrophizing Scale (PCS),20 and Tampa Scale for Kinesiophobia (TSK)21 are patient-reported outcomes measures (PROMs) frequently used for patients with chronic pain. These questionnaires evaluate catastrophizing thinking, and pain-related behaviors.
Completing multiple PROMs with a large number of items results in patients’ unwillingness because it takes too much time. Moreover, they also are costly and burdensome for clinicians (completion time, scoring, interpretation, management of missing data, data retention), so using them is almost impossible in the context of an outpatient medical consultation. The solution to a complex dilemma is rarely simplification,22 but reducing the size of several PROMs has been proposed by different teams23–28 as a workable solution. Provided that the psychometric qualities of the short version of the PROMs remain comparable, this is an elegant approach that deserves to be extended.
The aim of this study was to reduce the PCS and TSK questionnaires with an approach that includes qualitative and quantitative analyses and to validate their psychometric properties in a population of patients with CMSP. The two PROMs already have several reduced versions. However, they were all developed from purely quantitative analyses. Our method, as recommended by Stanton et al,29 is a combination approach including professional judgment of the relevance of items.
Materials and Methods
Study Design, Settings and Participants
The study was divided into two steps: 1) reduction of the questionnaires and 2) validation of the reduced versions. A validated mixed method was used to shorten the questionnaires.26,29,30 This approach is based on quantitative analysis and expert judgment of items. It allows for selecting items according to their clinical relevance in addition to their psychometric values. Then, we performed a validation step with test–retest reliability and comparison of the long and short versions of the questionnaires (Figure 1). Finally, the pathological threshold and the Minimal Clinical Important Difference (MCID) were determined.
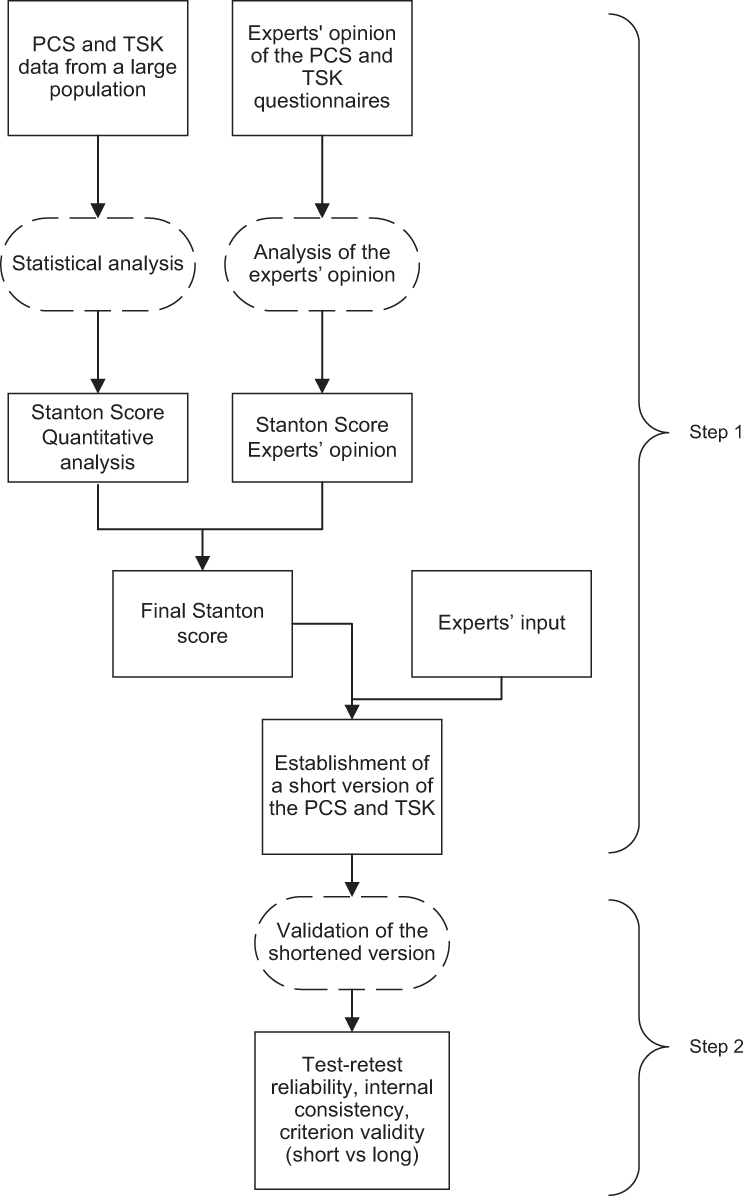 |
Figure 1 Study design scheme. Step 1: reduction of the PCS and TSK questionnaires. Step 2: validation of the reduced questionnaires. Abbreviations: PCS, Pain Catastrophizing Scale; TSK, Tampa Scale for Kinesiophobia. |
The clinical study took place in a center specialized in vocational rehabilitation after a musculoskeletal injury. Most of hospitalized patients are construction or industry workers with injuries from professional, leisure or traffic trauma. For reducing the questionnaires, all consecutive patients hospitalized in the Musculoskeletal Rehabilitation Department of our rehabilitation center between May 1, 2014 and June 30, 2017 after an orthopedic trauma were considered for inclusion. Inclusion criteria were age 18 to 65 years and CMSP lasting more than 3 months after an orthopedic trauma of the upper/lower limbs or spine. Portuguese, Spanish and Italian patients who did not read French well enough completed the questionnaires in their native language. Exclusion criteria were multiple trauma and neurological deficiencies. For the validation step, patients were recruited from February 1 to August 30, 2020. Patients had to have sufficient ability in French to be able to answer the short version of questionnaires. Terwee et al31 considered a sample size of 50 patients adequate to assess the reproducibility of a questionnaire. We decided to add 15 more patients to increase the precision of our results.
The study protocol was approved by the local ethics committee, the Commission Cantonale Valaisanne d’Ethique Médicale (CCVEM 034/12) and conducted according to the recommendations of the Declaration of Helsinki. All participants signed an informed consent form before enrolment. The study is reported according to the COnsensus-based Standards for the selection for health status Measurement INstruments (COSMIN) guidelines.32
Data Collected
For each patient, we collected sociodemographic variables: age, sex, education level (≤ or >9 years), employment contract at the time of the accident (yes/no), profession (skilled or unskilled worker/employee, business executive, other), spoken language, pain duration, and pain localization (upper limb, lower limb or back/neck).
PROMs
The PCS and TSK are validated PROMs with good psychometric properties.20,21,33,34
PCS: The PCS was developed by Sullivan et al20 to measure catastrophic thinking in relation to pain experience. It contains 13 items, each scored from 0 (“not at all”) to 4 (“always”), with a maximum total score of 52. A total PCS score > 30 suggests a clinically relevant level of catastrophizing. The PCS has good internal consistency (Cronbach α = 0.87) and good reliability (intraclass correlation coefficient [ICC]=0.75).20 The French version of the PCS has good psychometric properties, with Cronbach α = 0.87 and reliability = 0.85.35 To our knowledge, there is no official MCID for this questionnaire. The PCS takes about 5 min to complete.36
TSK: The TSK was proposed by Miller et al37 to measure fear of movement and (re)-injury. It contains 17 items, each scored on a 4-point Likert type scale: 4 items are inversely scored to detect poor responders. The total TSK score ranges from 17 to 68. We chose a cutoff according to sex as proposed by Roelofs et al:38 scores > 36 for women and 38 for men are associated with high fear of pain. There are many versions of the TSK,39 the Cronbach α ranging from 0.70 to 0.92 and test–retest reliability generally > 0.80. The Cronbach α is 0.71 for the French version.40 To our knowledge, no study has reported the test–retest reliability of the French version. There is no consensus regarding the MCID for TSK.
Step 1: Reduction of the Questionnaires
We followed the procedure described by Stanton et al.29 The method consists of scoring items on several characteristics to help a panel of experts make the best possible selection of a group of items. For each questionnaire, the items were scored by using five methods (four quantitative analyses + one expert judgment) (Table 1). At the end of each method, each item was scored from 0 to 2. Therefore, each item received a maximum of 10 points at the end of the procedure. Then, a group of experts made the final selection considering these results and other criteria such as their own clinical experience or the need to ensure the coherence of the reduced questionnaire (including keeping the most relevant items while avoiding redundancies). It was important to have input from a large panel of professionals who work routinely with patients, covering every different dimension of rehabilitation (medical and paramedical care, physiotherapy, occupational therapy, psychotherapy, socio-professional worker).
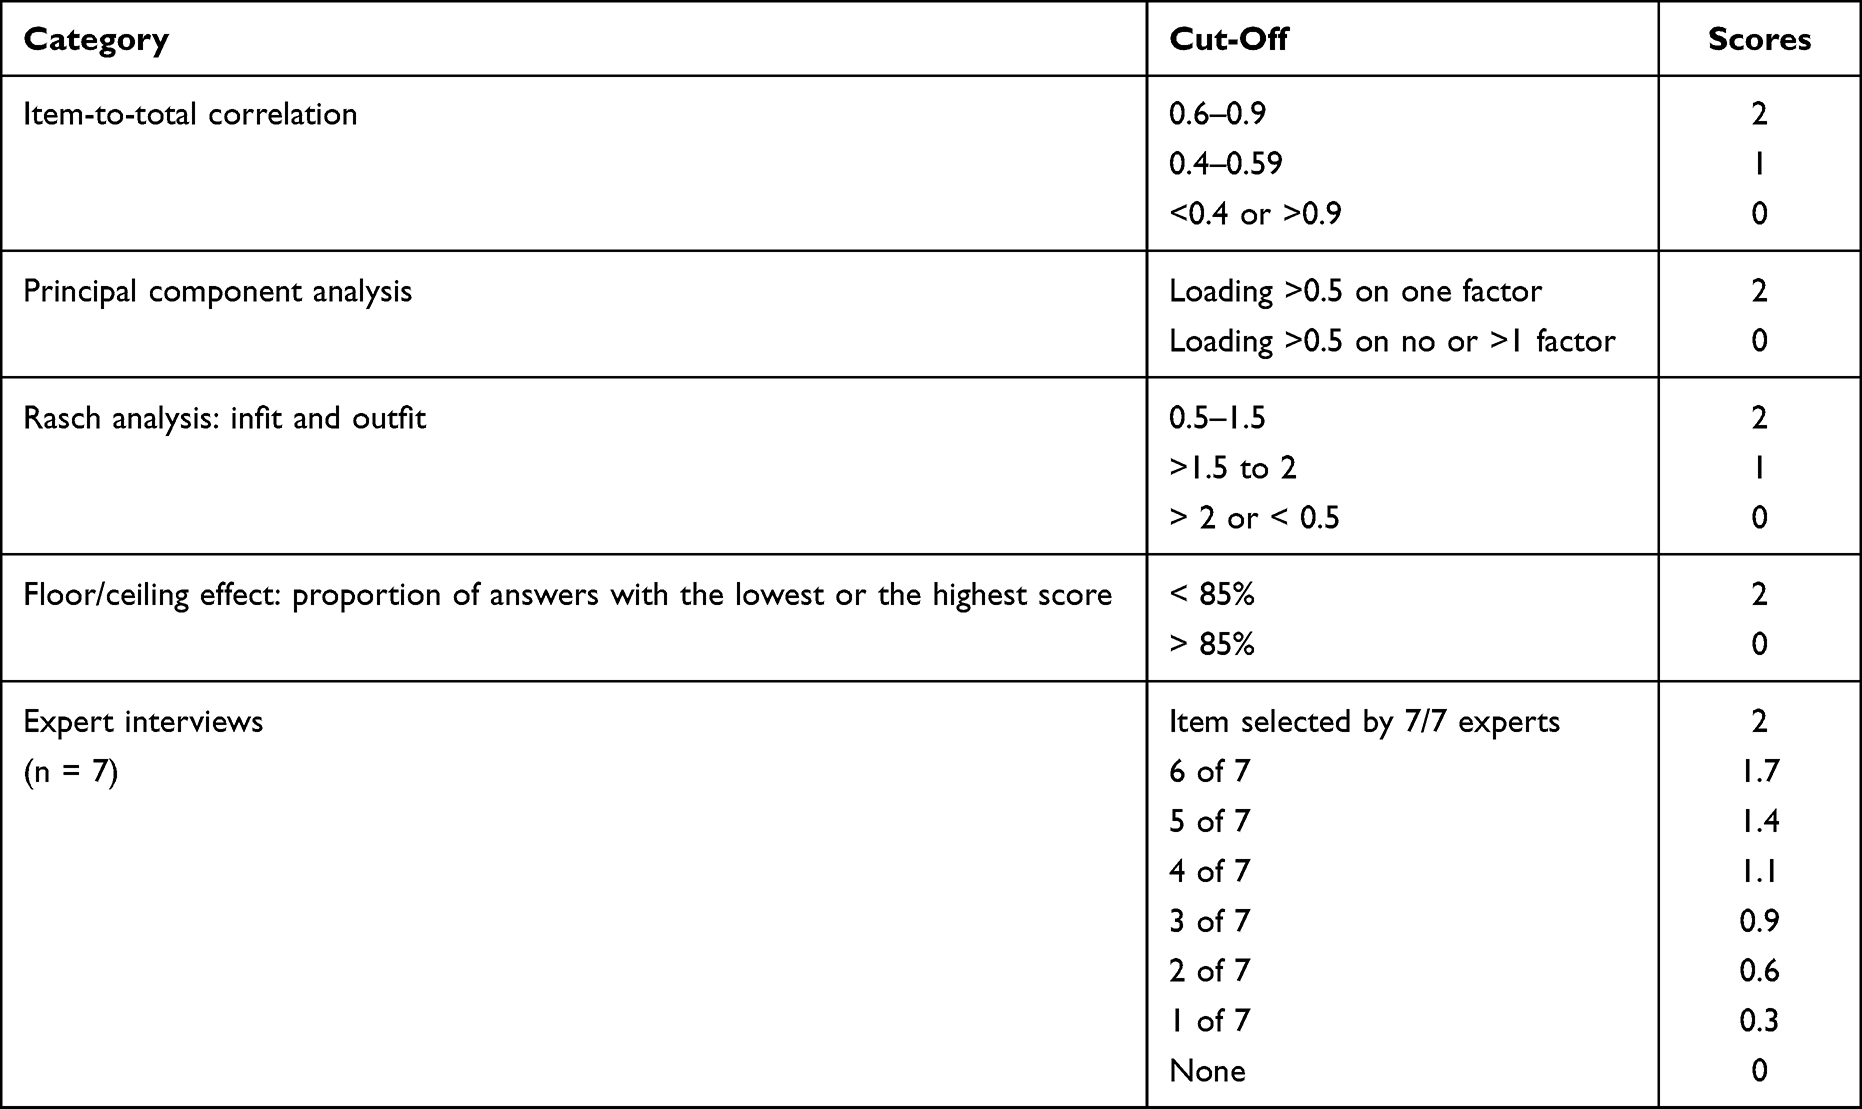 |
Table 1 Preselection of Items of the Two Questionnaires and Scoring According to the Stanton Criteria |
Quantitative Analysis
Different multiple-factor models were proposed for the TSK. The two-factor model comprising items linked to somatic focus (TSK-SF) and activity avoidance (TSK-AA) are the most extensively used. Some discrepancies exist in terms of which items are included in these two factors.41 In our clinic, we use only the total score of the TSK questionnaire to discriminate patients with high and low kinesiophobia. Thus, the reduced version of the TSK was based on one dimension. Therefore, we conducted two sets of analyses (PCS, TSK).
Internal Consistency
Internal consistency was evaluated with the item-to-total correlation. The Pearson correlation coefficient was calculated between each item and the total score.42 According to the Stanton criteria,29 a score of 2/2 is given for a correlation between 0.6 and 0.9, 0/2 for a correlation < 0.4 or > 0.9, and 1/2 otherwise (Table 1).
Principal Component Analysis (PCA)
The PCA involves building a new set of uncorrelated variables (factors) that are linear combinations of the original intercorrelated variables (items). Factors represent the uncorrelated underlying clinical dimensions assessed by the questionnaire. The coefficients of these linear combinations (factor loadings) may be interpreted as correlation coefficients between the items and the factors. PCA was performed with Varimax rotation to force the loadings to be either large or small for easier interpretation.43 We used the Kaiser’s criterion to determine the number of factors to retain in the analysis:44 eigenvalues (proportion of the explained variance) > 1. An item loading > 0.5 on one factor is interpreted as a good and specific representation of one clinical dimension of the questionnaire, so the item receives a Stanton score of 2/2. Loadings > 0.5 on no factor (the item poorly assesses the dimensions) or on more than one factor (the item assesses more than one dimension) receives a Stanton score of 0/2 (Table 1).
Rasch Analysis
According to the Rasch model,43 each questionnaire respondent can be mathematically located on a single axis (latent trait) that is supposed to measure the clinical dimension assessed by the questionnaire (eg, the intensity for kinesiophobia for TSK). The adequacy of a questionnaire to the Rasch model implies several hypotheses, and Stanton et al29 propose to use the unidimensionality indices “infit” and “outfit” to check the adequacy of the data to the Rasch model and to select the items to keep or not in a reduced version of a questionnaire.44 The Stanton score for each item was attributed as follows: both infit and outfit from 0.5 to 1.5 indicate good fit and score 2/2; both values < 0.5 or > 2 indicate insufficient fit and score 0/2; and other cases score 1/2 (Table 1).
Floor and Ceiling Effect
A ceiling effect occurs when more than 15% of participant scores are near the upper limit of the measure. The opposite is the floor effect.45 If an item receives the lowest or the highest score for more than 15% of the patients, it receives a score of 0/2 according to the Stanton criteria. For the other items, a score of 2/2 was attributed (Table 1).
IBM SPSS Statistics 27 and Winsteps 3.8 were used for statistical analyses.
Expert Opinions
Seven experts (1 rheumatologist, 1 physiatrist, 2 psychologists, 1 occupational therapist, 1 physiotherapist and 1 socio-professional worker) participated in the focus group. Experts had more than 5 years’ experience in the rehabilitation of patients with CMSP. Experts were asked to independently rate the three questionnaires and to select the most clinically relevant items related to CMSP patients. At this stage, experts were not provided with a recommendation on the number of items to be removed in order to avoid influencing their choice. The responses were “Yes/No”. The Stanton score for an item was the percentage of answers “Yes” multiplied by 2 to obtain a score from 0/2 to 2/2 (Table 1).
Final Item Selection
The same group of experts plus a moderator (physiatrist) who presented the quantitative results met to make the final selection. Discussions were held for each questionnaire to decide which items fit the best with routine clinical practice. Experts had to consider the overall Stanton score as well as the detailed results for each of the methods used. At first, they should not only judge each item individually but also evaluate items as a whole, keeping in mind that the different clinical aspects measured by a questionnaire should also be measured in its short version and that redundancies between items evaluating very similar clinical dimensions should be discarded. Of course, they had to favor the items with the highest Stanton scores. Finally, the moderator asked experts to keep about 1/3 of the items in each questionnaire as was the case for the QuickDASH.23
Step 2: Validation of the Reduced Questionnaires
Patients completed the short versions of the questionnaires on day 1 (test day) and day 4/5 (retest day) and the long versions on day 2 (Figure 2). The “test” questionnaires (day 1) were given to patients together with other questionnaires systematically completed on admission in our clinic, whereas the “retest” questionnaire (day 4/5) was given alone. We considered that a “fatigue” or “lassitude” effect was more likely to be observed in the answers to the “test” rather than the “retest” questionnaire and therefore that the answers to the latter were likely to be more reliable. For this reason, we decided to use the responses to the second short questionnaires for validity and for estimating the threshold and the MCID (calculation of the standard deviation, which is part of the standard error of measurement [SEM] formula, see below).
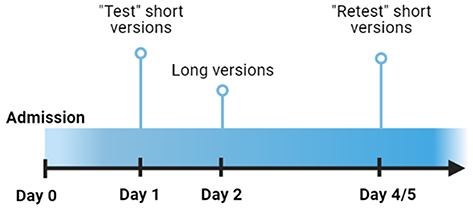 |
Figure 2 Timeline Of Questionnaire Administration. |
Participants
Between February 1 and August 30, 2020, all consecutive eligible French-speaking patients were selected to participate in the validation step.
Psychometric Analysis
Internal Consistency
Internal consistency refers to the homogeneity of the questionnaire (ie, checking to what extent the questionnaire’s items measure the same concept). It was estimated with the Cronbach α. Acceptable values range from 0.70 to 0.95, depending on the report.46
Reliability
Test–retest reliability measures the reliability of the questionnaire over time. It was assessed with the ICC(2,1), two-way random, single measure, absolute agreement.47 An ICC > 0.80 was considered “excellent”, 0.71 to 0.80 “good”, 0.51 to 0.70 “moderate”, 0.31 to 0.50 “poor” and < 0.30 no correlation.48 The Bland-Altman plot was used to visually check for reliability (Supplementary Data 1).
Criterion Validity
Criterion validity estimates how well one measure is correlated with a “gold standard”. The long-version scores of the questionnaires were considered the “gold standard” and correlations with the short-version scores were calculated.48 Pearson correlation coefficients > 0.7 were expected.42
MCID and SEM
The MCID indicates the minimal change in score that the questionnaire should measure to represent a real change considered clinically relevant by patients and physicians. In the absence of an anchor, MCIDs were estimated with one of the most widely used distribution-based methods with the following formula:49,50  , where SD = standard deviation of the change. Because the responses to the questionnaires are integers, the MCID was defined as the smallest integer greater than the SEM. For example, for a SEM = 0.7, the MCID is 1.
Determination of the Thresholds
The scores of the short versions were compared with the pathological thresholds for the long versions (PCS: 30/52; TSK: 38/68 for men and 36/68 for women) with receiver operating characteristic curves. For each short version, the optimal cutoff was defined as the one that gave the highest Youden index (sensitivity + specificity – 1).51
Results
Step 1: Reduction of the Questionnaires
Participants
Between May 1, 2014 and June 30, 2017, 1796 patients were admitted for a musculoskeletal rehabilitation program for chronic pain following a musculoskeletal injury. For the quantitative analysis, 1363 patients were eligible for inclusion. A total of 1266 questionnaires for the PCS and TSK were available for analysis (Figure 3).
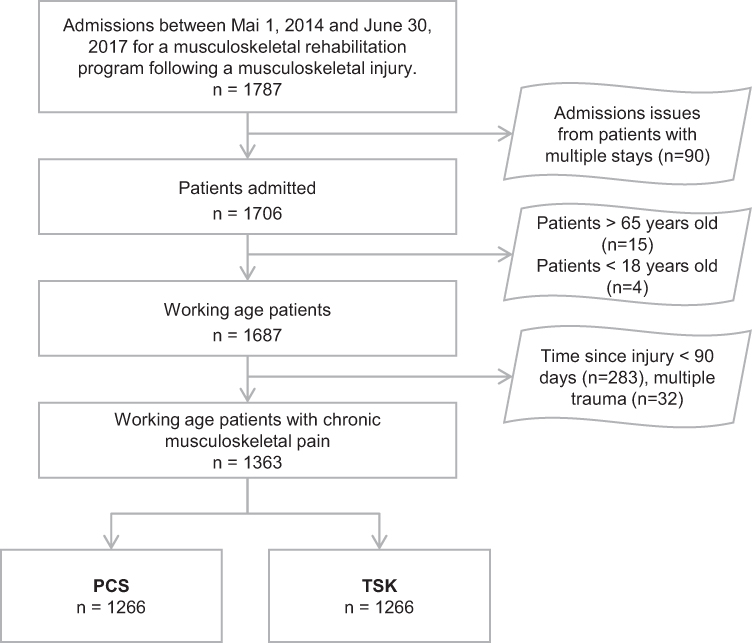 |
Figure 3 Flow Diagram Of Patient Inclusion And Number Of Completed PCS And TSK Questionnaires In The First Step Of The Study. Abbreviations: PCS, Pain Catastrophizing Scale; TSK, Tampa Scale for Kinesiophobia. |
The main characteristics of patients are in Table 2. Patients included were mainly middle-aged (median 45 years [interquartile range (IQR) 35–53] and men (88%) with chronic pain due to a musculoskeletal injury that occurred at a median of 12 months [IQR 8.3–20.7] previous. Pain localization was equally distributed between upper and lower limbs, and 15% of the patients had neck/back pain. In all, 57% of patients had ≤ 9 years of school education, 84% were workers and 57% were in an employment contract at time of rehabilitation. Most (85%) patients were fluent French speakers.
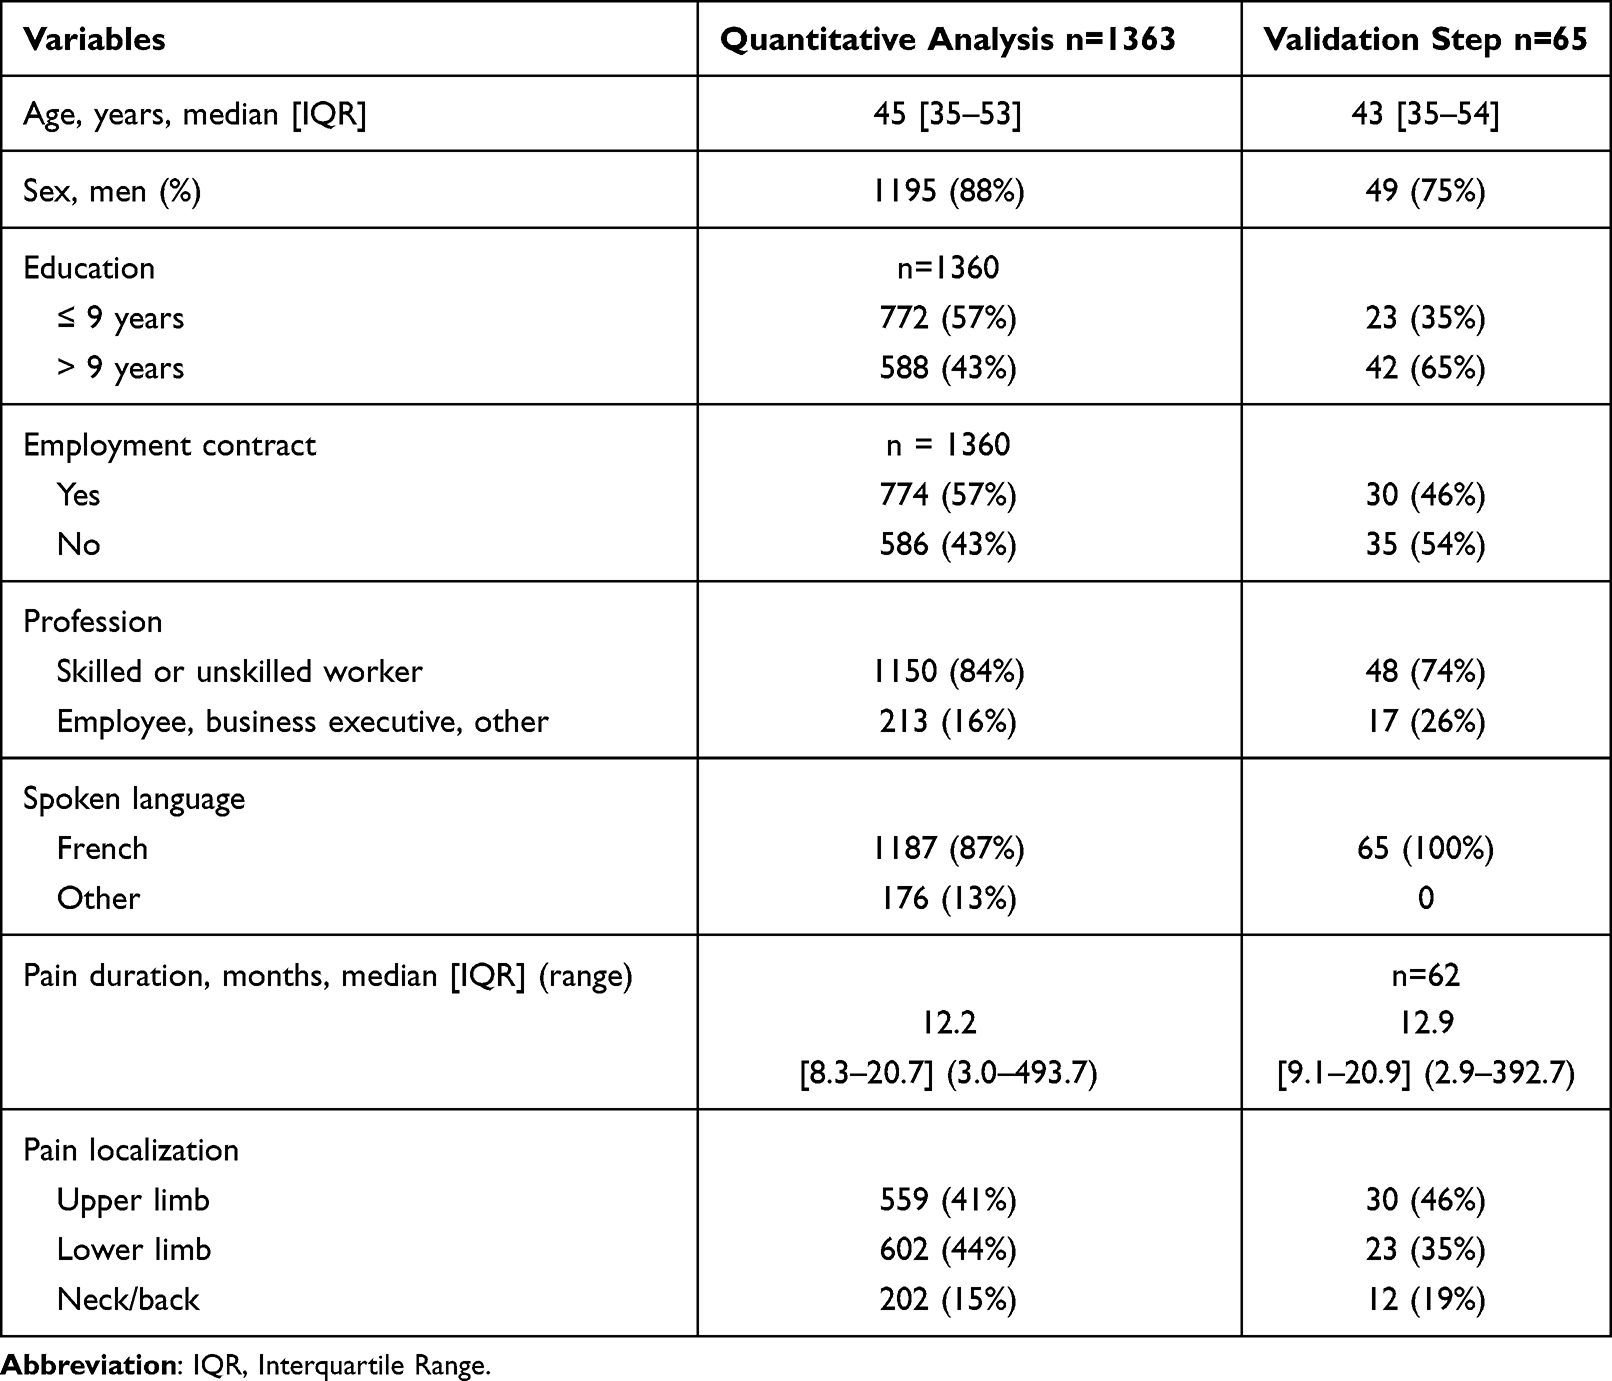 |
Table 2 Socio-Demographic Characteristics of Patients |
Quantitative Analysis (Table 3)
The median global Stanton score for the 30 items was 8.2/10 (IQR 7.1–9.1). For the item-to-total correlation analysis, 15 items scored < 2. For the PCA, 6 items scored 0/0; all others scored 2/2. Most of the items with a score < 2 belonged to the TSK questionnaire, with 15 items scoring < 2 in the item-to-total analysis (88% of all items) and 5 items scoring < 2 in the PCA analysis (29% of all items). All items scored 2/2 in the floor/ceiling and Rasch analyses. For the experts, values ranged from 0.3 to 2.
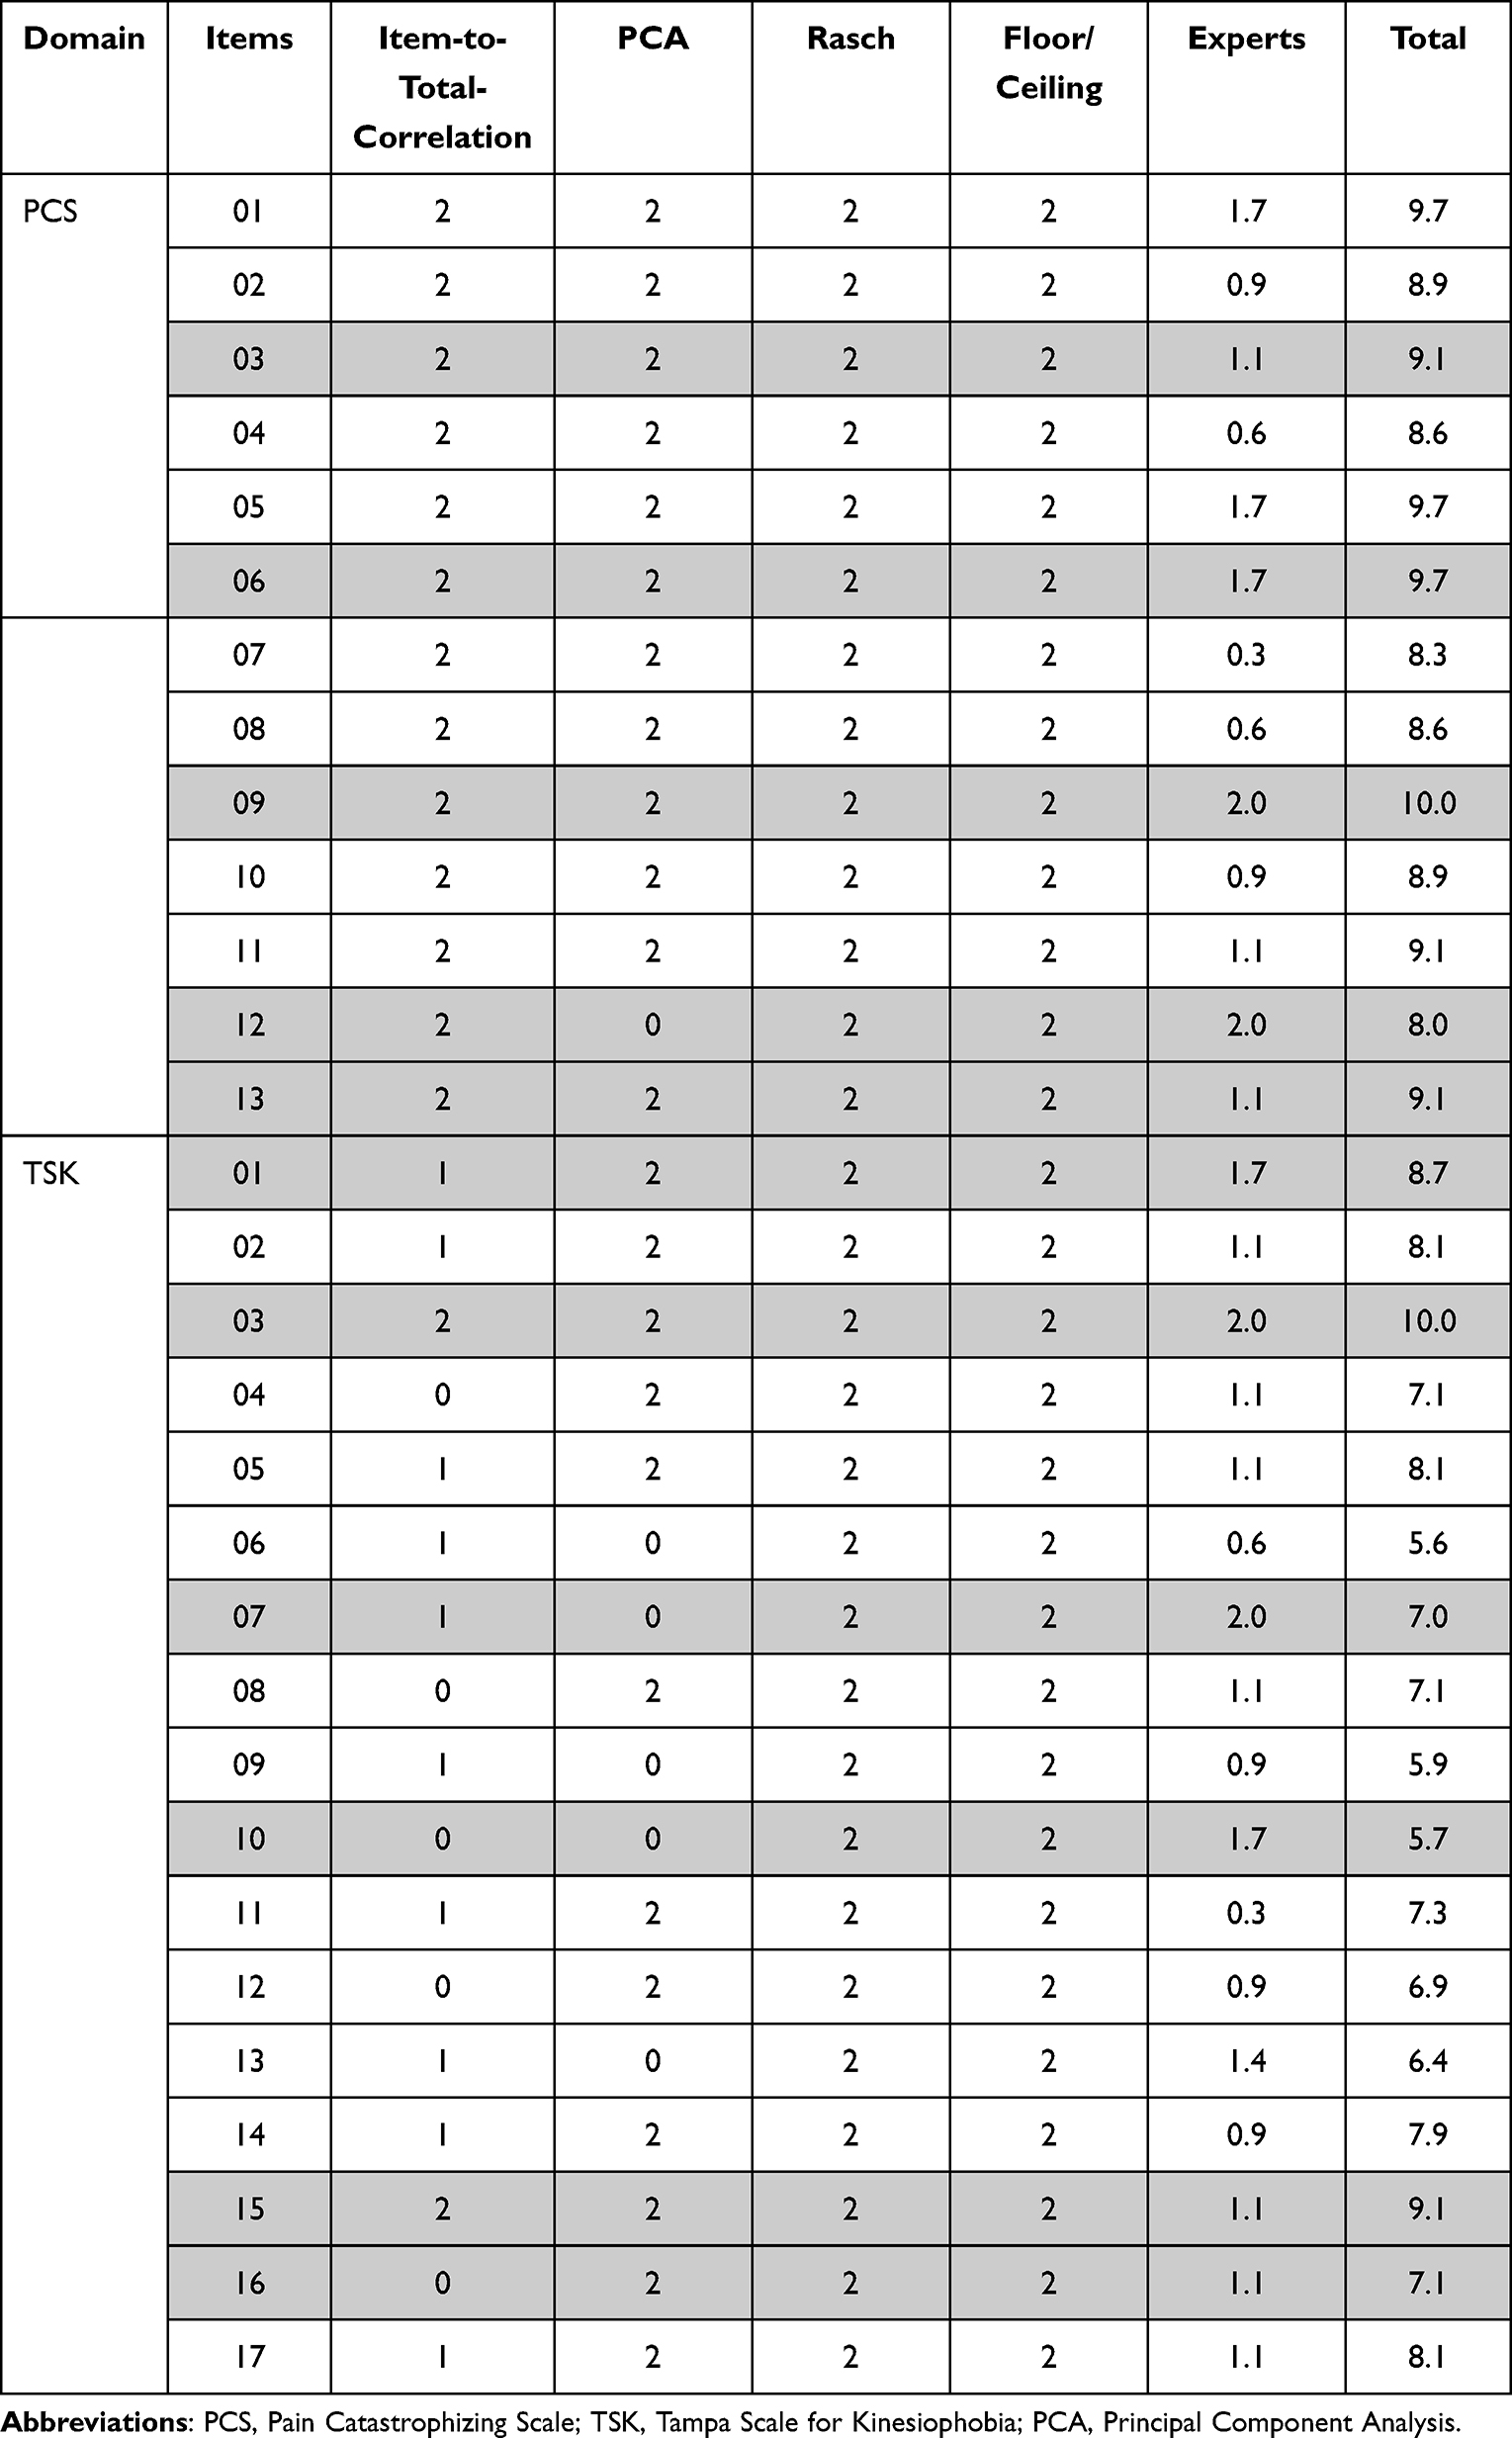 |
Table 3 Statistical Performance of the Two Questionnaires According to the Stanton Criteria. Items Selected by Experts are Highlighted in Grey |
Synthesis and Final Decision
The experts were instructed to keep about 1/3 of the items, favoring the highest Stanton scores and maintaining the structure of the questionnaire. The items were chosen collectively, with each expert giving an opinion according to their specialization. The experts kept as a priority the items with a good Stanton score but sometimes had to choose between items with the same Stanton scores. This situation occurred with items 1, 5 and 6 of the PCS: items 1 and 6 had the same profile (quantitative analyses) and were redundant. Thus, from their experience, experts chose to keep item 6. In other situations, they had to choose between 2 items with a different Stanton score and still chose the one with the lowest score in order to respect the structure of the questionnaire or because this item seemed more clinically relevant. This was the case for item 3 of the PCS (Stanton score 5.1), which was preferred over item 5 (Stanton score 5.7) because experts considered it less specific to catastrophism than the others. In other cases, the items did not participate in any of the dimensions but were nevertheless retained by the experts because they considered them indispensable. This was the case for items 7 and 10 of the TSK or item 12 of the PCS. We asked the experts to retain 1 or 2 inversely scored items of the TSK to preserve the construction of the questionnaire.
The scores for the PROMs were calculated in the same way as for the long versions (ie, by adding up the scores for each item). The sum gives a range of 0–20 for the 5-item PCS and 0–24 for the 6-item TSK.
Step 2: Validation of the Reduced Questionnaires
Participants
In total, 65 additional patients with chronic pain due to a musculoskeletal injury that had occurred about 13 months previous were recruited between February 1 and August 30, 2020 for the validation step. Five patients did not respond to the retest. If patients did not respond to ≥ 1 item in any of the three PROMs, the questionnaire was not used for further analysis. Patient characteristics are in Table 2. The median age was 43 (IQR 35–54) and 75% of patients were men. In all, 46% of patients had upper-limb pain, 35% lower-limb pain and 19% neck/back pain. A total of 35% of patients had ≤ 9 years of school education, 74% were workers and 46% had an employment contract at the time of rehabilitation. All were fluent French speakers.
Psychometric Properties
Internal Consistency
Cronbach α values were 0.89 and 0.71 for PCS and TSK, respectively (Table 4).
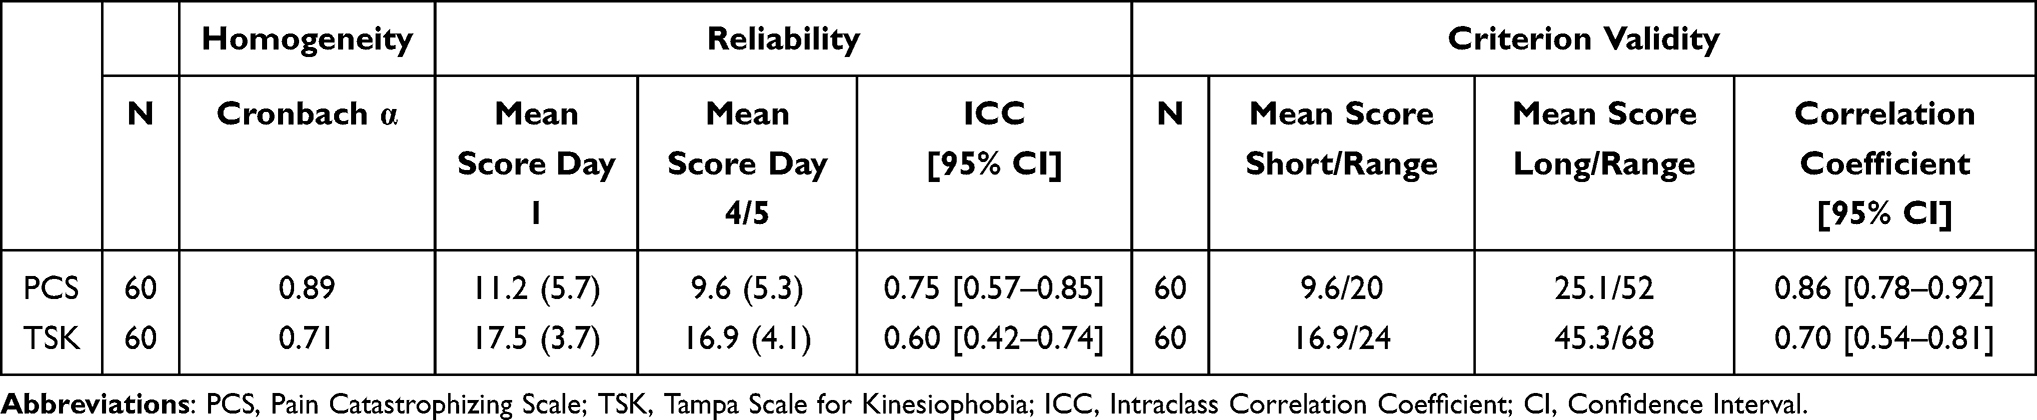 |
Table 4 Reliability and Criterion Validity of the Two Reduced Questionnaires |
Reliability
The PCS shows a “good” ICC and the TSK a “moderate” ICC (Table 4).
Criterion Validity
The correlation coefficients were ≥ 0.70 for both PROMs (Table 4).
Cutoffs
On the basis of 60 patients, results suggested the following optimal pathological cutoffs: 9/20 for the PCS and 16/24 for the TSK. For the latter, we also calculated the threshold according to sex as suggested for the long version. The cutoff was 14 for women and 16 for men. However, because of few women in our analysis (n=16), the cutoff needs to be confirmed with a larger population (Table 5, Figure 4).
 |
Figure 4 Receiver Operating Characteristic (ROC) Curves For The Two Reduced Questionnaires. Abbreviations: PCS, Pain Catastrophizing Scale; TSK, Tampa Scale for Kinesiophobia. |
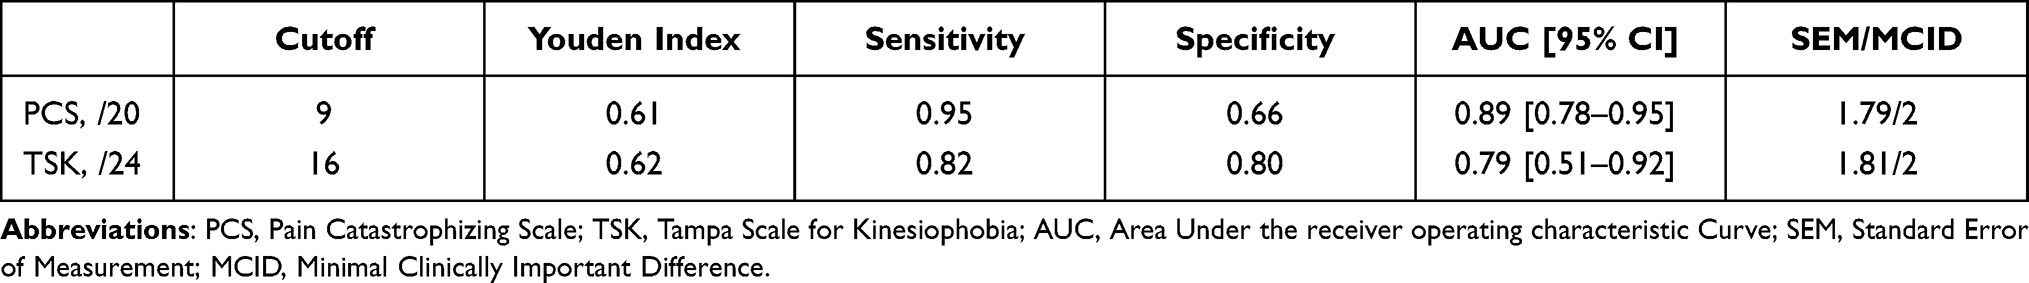 |
Table 5 Cutoff Values and SEM/MCID for the Two Reduced Questionnaires |
MCID
The MCIDs estimated were: 2 for PCS (0–20) and 2 TSK (0–24) (Table 5).
Discussion
We developed short forms of the French-language PCS and TSK questionnaires that contain 5 and 6 items (Supplementary Data 2). We selected items from well-designed full-length questionnaires while keeping their structure and coherence. The Stanton et al method is complex but complete and has been extensively used by several authors.24,26 Although other approaches heavily prioritize statistical methods, this approach gives greater importance to experts’ opinions. The final choice of items was decided during a collegial debate during which experts had to consider results of the quantitative analyses and maintain the structure and coherence of the questionnaires. Because the experts were solicited individually and then during a collective debate, their final choice was not necessarily the same as their first choice.
The psychometric properties of the two short versions of the PROMs were satisfactory and MCIDs could be estimated. We hypothesized that the criterion validity would be slightly less good with the “test” than the “retest” short forms, which was confirmed by additional calculations (data not shown).
PCS
Five of the original 13 items were selected. Internal consistency and reliability were comparable to those for the French long PCS version (α = 0.87 and ICC = 0.85, respectively)35 and the English original version (α = 0.87 and ICC = 0.75, respectively). Criterion validity was excellent. We recommend setting the cutoff at 9/20 and the MCID = 2. There is no “official” score indicating a significant change in the questionnaire. An MCID of 6.71 was proposed by Suzuki et al52 for patients with low back pain. This MCID represents about 12% of the total score, which is close to our MCID (about 10%). Several short versions of the PCS have been proposed.53–57 Most gave priority to quantitative analysis.53,55,57 Darnall proposed a 3-item version but did not analyze the correlation with the original version. Walton et al56 (4-item PCS) added a qualitative analysis to reduce the questionnaire as we did. However, it was a conceptual analysis to detect possible mismatch between conceptual theory and wording. Our qualitative approach was more patient-centered because the experts had to evaluate the items according to their clinical practice with CMSP patients. For this reason, we needed input from a large panel of specialists who work routinely with patients.
TSK
Six of the 17 items were selected. The Cronbach α was the same as for the French long TSK version (α = 0.71)40 and close to that for the English version of Vlaeyens et al (α = 0.77).8 The reliability of the 6 items was moderate. We suggest a cutoff of 16/24 for men and 14/24 for women and to consider an MCID of 2 (6–24). There is no consensus regarding the MCID for TSK, but Monticone et al58 proposed a value of 5.5 that corresponds to about 7% of the total score, which is close to our 8%. Several short versions exist59–67 (TSK-13, TSK-12, TSK-11, TSK-7, TSK-6, TSK-5, TSK-4). All were developed using quantitative analyses. To our knowledge, our study is the first to consider the opinions of clinicians in reducing the questionnaire. The TSK-13, −12 and −11 were too long for our purpose. The TSK-6 is limited to patients with knee and hip osteoarthritis. The TSK-5 was developed from the TSK-11. The authors of the TSK-4 suggested that it more likely represents catastrophic thinking than fear of movement. Moreover, a further analysis of the TSK-4 with a spinal surgery population revealed insufficient internal consistency.68
The strength of our study was the high number of datasets used for the quantitative analysis as well as the approach used to reduce the questionnaires, based on both quantitative and qualitative approaches. Finally, because the criterion validity was satisfactory, we can compare short-form scores to the long-form scores.
The ability to assess a patient’s perspective on his or her health is critical for clinical decision making, outcomes measurement and evaluation of rehabilitation program performance and quality.69 In the case of a systematic and routine collection of PROMs in healthcare settings, short PROMs spare time, reduce patient and clinician burden, and thus enhance patient engagement, leading to more effective screening and evaluation of health services.70 In the case of chronic pain, short forms of the PCS and TSK questionnaires can be used as repeated measures in longitudinal research to assess the effectiveness of psychological and pain management.
The reduced version of the two questionnaires allows more patients to benefit from this screening because they can be completed in less time. We tested the application of these shortened PROMs in clinical practice. The two short versions were distributed to 20 patients during a physiatrist consultation. For several patients, symptoms for kinesiophobia could not have been detected without these questionnaires, and a discussion about the results with the patient was possible. In clinical care, use of shortened versions of questionnaires can reduce the burden of patients as well as the administrative burden. Over time, the shortened version may be more appealing to use than the long version.
The two reduced PROMs can be used together or independently, depending on the clinical scenario. If used with an additional measure of pain severity/interference and depression/anxiety, they could assess the fear-avoidance model thoroughly.8,71 They are complementary to the use of very short questionnaires such as the STarT Back72 or the Örebro.73 Indeed, they can be early screening tools for use in primary care settings by the general practitioner to detect patients with musculoskeletal pain at high risk of becoming chronic. The reduced versions of the PCS and TSK are rather intended for the physiatrist or the rheumatologist to assess in a second step the chronic pain of patients with CMSP. Finally, therapists who need further exploration of catastrophizing and fear of movement could use the long versions.
According to Putman et al, the translation of a short version arising from an already validated long version does not affect the psychometric properties.74 A shortened version could be adapted in another language if the long version has already been validated in this language and the items are conserved. This method was used for the QuickDASH, all cross-cultural adaptations of the latter being derived from the English version.23,75 The Supplementary Data 3 includes the English, Spanish, Italian and Portuguese versions of the two reduced PROMs that could be used in future validation studies.
Limitations
A weakness of the study was that all experts came from the same rehabilitation center, which could imply biased representativeness of the jury, especially because our procedure was preferentially based on the opinion of experts. Moreover, the short questionnaires were developed with CMSP patient, mostly men, so we cannot assert that this selection of items would have been the same among another group of patients. Another limitation is that cutoffs were determined on the basis of 60 patients only and should be confirmed with a larger population. Finally, the MCIDs were determined with a distribution-based method and must be confirmed with an anchor-based method.
Conclusions
The present study suggests that the F-PCS-5 and F-TSK-6 questionnaires are reliable and valid PROMs, suitable for assessing catastrophizing thinking and fear of movement of patient with chronic musculoskeletal pain. Their simplicity and quickness of use allows their implementation in outpatient consultation as well as in clinical settings. However, when the highest level of measurement precision is required, the long versions should still be used.
Abbreviations
CMSP, Chronic Musculoskeletal Pain; PROMs, Patient-Reported Outcome Measures; PCS, Pain Catastrophizing Scale; TSK, Tampa Scale for Kinesiophobia; MCID, Minimal Clinically Important Difference; ICC, Intraclass Correlation Coefficient; SEM, Standard Error of Measurement; IQR, Interquartile Range; PCA, Principal Component Analysis.
Data Sharing Statement
The datasets used during the current study are available from the corresponding author on reasonable request.
Acknowledgments
We gratefully thank the expert team (Favre Christine, Bender Bénédicte, Foli Marlène, Nesa Thomas, Gasser Léo) of the Clinique romande de réadaptation, Sion, Switzerland, who participated in selecting the items, as well as the nursing team who distributed the questionnaires.
Disclosure
The authors report no conflicts of interest related to this work.
References
1. Cohen SP, Vase L, Hooten WM. Chronic pain: an update on burden, best practices, and new advances. Lancet. 2021;397(10289):2082–2097. doi:10.1016/S0140-6736(21)00393-7
2. Huber C, Wieser S. La Suisse paie un prix élevé pour les maladies non transmissibles. Bulletin des médecins suisses. 2018;99(33):1054–1056.
3. Wieser S, Riguzzi M, Pletscher M, Huber CA, Telser H, Schwenkglenks M. How much does the treatment of each major disease cost? A decomposition of Swiss national health accounts. Eur J Health Econ. 2018;19(8):1149–1161. doi:10.1007/s10198-018-0963-5
4. Gatchel RJ, Peng YB, Peters ML, Fuchs PN, Turk DC. The biopsychosocial approach to chronic pain: scientific advances and future directions. Psychol Bull. 2007;133(4):581–624. doi:10.1037/0033-2909.133.4.581
5. Leeuw M, Goossens ME, Linton SJ, Crombez G, Boersma K, Vlaeyen JW. The fear-avoidance model of musculoskeletal pain: current state of scientific evidence. J Behav Med. 2007;30(1):77–94. doi:10.1007/s10865-006-9085-0
6. Lethem J, Slade PD, Troup JD, Bentley G. Outline of a fear-avoidance model of exaggerated pain perception--I. Behav Res Ther. 1983;21(4):401–408. doi:10.1016/0005-7967(83)90009-8
7. Philips HC. Avoidance behaviour and its role in sustaining chronic pain. Behav Res Ther. 1987;25(4):273–279. doi:10.1016/0005-7967(87)90005-2
8. Vlaeyen JW, Kole-Snijders AM, Rotteveel AM, Ruesink R, Heuts PH. The role of fear of movement/(re)injury in pain disability. J Occup Rehabil. 1995;5(4):235–252. doi:10.1007/BF02109988
9. Vlaeyen JW, Linton SJ. Fear-avoidance and its consequences in chronic musculoskeletal pain: a state of the art. Pain. 2000;85(3):317–332. doi:10.1016/S0304-3959(99)00242-0
10. Waddell G, Newton M, Henderson I, Somerville D, Main CJ. A fear-avoidance beliefs questionnaire (FABQ) and the role of fear-avoidance beliefs in chronic low back pain and disability. Pain. 1993;52(2):157–168. doi:10.1016/0304-3959(93)90127-B
11. Ramírez-Maestre C, Esteve R, Ruiz-Párraga G, Gómez-Pérez L, López-Martínez A. The key role of pain catastrophizing in the disability of patients with acute back pain. Int J Behav Med. 2017;24(2):239–248.
12. Varallo G, Scarpina F, Giusti EM, et al. Does kinesiophobia mediate the relationship between pain intensity and disability in individuals with chronic low-back pain and obesity? Brain Sci. 2021;11(6):684. doi:10.3390/brainsci11060684
13. Varallo G, Scarpina F, Giusti EM, et al. The role of pain catastrophizing and pain acceptance in performance-based and self-reported physical functioning in individuals with fibromyalgia and obesity. J Pers Med. 2021;11(8):810. doi:10.3390/jpm11080810
14. Giusti EM, Manna C, Varallo G, et al. The predictive role of executive functions and psychological factors on chronic pain after orthopaedic surgery: a longitudinal cohort study. Brain Sci. 2020;10(10):685. doi:10.3390/brainsci10100685
15. Severeijns R, Vlaeyen JW, van den Hout MA, Weber WE. Pain catastrophizing predicts pain intensity, disability, and psychological distress independent of the level of physical impairment. Clin J Pain. 2001;17(2):165–172. doi:10.1097/00002508-200106000-00009
16. Somers TJ, Keefe FJ, Pells JJ, et al. Pain catastrophizing and pain-related fear in osteoarthritis patients: relationships to pain and disability. J Pain Symptom Manage. 2009;37(5):863–872. doi:10.1016/j.jpainsymman.2008.05.009
17. Varallo G, Giusti EM, Scarpina F, Cattivelli R, Capodaglio P, Castelnuovo G. The association of kinesiophobia and pain catastrophizing with pain-related disability and pain intensity in obesity and chronic lower-back pain. Brain Sci. 2020;11(1):11. doi:10.3390/brainsci11010011
18. Bailey KM, Carleton RN, Vlaeyen JW, Asmundson GJ. Treatments addressing pain-related fear and anxiety in patients with chronic musculoskeletal pain: a preliminary review. Cogn Behav Ther. 2010;39(1):46–63. doi:10.1080/16506070902980711
19. Simons LE, Vlaeyen JW, Declercq L, et al. Avoid or engage? Outcomes of graded exposure in youth with chronic pain using a sequential replicated single-case randomized design. Pain. 2020;161(3):520–531. doi:10.1097/j.pain.0000000000001735
20. Sullivan MJL, Bishop SR, Pivik J. The Pain Catastrophizing Scale: development and validation. Psychol Assess. 1995;7(4):524–532. doi:10.1037/1040-3590.7.4.524
21. Kori SHM, Todd DD. Kinesiophobia: a new view of chronic pain behavior. Pain Manag. 1990;1990:35–43.
22. Adams GS, Converse BA, Hales AH, Klotz LE. People systematically overlook subtractive changes. Nature. 2021;592(7853):258–261. doi:10.1038/s41586-021-03380-y
23. Beaton DE, Wright JG, Katz JN. Development of the QuickDASH: comparison of three item-reduction approaches. J Bone Joint Surg Am. 2005;87(5):1038–1046. doi:10.2106/JBJS.D.02060
24. Benhissen Z, Konzelmann M, Vuistiner P, et al. Development and validation of a short version of the French hand function sort questionnaire in vocational rehabilitation. Ann Phys Rehabil Med. 2021;64(6):101533. doi:10.1016/j.rehab.2021.101533
25. Hawthorne G. Assessing utility where short measures are required: development of the short assessment of quality of life‐8 (AQoL‐8) instrument. Value Health. 2009;12(6):948–957. doi:10.1111/j.1524-4733.2009.00526.x
26. Janssen S, Trippolini MA, Hilfiker R, Oesch P. Development of a modified version of the spinal function sort (M-SFS): a mixed method approach. J Occup Rehabil. 2016;26(3):253–263. doi:10.1007/s10926-015-9611-4
27. Waljee JF, Kim HM, Burns PB, Chung KC. Development of a brief, 12-item version of the Michigan hand questionnaire. Plast Reconstr Surg. 2011;128(1):208. doi:10.1097/PRS.0b013e318218fc51
28. Ware JE. Improvements in short-form measures of health status: introduction to a series. J Clin Epidemiol. 2008;61(1):1–5. doi:10.1016/j.jclinepi.2007.08.008
29. Stanton JM, Sinar EF, Balzer WK, Smith PC. Issues and strategies for reducing the length of self-report scales. Pers Psychol. 2002;55(1):167–194. doi:10.1111/j.1744-6570.2002.tb00108.x
30. Coste J, Guillemin F, Pouchot J, Fermanian J. Methodological approaches to shortening composite measurement scales. J Clin Epidemiol. 1997;50(3):247–252. doi:10.1016/S0895-4356(96)00363-0
31. Terwee CB, Bot SD, de Boer MR, et al. Quality criteria were proposed for measurement properties of health status questionnaires. J Clin Epidemiol. 2007;60(1):34–42. doi:10.1016/j.jclinepi.2006.03.012
32. Mokkink LB, Prinsen CA, Bouter LM, de Vet HC, Terwee CB. The COnsensus-based standards for the selection of health measurement INstruments (COSMIN) and how to select an outcome measurement instrument. Braz J Phys Ther. 2016;20(2):105–113. doi:10.1590/bjpt-rbf.2014.0143
33. Cleeland CS. Pain assessment in cancer. Eff Cancer Qualityl Life. 1991;293:305.
34. Zigmond AS, Snaith RP. The Hospital Anxiety and Depression Scale. Acta Psychiatr Scand. 1983;67(6):361–370. doi:10.1111/j.1600-0447.1983.tb09716.x
35. French DJ, Noël M, Vigneau F, French JA, Cyr CP, Evans RT. L’Échelle de dramatisation face à la douleur PCS-CF: adaptation canadienne en langue française de l’échelle «Pain Catastrophizing Scale». Can J Behav Sci. 2005;37(3):181. doi:10.1037/h0087255
36. Sullivan MJ. The pain catastrophizing scale: user manual. Montreal. 2009;1:36.
37. Miller RP, Kori SH, Todd DD. The Tampa Scale: a measure of kinisophobia. Clin J Pain. 1991;7(1):51. doi:10.1097/00002508-199103000-00053
38. Roelofs J, van Breukelen G, Sluiter J, et al. Norming of the Tampa scale for kinesiophobia across pain diagnoses and various countries. Pain. 2011;152(5):1090–1095. doi:10.1016/j.pain.2011.01.028
39. Liu H, Huang L, Yang Z, Li H, Wang Z, Peng L. Fear of movement/(Re) injury: an update to descriptive review of the related measures. Front Psychol. 2021;12:2765.
40. French DR, Mayes PJ, Mayes S. Peur du mouvement chez des accidentes du travail: l’Echelle de Kinesiophobie de Tampa (EKT). Can J Behav Sci. 2002;34(1):28–33. doi:10.1037/h0087152
41. Roelofs J, Sluiter JK, Frings-Dresen MH, et al. Fear of movement and (re)injury in chronic musculoskeletal pain: evidence for an invariant two-factor model of the Tampa scale for kinesiophobia across pain diagnoses and Dutch, Swedish, and Canadian samples. Pain. 2007;131(1–2):181–190. doi:10.1016/j.pain.2007.01.008
42. Mukaka MM. Statistics corner: a guide to appropriate use of correlation coefficient in medical research. Malawi Med J. 2012;24(3):69–71.
43. Lan AS, Chiang M, Studer C. An estimation and analysis framework for the Rasch model. arXiv preprint arXiv. 2018;2018:180603551.
44. DeMars C. Infit and outfit: interpreting statistical significance and magnitude of misfit in conjunction. J Appl Meas. 2017;18(2):163–177.
45. Lim CR, Harris K, Dawson J, Beard DJ, Fitzpatrick R, Price AJ. Floor and ceiling effects in the OHS: an analysis of the NHS PROMs data set. BMJ open. 2015;5:7. doi:10.1136/bmjopen-2015-007765
46. Tavakol M, Dennick R. Making sense of Cronbach’s alpha. Int J Med Educ. 2011;2:53. doi:10.5116/ijme.4dfb.8dfd
47. Koo TK, Li MY. A guideline of selecting and reporting intraclass correlation coefficients for reliability research. J Chiropr Med. 2016;15(2):155–163. doi:10.1016/j.jcm.2016.02.012
48. Fermanian J. Validation of assessment scales in physical medicine and rehabilitation: how are psychometric properties determined?
49. Mouelhi Y, Jouve E, Castelli C, Gentile S. How is the minimal clinically important difference established in health-related quality of life instruments? Review of anchors and methods. Health Qual Life Outcomes. 2020;18:1–17. doi:10.1186/s12955-020-01344-w
50. Malec JF, Ketchum JM. A standard method for determining the minimal clinically important difference for rehabilitation measures. Arch Phys Med Rehabil. 2020;101(6):1090–1094. doi:10.1016/j.apmr.2019.12.008
51. Youden WJ. Index for rating diagnostic tests. Cancer. 1950;3(1):32–35. doi:10.1002/1097-0142(1950)3:1<32::AID-CNCR2820030106>3.0.CO;2-3
52. Suzuki H, Aono S, Inoue S, et al. Clinically significant changes in pain along the pain intensity numerical rating scale in patients with chronic low back pain. PLoS One. 2020;15(3):e0229228–e0229228. doi:10.1371/journal.pone.0229228
53. Bot AG, Becker SJ, Bruijnzeel H, Mulders MA, Ring D, Vranceanu AM. Creation of the abbreviated measures of the pain catastrophizing scale and the short health anxiety inventory: the PCS-4 and SHAI-5. J Musculoskelet Pain. 2014;22(2):145–151. doi:10.3109/10582452.2014.883020
54. Darnall BD, Sturgeon JA, Cook KF, et al. Development and validation of a daily pain catastrophizing scale. J Pain Res. 2017;18(9):1139–1149. doi:10.1016/j.jpain.2017.05.003
55. McWilliams L, Kowal J, Wilson K. Development and evaluation of short forms of the pain catastrophizing scale and the pain self‐efficacy questionnaire. Eur J Pain. 2015;19(9):1342–1349. doi:10.1002/ejp.665
56. Walton DM, Mehta S, Seo W, MacDermid JC. Creation and validation of the 4-item BriefPCS-chronic through methodological triangulation. Health Qual Life Outcomes. 2020;18(1):1–9. doi:10.1186/s12955-020-01346-8
57. Cheng S-T, Chen PP, Chow YF, et al. The Pain Catastrophizing Scale—short form: psychometric properties and threshold for identifying high-risk individuals. Int Psychogeriatr. 2019;31(11):1665–1674. doi:10.1017/S1041610219000024
58. Monticone M, Giorgi I, Baiardi P, Barbieri M, Rocca B, Bonezzi C. Development of the Italian version of the Tampa Scale of Kinesiophobia (TSK-I): cross-cultural adaptation, factor analysis, reliability, and validity. Spine. 2010;35(12):1241–1246. doi:10.1097/BRS.0b013e3181bfcbf6
59. Bisson EJ, Katz L, Vader K, Bossio JA, Wilson R, Duggan S. Pain-related fear in adults living with chronic pain: development and psychometric validation of a brief form of the Tampa scale of kinesiophobia. Arch Phys Med Rehabil. 2022;103(5):875–881. e871. doi:10.1016/j.apmr.2021.09.001
60. Burwinkle T, Robinson JP, Turk DC. Fear of movement: factor structure of the Tampa scale of kinesiophobia in patients with fibromyalgia syndrome. J Pain Res. 2005;6(6):384–391. doi:10.1016/j.jpain.2005.01.355
61. Clark M. Kinesiophobia and chronic pain: psychometric characteristics and factor analysis of the Tampa Scale.
62. Goubert L, Crombez G, Van Damme S, Vlaeyen JW, Bijttebier P, Roelofs J. Confirmatory factor analysis of the Tampa scale for kinesiophobia: invariant two-factor model across low back pain patients and fibromyalgia patients. Clin J Pain. 2004;20(2):103–110. doi:10.1097/00002508-200403000-00007
63. Kamonseki DH, Haik MN, Ribeiro LP, et al. Measurement properties of the Brazilian versions of fear-avoidance beliefs questionnaire and Tampa scale of kinesiophobia in individuals with shoulder pain. PLoS One. 2021;16(12):e0260452. doi:10.1371/journal.pone.0260452
64. Lundberg M, Grimby-Ekman A, Verbunt J, Simmonds M. Pain-related fear: a critical review of the related measures. Pain Res Treat. 2011;2011:1–26. doi:10.1155/2011/494196
65. Shelby RA, Somers TJ, Keefe FJ, et al. Brief Fear of Movement Scale for osteoarthritis. Arthritis Care Res. 2012;64(6):862–871. doi:10.1002/acr.21626
66. Visscher CM, Ohrbach R, van Wijk AJ, Wilkosz M, Naeije M. The Tampa scale for kinesiophobia for temporomandibular disorders (TSK-TMD). Pain. 2010;150(3):492–500. doi:10.1016/j.pain.2010.06.002
67. Woby SR, Roach NK, Urmston M, Watson PJ. Psychometric properties of the TSK-11: a shortened version of the Tampa Scale for Kinesiophobia. Pain. 2005;117(1–2):137–144. doi:10.1016/j.pain.2005.05.029
68. Archer KR, Phelps KD, Seebach CL, Song Y, Riley III LH, Wegener ST. Comparative study of short forms of the Tampa Scale for Kinesiophobia: fear of movement in a surgical spine population. Arch Phys Med Rehabil. 2012;93(8):1460–1462. doi:10.1016/j.apmr.2012.03.024
69. Black N, Burke L, Forrest CB, et al. Patient-reported outcomes: pathways to better health, better services, and better societies. Qual Life Res. 2016;25(5):1103–1112. doi:10.1007/s11136-015-1168-3
70. Kluzek S, Dean B, Wartolowska KA. Patient-reported outcome measures (PROMs) as proof of treatment efficacy. BMJ Evid Based Med. 2022;27(3):153. doi:10.1136/bmjebm-2020-111573
71. Vlaeyen JW, Kole-Snijders AM, Boeren RG, van Eek H. Fear of movement/(re)injury in chronic low back pain and its relation to behavioral performance. Pain. 1995;62(3):363–372. doi:10.1016/0304-3959(94)00279-N
72. Hill JC, Dunn KM, Lewis M, et al. A primary care back pain screening tool: identifying patient subgroups for initial treatment. Arthritis Care Res. 2008;59(5):632–641. doi:10.1002/art.23563
73. Linton SJ, Nicholas M, MacDonald S. Development of a short form of the Örebro musculoskeletal pain screening questionnaire. Spine. 2011;36(22):1891–1895. doi:10.1097/BRS.0b013e3181f8f775
74. Putman S, Migaud H, Pasquier G, Girard J, Preda C, Duhamel A. Does change in language change the properties of a shortened score previously validated in its complete version? Validation of the French versions of the HOOS-12 and KOOS-12 scores in primary knee and Hip arthroplasties. Orthop Traumatol. 2021;107(3):102824.
75. Kennedy CA, Beaton DE, Smith P, et al. Measurement properties of the Quick DASH (disabilities of the arm, shoulder and hand) outcome measure and cross-cultural adaptations of the Quick DASH: a systematic review. Qual Life Res. 2013;22(9):2509–2547. doi:10.1007/s11136-013-0362-4
 © 2023 The Author(s). This work is published and licensed by Dove Medical Press Limited. The
full terms of this license are available at https://www.dovepress.com/terms
and incorporate the Creative Commons Attribution
- Non Commercial (unported, 3.0) License.
By accessing the work you hereby accept the Terms. Non-commercial uses of the work are permitted
without any further permission from Dove Medical Press Limited, provided the work is properly
attributed. For permission for commercial use of this work, please see paragraphs 4.2 and 5 of our Terms.
© 2023 The Author(s). This work is published and licensed by Dove Medical Press Limited. The
full terms of this license are available at https://www.dovepress.com/terms
and incorporate the Creative Commons Attribution
- Non Commercial (unported, 3.0) License.
By accessing the work you hereby accept the Terms. Non-commercial uses of the work are permitted
without any further permission from Dove Medical Press Limited, provided the work is properly
attributed. For permission for commercial use of this work, please see paragraphs 4.2 and 5 of our Terms.