Back to Journals » Clinical Interventions in Aging » Volume 18
Development and Validation of Prediction Models for All-Cause Mortality and Cardiovascular Mortality in Patients on Hemodialysis: A Retrospective Cohort Study in China
Authors Yang M ![]() , Yang Y, Xu Y
, Yang Y, Xu Y ![]() , Wu Y
, Wu Y ![]() , Lin J
, Lin J ![]() , Mai J
, Mai J ![]() , Fang K
, Fang K ![]() , Ma X, Zou C
, Ma X, Zou C ![]() , Lin Q
, Lin Q ![]()
Received 1 May 2023
Accepted for publication 22 July 2023
Published 28 July 2023 Volume 2023:18 Pages 1175—1190
DOI https://doi.org/10.2147/CIA.S416421
Checked for plagiarism Yes
Review by Single anonymous peer review
Peer reviewer comments 2
Editor who approved publication: Dr Zhi-Ying Wu
Min Yang,1,2,* Yaqin Yang,1,2,* Yuntong Xu,1,2 Yuchi Wu,1,2 Jiarong Lin,1,2 Jianling Mai,1,2 Kunyang Fang,1,2 Xiangxia Ma,1,2 Chuan Zou,1,2 Qizhan Lin1,2
1The Second Clinical Medical College, Guangzhou University of Chinese Medicine, Guangzhou, People’s Republic of China; 2Department of Nephrology, Guangdong Provincial Hospital of Chinese Medicine, Guangzhou, People’s Republic of China
*These authors contributed equally to this work
Correspondence: Chuan Zou; Qizhan Lin, Department of Nephrology, Guangdong Provincial Hospital of Chinese Medicine, 111 Dade Road, Guangzhou, Guangdong, 510000, People’s Republic of China, Email [email protected]; [email protected]
Purpose: This study aimed to develop two predictive nomograms for the assessment of long-term survival status in hemodialysis (HD) patients by examining the prognostic factors for all-cause mortality and cardiovascular (CVD) event mortality.
Patients and methods: A total of 551 HD patients with an average age of over 60 were included in this study. The patients’ medical records were collected from our hospital and randomly allocated to two cohorts: the training cohort (n=385) and the validation cohort (n=166). We employed multivariate Cox assessments and fine-gray proportional hazards models to explore the predictive factors for both all-cause mortality and cardiovascular event mortality risk in HD patients. Two nomograms were established based on predictive factors to forecast patients’ likelihood of survival for 3, 5, and 8 years. The performance of both models was evaluated using the area under the curve (AUC), calibration plots, and decision curve analysis.
Results: The nomogram for all-cause mortality prediction included seven factors: age ≥ 60, sex (male), history of diabetes and coronary artery disease, diastolic blood pressure, total triglycerides (TG), and total cholesterol (TC). The nomogram for cardiovascular event mortality prediction included three factors: history of diabetes and coronary artery disease, and total cholesterol (TC). Both models demonstrated good discrimination, with AUC values of 0.716, 0.722 and 0.725 for all-cause mortality at 3, 5, and 8 years, respectively, and 0.702, 0.695, and 0.677 for cardiovascular event mortality, respectively. The calibration plots indicated a good agreement between the predictions and the decision curve analysis demonstrated a favorable clinical utility of the nomograms.
Conclusion: Our nomograms were well-calibrated and exhibited significant estimation efficiency, providing a valuable predictive tool to forecast prognosis in HD patients.
Keywords: all-cause, cardiovascular, mortality, hemodialysis, model, nomogram
Introduction
The global incidence of chronic kidney disease (CKD) is on the rise, with an estimated prevalence of 14.3%.1 In China alone, CKD affects 132.3 million individuals, comprising one-sixth of the population.2 A cross-sectional study of epidemiological data in China found that CKD affects 10.8% of individuals over the age of 18.3 End-stage renal disease (ESRD), predominantly in the elderly, accounts for 1.34% of patients with CKD.4 Given the global burden of CKD management, renal replacement therapies such as hemodialysis (HD), renal transplantation, and peritoneal dialysis are essential options for patients.5 In China, over 90% of patients with uremia receive HD, which effectively prolongs survival times and reduces the risk of mortality.6 Despite this, dialysis patients have a mortality rate 6.5–7.9 times higher than the general population due to cardiovascular disease (CVD).7,8 CVD remains the leading cause of death in patients on HD, with more than half of HD outcome events linked to CVD.9,10 Extracellular volume overload is a critical contributor to the high risk of cardiovascular mortality in patients undergoing HD,11 and approximately 7% of the total CVD burden can be attributed to impaired kidney function.
Patients bear a significant burden due to inadequate public health resources and the economic pressure of HD.12 Adverse factors for patients on HD include smoking, hypertension, diabetes, advanced age, hyperlipidemia, anemia, inflammation, oxidative stress, uremic toxins, and disorders of calcium and phosphorus metabolism.13 Previous studies have developed and validated risk models for ESRD, such as the kidney failure risk equation,14 Cox regression for predicting CVD risk in patients on HD,15 and mortality risk scores for predicting the prognosis of patients on HD.16 However, these models have their limitations, including a short research period and insufficient data for validating long-term survival.
The ability to accurately screen high-risk patients before starting dialysis is essential to reduce mortality rates through risk management and targeted preventive treatment. With the development of artificial intelligence in healthcare, predictive models have become widely used, including the Cox proportional hazards model,17,18 which is the most commonly used tool for predicting disease prognosis, considering many factors that may affect the survival rate as covariates.19 Besides, the fine-gray model is better at accounting for competing risks in time-to-event analysis and is useful in a cohort with a high mortality rate.20,21
This study aimed to develop two models, including all-cause mortality and CVD risk models, designed by the Cox proportional hazard regression and fine-gray sub-distribution hazard function. These models will be visualized as nomograms to aid clinicians in evaluating patient status and developing therapeutic regimens as additional tools.
Methods
Study Design and Population
A total of 551 patients who underwent hemodialysis (HD) at Guangdong Provincial Hospital of Traditional Chinese Medicine in China, between January 2007 and June 2020, were enrolled in this study. Exclusion criteria consisted of HD duration less than three months, previous kidney transplantation, and a history of peritoneal dialysis. The study recorded data on patients until June 30, 2022. The Ethics Committee of Guangdong Provincial Hospital of Traditional Chinese Medicine exempted our study from the need for individual patient consent due to its retrospective design (ethics number: BE2020-278-01). Data was anonymized and collected ensuring patient confidentiality in accordance with the Declaration of Helsinki and institutional regulations. Rigorous measures were applied to safeguard patient information, prohibiting any disclosure of identifiable data. The study was registered in the China Clinical Trials Registry (Registration number: ChiCTR2300070280).
Clinical and Laboratory Parameters
Overnight fasting (12 h) blood samples were collected from all patients before first hemodialysis between January, 2007 and June, 2020. The following laboratory parameters were collected: CVD: cardiovascular disease; WBC: white blood cell; RBC: red blood cell; HB: hemoglobin; PLT: platelet; Urea: urea nitrogen; Cr: creatinine; IDH: intradialytic hypotension; UF Rate (ml/h): Ultrafiltration rate. TCO2: total carbon dioxide; TG: total triglycerides; TC: total cholesterol; HDL-C: high-density lipo-protein cholesterol; LDL-C: low-density lipoprotein cholesterol; UA: serum uric acid; ALP: alkaline phosphatase; ALB: Albumin; K: potassium; Ca: calcium; P: phosphorus; PTH: parathyroid hormone; Fe: serum iron; TSAT: transferrin saturation; TNT: troponin; BNP: brain natriuretic peptide; CK: creatine kinase; CK-MB: creatine kinase-MB; CRP: C-reactive protein.
Candidate Variables
Demographic variables, including age, sex, and blood pressure (systolic and diastolic blood pressure), were included as physical examination information. Other com-plications, such as diabetes and heart disease, were documented at the Guangdong Provincial Hospital of Traditional Chinese Medicine.
Outcome
The candidates were divided into training and test sets for the section on all-cause mortality in a ratio of 7:3. The event endpoints of interest were all-cause mortality and CVD mortality. All-cause mortality was defined as death resulting from infectious diseases, CVD events, malignant tumors, and gastrointestinal bleeding. CVD events were defined as death caused by angina, myocardial infarction, heart failure, coronary artery bypass graft, angioplasty, arrhythmia, transient ischemic attack, or stroke. The duration of illness for all events was calculated from the patient’s first HD treatment. In-hospital mortality was confirmed through the diagnosis in the medical records. In cases of deaths outside the hospital, the cause of death required the independent judgment of two specialists in our dialysis center, who considered the descriptions of the nursing staff and the patient’s medical record. All patients were monitored throughout their treatment, including fatal outcomes, transfer to peritoneal dialysis treatment, or receipt of a kidney transplant. The detailed process of the study is shown in Figure 1.
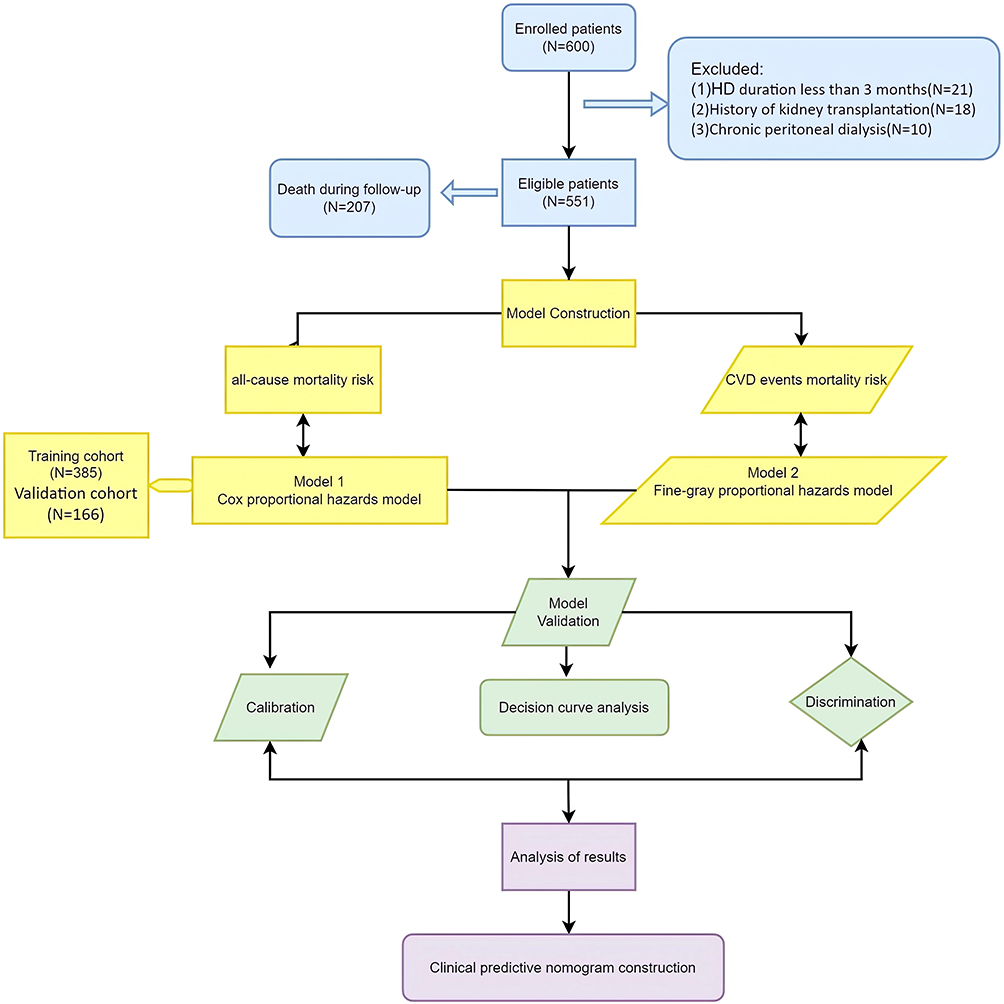 |
Figure 1 Comprehensive study design flowchart: Allocation of Candidates for all-cause and CVD mortality analysis. |
Statistical Analysis
In the descriptive statistics of the data, the student’s t-test was utilized when the measurement data adhered to a normal distribution. The measurement data was represented using mean and standard deviation (x ± s). Non-normal distribution data’s median M (P25 P75) was presented using the Wilcoxon-Mann-Whitney, and rank sum test was employed for comparison. Enumeration data in the constituent ratio (%) was retested using the Chi-square test. Statistical significance was set at P<0.05.
When building the two models, we transformed all continuous variables into categorical variables. For the all-cause mortality risk model (referred to as model 1), the cohort was randomly allocated into a training cohort (n = 386) and a validation cohort (n = 165). Multivariate regression analysis was used to perform Cox proportional hazards. The prediction nomogram for estimating the mortality risk of all causes was drawn using the training set. The test set was used as verification data to assess the nomogram’s effectiveness. For the CVD risk model (referred to as model 2), the cumulative incidence function curves were employed to perform the subgroup analysis. The sub-distribution hazard function-based fine-gray proportional hazards model was used to evaluate the competing risk. Additionally, a nomogram was developed to display the meaningful variables. To evaluate the predictive performance of the two models, the area under the curve (AUC) was utilized to reflect the estimation value. Calibration was conducted using bootstrapping to compare the consistency of predicted survival with actual survival. Decision curve analysis (DCA) was plotted to visualize the net benefits at different threshold probabilities, indicating the nomogram’s clinical application capability.
Stata software (version 15.0) was used for the statistical analysis of model 1, and R software (version 4.2: cmprsk, mstate, survival, car, rms, pROC, timeROC, ggDCA) was used for model 2. Two-sided p<0.05 was defined for statistical significance.
Results
Baseline Features of Participants
The study had a median survival time for all patients of 61.9 months. The survival rates at 1, 2, 3, 4, and 5 years were 0.93, 0.83, 0.75, 0.63, and 0.47, respectively. Baseline characteristics for all 551 patients on HD are shown in Table 1 and Table 2. The duration of dialysis for all patients was 12 hours per week, with a dialysis frequency of 3 times a week for 4 hours each session There were no significant differences in demographic characteristics, complications, laboratory metrics, or survival endings between the training and validation cohorts. The pathogenesis of HD patients included glomerulonephritis (226/551), diabetic nephropathy (195/551), polycystic kidney disease (29/551), obstructive nephropathy (25/551), and other categories (including tumor-related nephropathy, renal tuberculosis, congenital factors, and unknown etiology) (74/551).
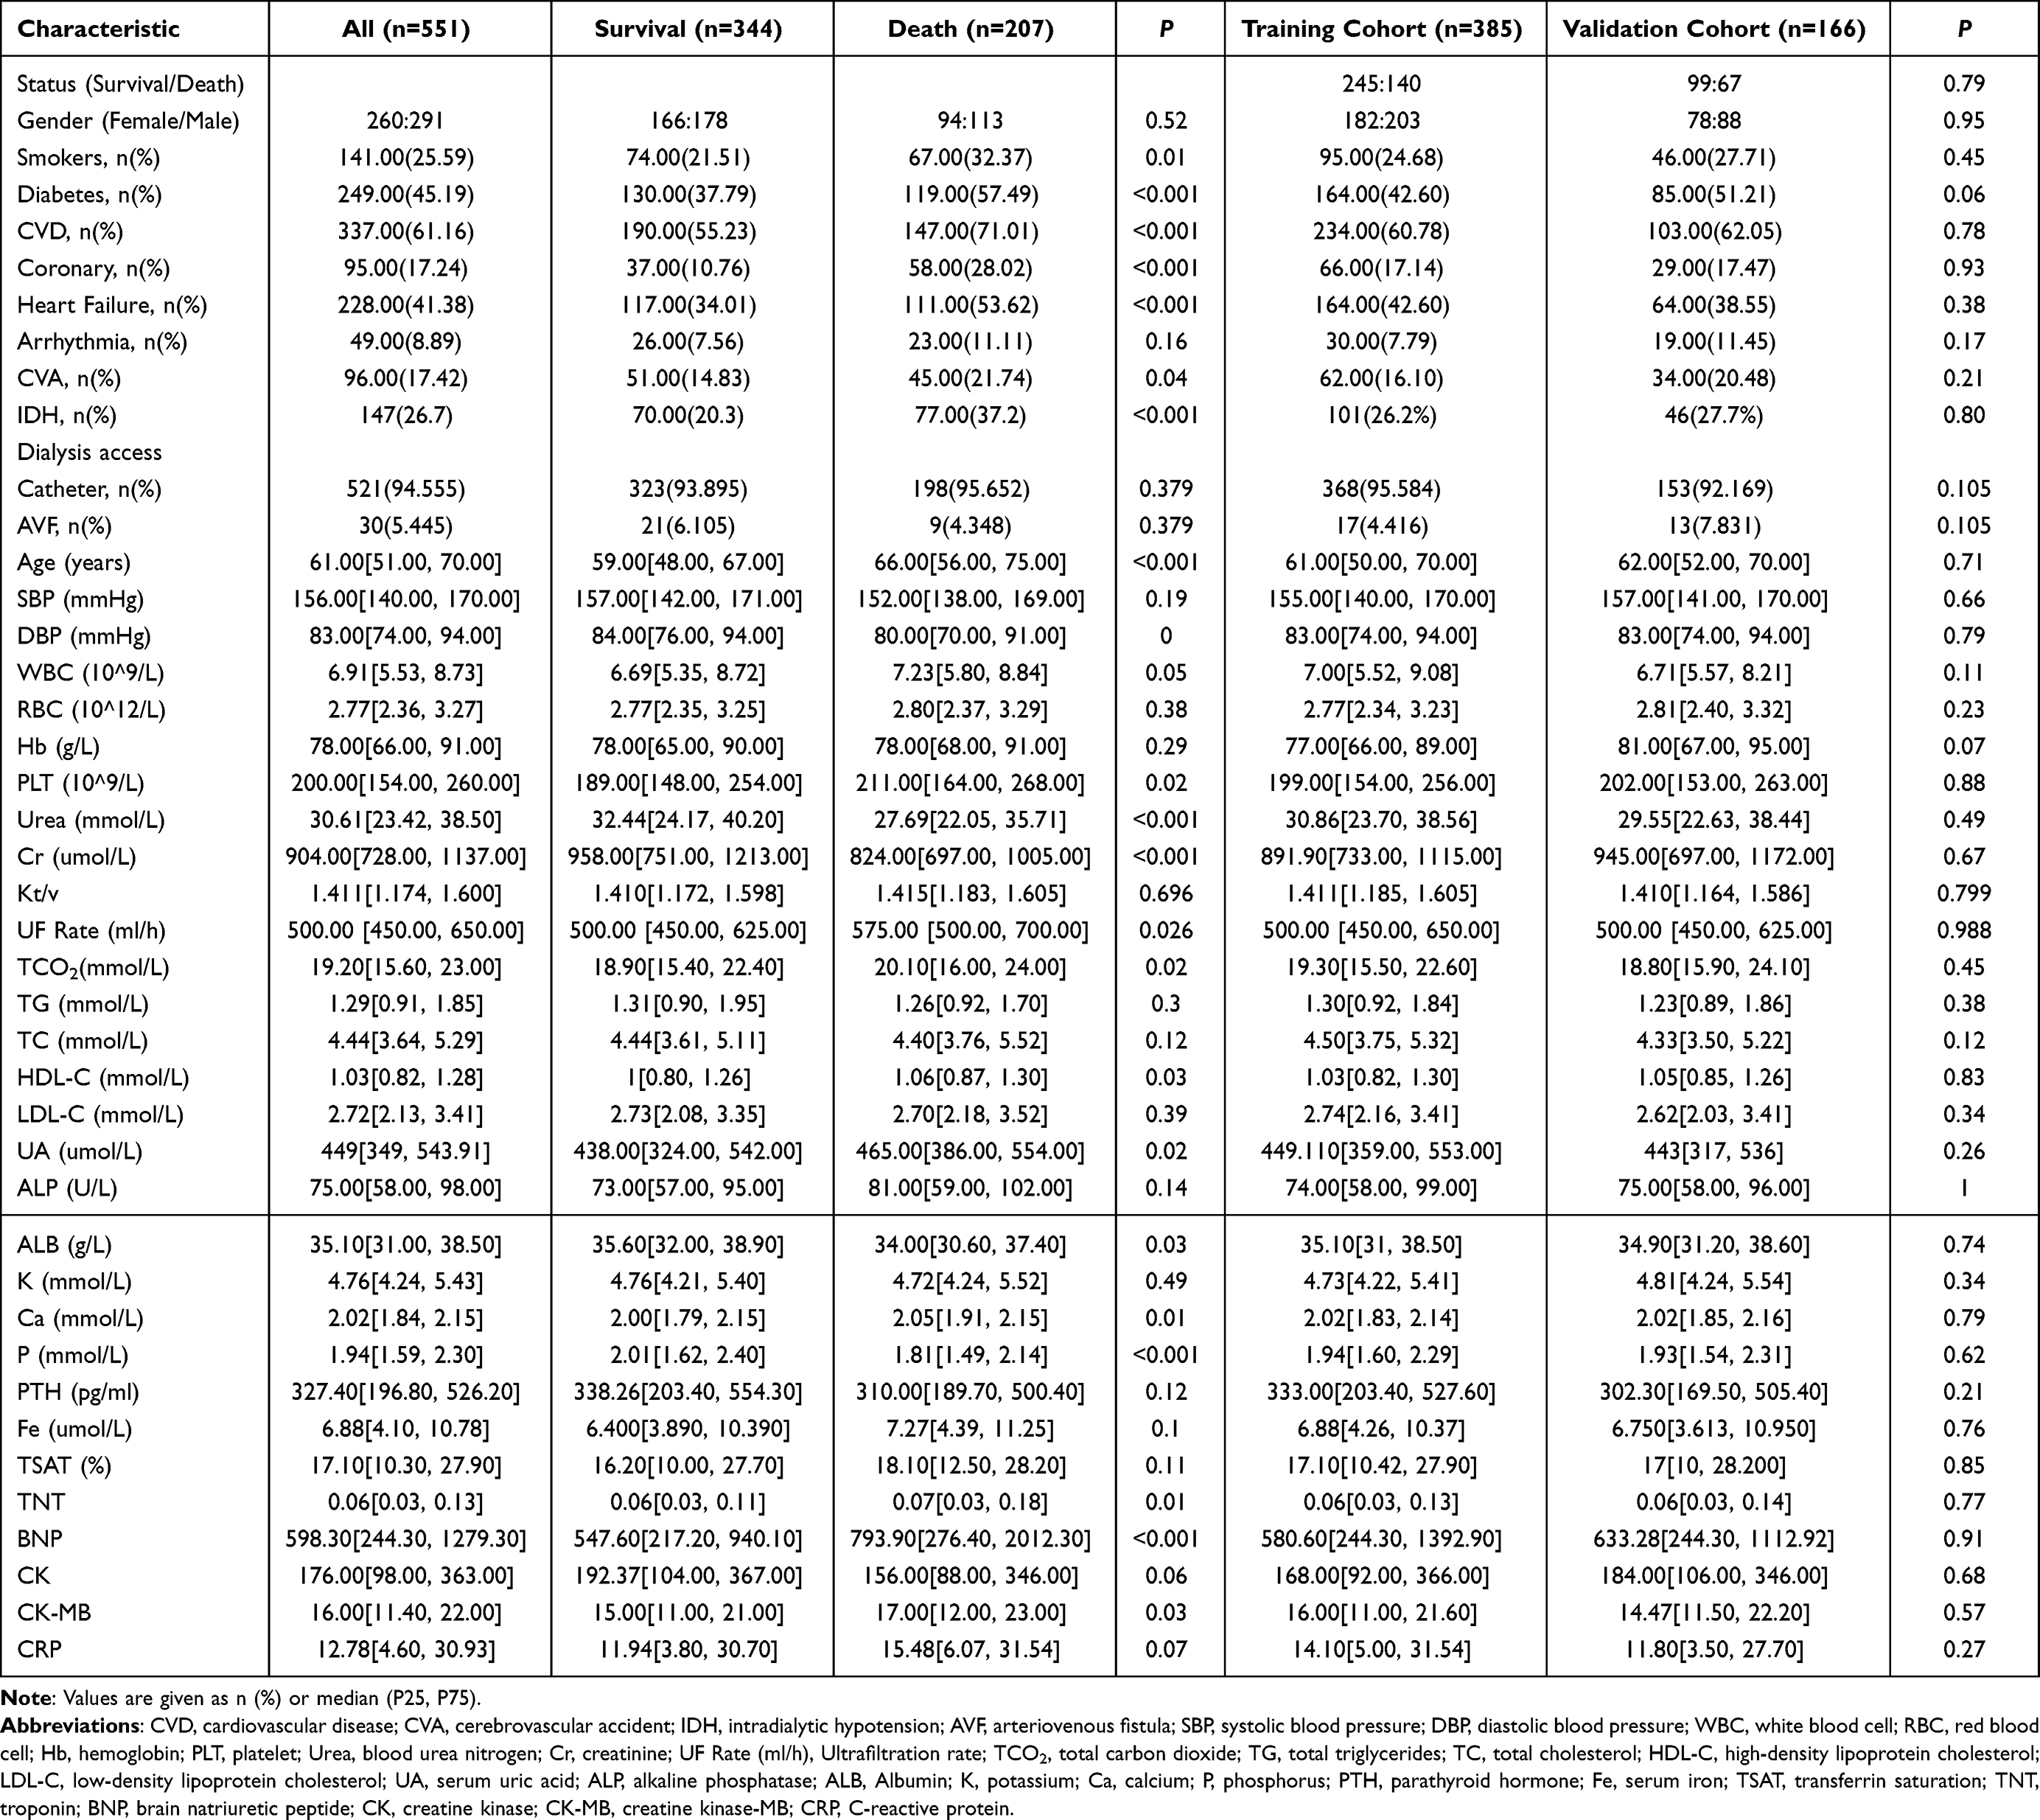 |
Table 1 Baseline Characteristics of the Study Cohorts - Demographic, Clinical, and Laboratory Metrics |
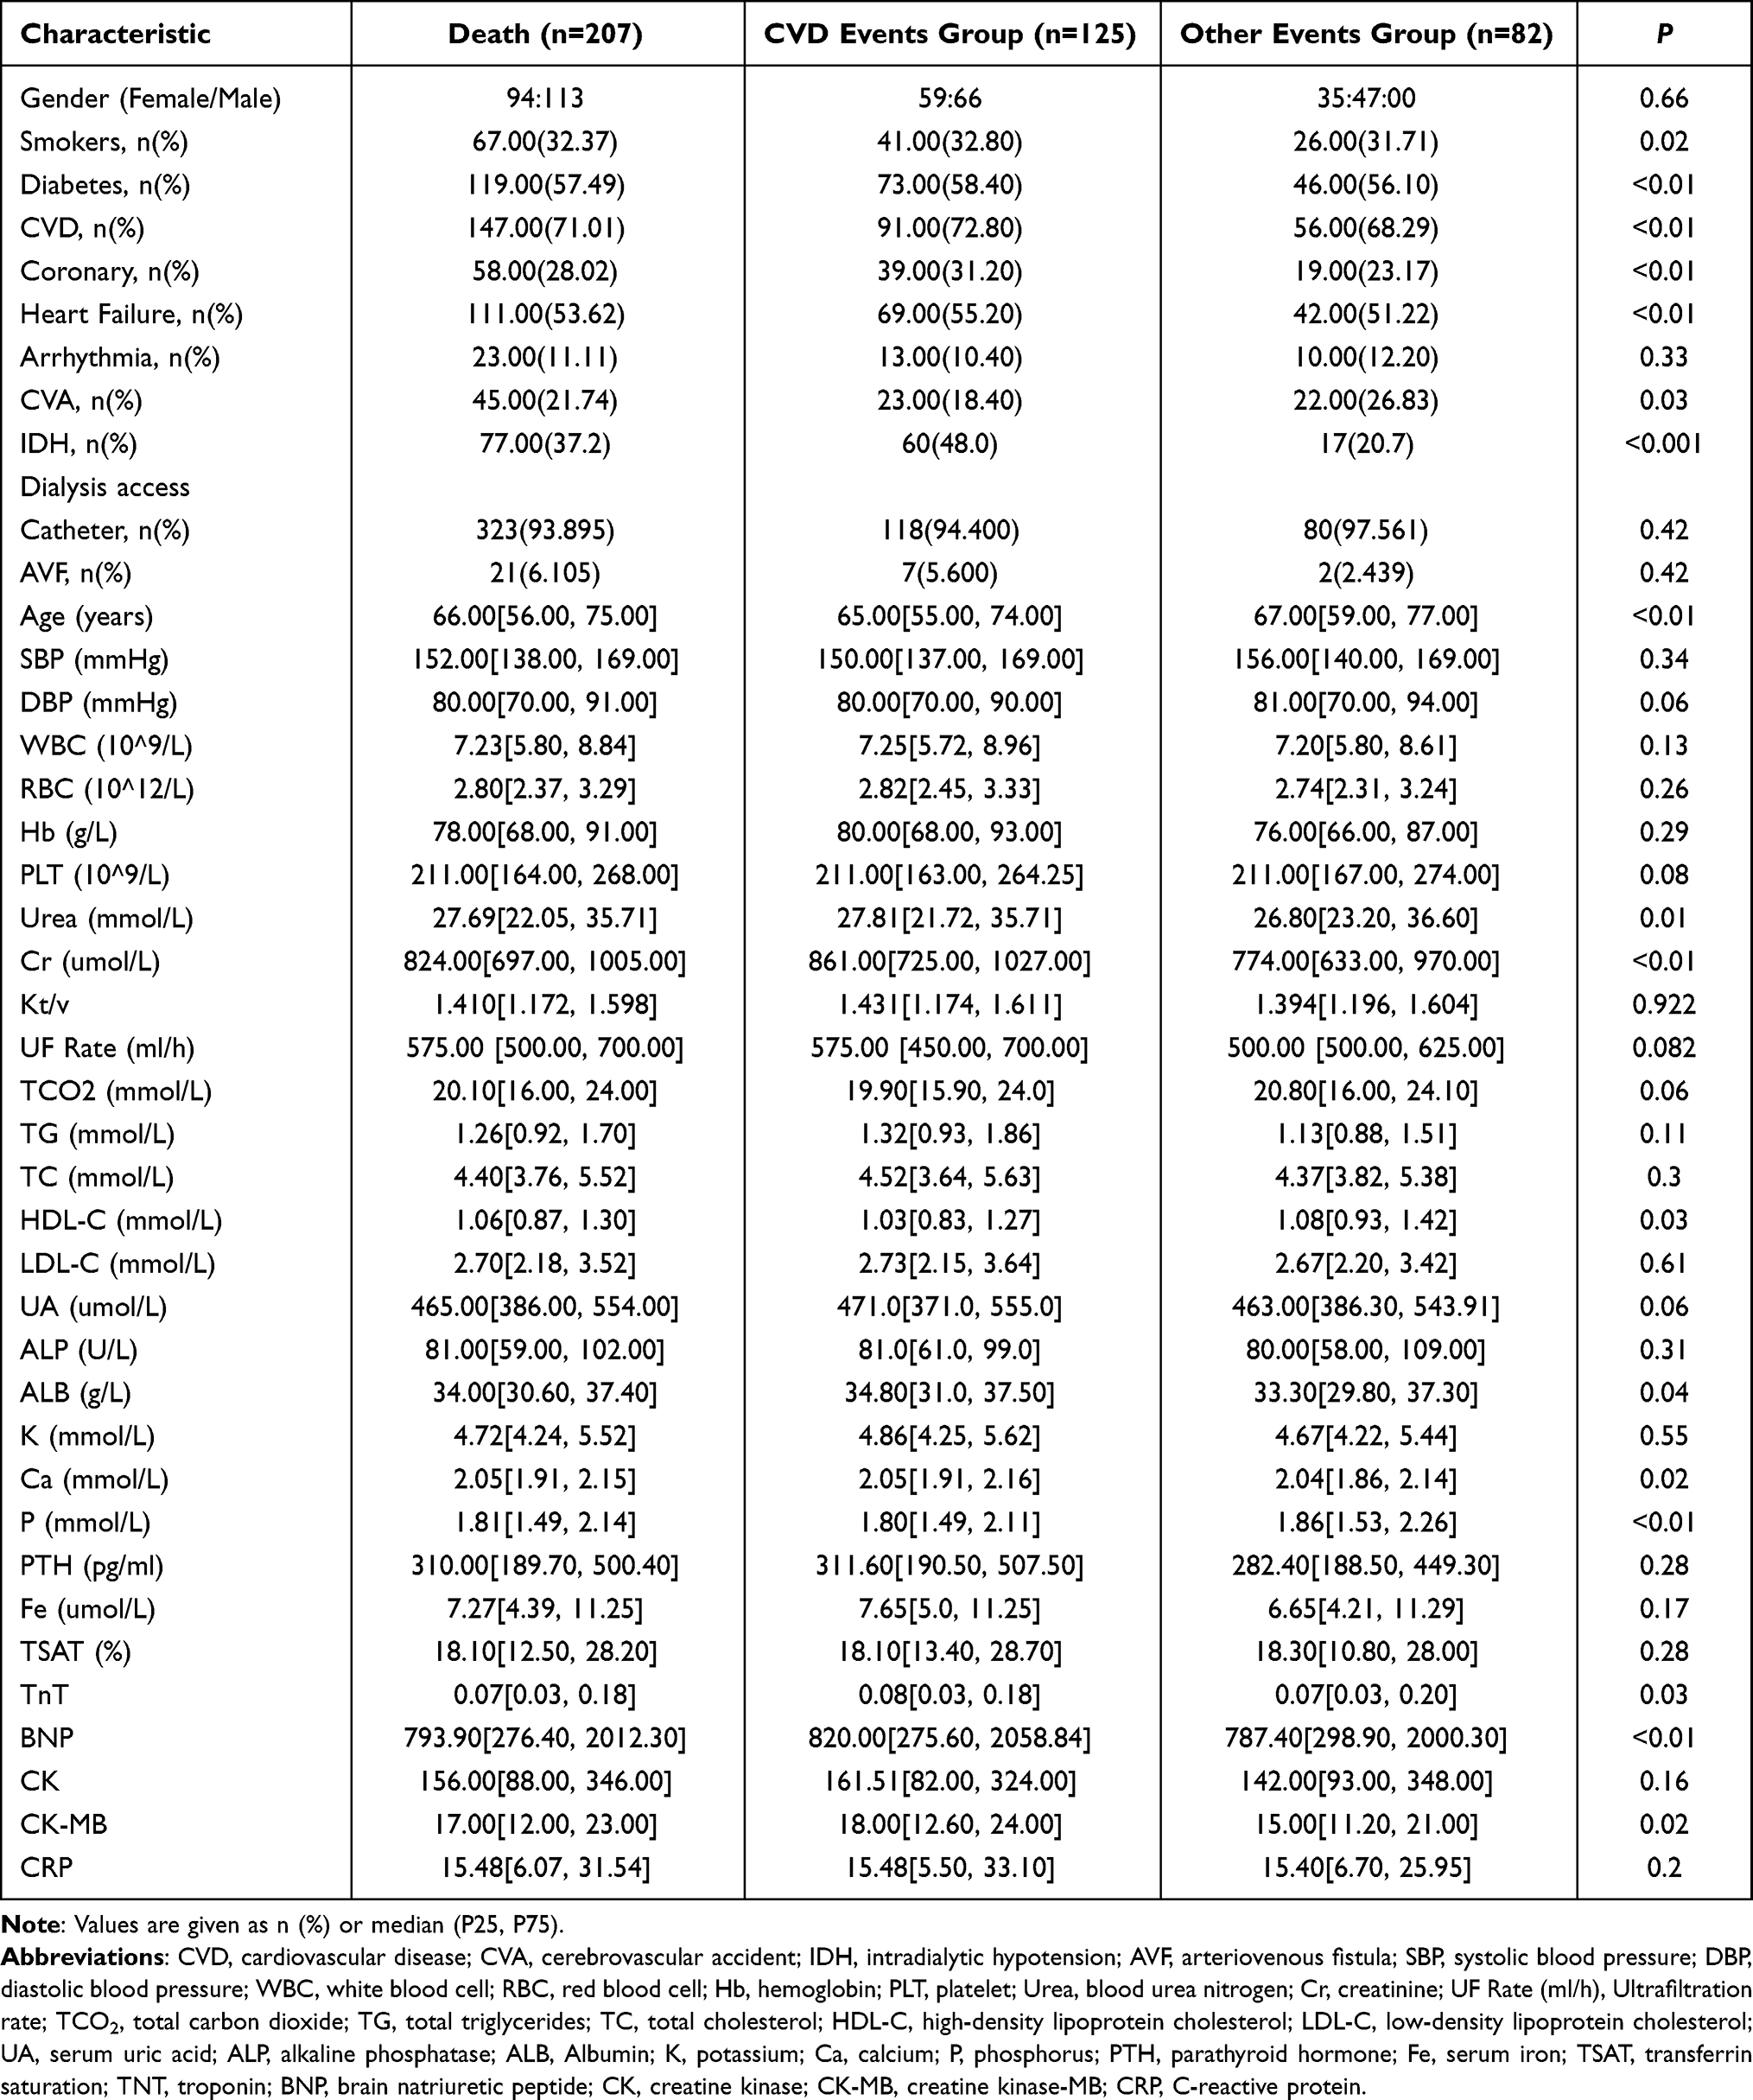 |
Table 2 The Comparison of Clinical Characteristics in the CVD Events and Other Events Group |
Table 1 showed that the median age at first entry into dialysis among the 551 HD cases was 61 years, with men comprising approximately 52.8% of the sample. There were 207 deaths (37.6%), with 94 women and 113 men. Smokers accounted for roughly a quarter of the population and had adverse outcomes. Approximately 45.19% of patients had diabetes, and over 60% had a CVD event. These percentages increased to 57.49% and 71.01% in the mortality population. Moreover, heart failure (53.62% VS 34.01%), coronary artery disease (28.02% VS 10.76%), and cerebrovascular disease (21.74% VS 14.83%) were statistically significantly more prevalent in the death group than in the survival group. Additionally, the average systolic and diastolic blood pressures were 156 mmHg and 83 mmHg, respectively. The survival group’s average systolic and diastolic blood pressures were higher than the death groups’, and this difference was statistically significant for diastolic blood pressure. Furthermore, patients in the death group had higher inflammatory markers and cardiac enzymes, as well as poorer nutritional status (ALB) and uric acid excretion capacity. However, subgroup analysis revealed differences.
Heart failure (55.2% VS 51.22%) and coronary artery disease (31.20% VS 23.17%) were more prevalent in the CVD events group than in the other events group, which was the same for the survival group compared to the death group. The CVD group had a higher risk of comorbid diabetes. Cerebrovascular disease was more prevalent and statistically significant in the other causes of death group (18.40% versus 26.83%). Additionally, the occurrence of intradialytic hypotension varied between groups, showing a considerably higher frequency in the CVD events group. The ultrafiltration (UF) rate was particularly rapid in the CVD events group. Their urea nitrogen and creatinine values were significantly higher than those of the other event groups, indicating poor general health. Inflammatory indicators did not differ significantly between the two groups, while other causes of death had a relatively low nutritional status and better HDL-C and cardiac enzyme indexes. Table 2 provides detailed information on the general characteristics of the CVD group compared to the other events group.
The Results of the Selection of Variables
For model 1, in the training cohort, 15 indicators derived from univariate regression analysis were found closely linked with all-cause mortality, including age, sex (male), the history of diabetes, CVD, arrhythmia, coronary artery disease, or heart failure, RBC, HB, UA, ALB, P, serum Cr, diastolic blood pressure, TG, and TC. Ultimately, seven variables were found to have predictive value in Cox regression analysis, namely age, sex (male), the history of diabetes, the history of coronary artery disease, DBP, TG, and TC. In Model 2, fine-gray analysis identified three variables with predictive value: a history of diabetes, a history of coronary artery disease, and TC. Detailed statistics are presented in Table 3 and Table 4.
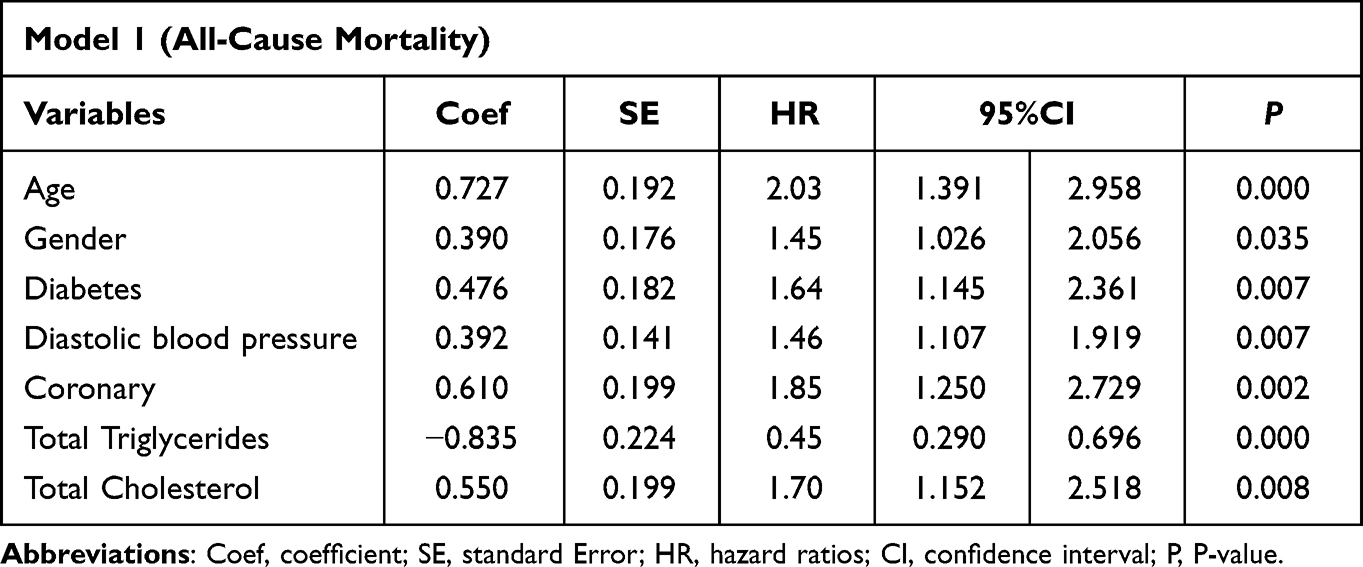 |
Table 3 Results for the Relationship Between Prognostic Risk Factors and All-Cause Mortality of Multiple Regression Based on Cox-Proportional Model. (Model 1) |
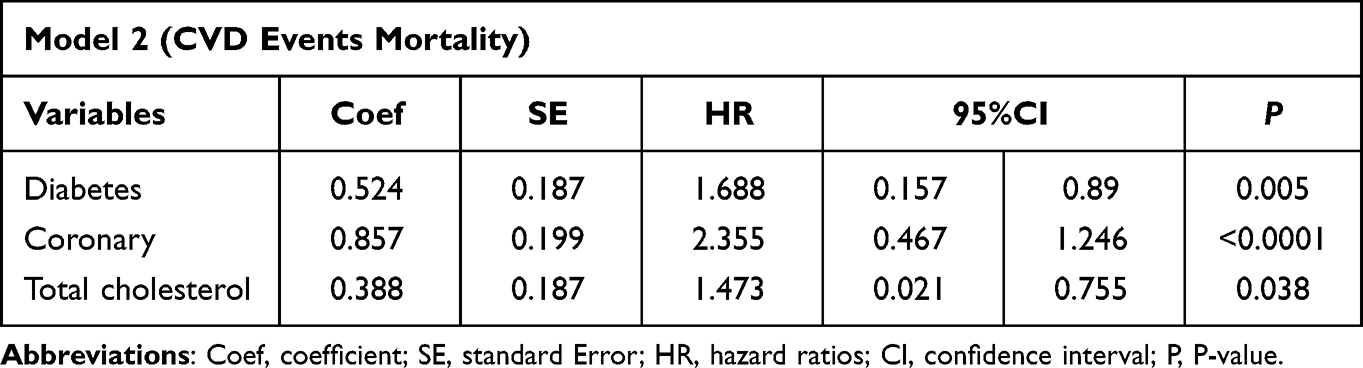 |
Table 4 Results for the Relationship Between Prognostic Risk Factors and CVD Events Mortality of Fine-Gray Proportional Hazards Model. (Model 2) |
Nomogram for Predicting Survival
For model 1, the nomogram made significant prognostic factors visualization based on the multivariate Cox regression. In the sample of this model, for patients whose age >60 years, male, diastolic blood pressure<60mmHg, TG<1.7mmol/L, TC>5.18mmol/L and have the history of diabetes and coronary were associated with a higher risk of death outcomes. These variables correspond to patients with a definite risk score (ranging from 0 to 10) as the above classification changed as shown in Table 3. Furthermore, the total risk score could be calculated to reflect the survival probability for 3-, 5-, and 8-year patients on HD in the nomogram (Figure 2).
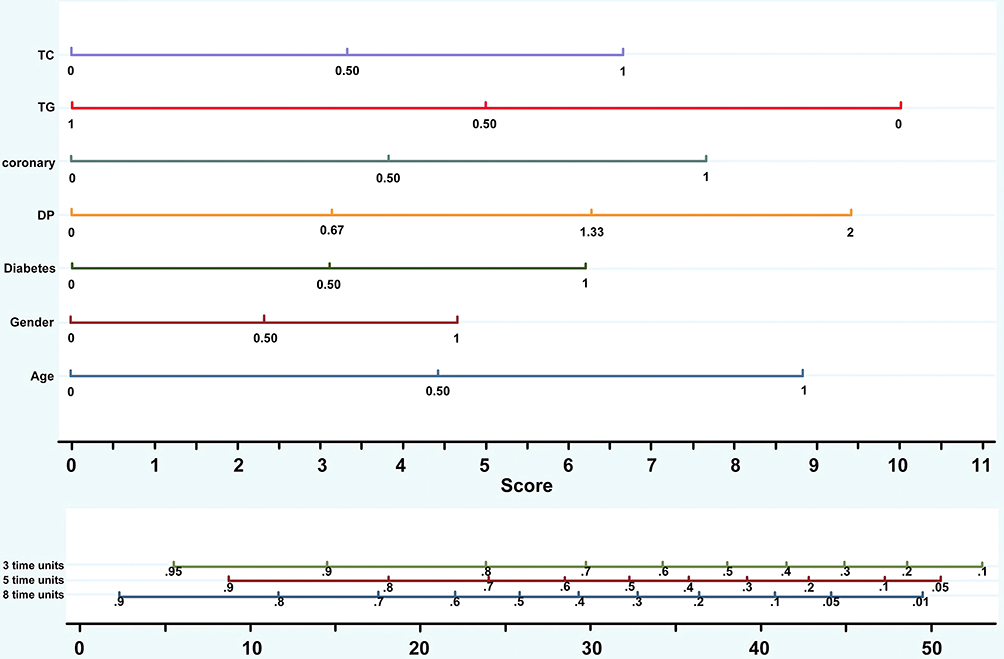 |
Figure 2 Nomogram of model 1 for predicting risk of all cause mortality in HD Patients. Notes: The nomogram, developed based on multivariate Cox regression analysis (model 1), visually represents significant prognostic factors. It incorporates risk scores of each variable to calculate the total risk scores, providing an estimation of the survival probability for HD patients at 3-, 5-, and 8-year intervals. |
Incorporating prognostic factors using the fine-gray proportional hazards model analysis was applied to model 2. As presented in Table 4, similar to model 1, CVD events were associated with the patient’s history of diabetes, history of coronary, and elevator TC. A risk score ranging from 0 to 100 was determined based on these significant factors, using the other nomogram depicted in Figure 3. Using this nomogram, the probability of CVD-related mortality at different time points can be calculated for each patient.
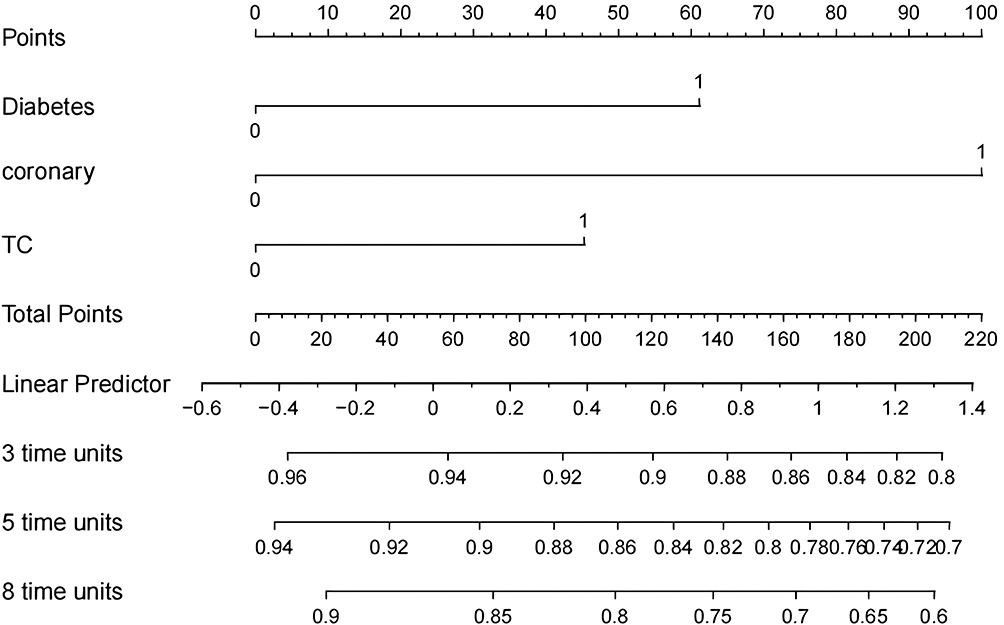 |
Figure 3 Nomogram of model 2 for predicting risk of CVD events mortality in HD Patients. Notes: The nomogram, developed based on fine-gray regression analysis (model 2), visually represents significant prognostic factors. It incorporates risk scores of each variable to calculate the total risk scores, providing an estimation of the survival probability into CVD-related mortality risk for HD patients at 3-, 5-, and 8-year intervals. |
Model Validation
The model’s performance was evaluated using discrimination and calibration curves. Model 1 demonstrated excellent predictive efficiency in the training cohort over 3-, 5-, and 8-year periods, as indicated by AUC values of 0.716, 0.722, and 0.725, respectively (Figure 4). In the validation cohort, model 1 showed moderately high performance with AUC values of 0.669, 0.689, and 0.673 Model 2 exhibited good discrimination with AUC values of 0.702, 0.695, and 0.677 (Figure 5). The calibration curve showed that the predicted incidence of death events was consistent with the realities in the training and validation cohort of model 1 (Figure 6). Additionally, the curve predicting CVD event mortality risk in model 2 fit the actual situation well (Figure 7).
 |
Figure 4 Discrimination performance of model 1 in predicting all-cause mortality: AUC in the training and validation cohorts over 3-, 5-, and 8-year periods (3-, 5-, 8-from left to right). Notes: (A) AUC of all-cause mortality in the training cohort for model 1: 3-year AUC: 0.716. 5-year AUC: 0.722. 8-year AUC: 0.725. (B) AUC of all-cause mortality in the validation cohort for model 1: 3-year AUC: 0.669. 5-year AUC: 0.689. 8-year AUC: 0.673. |
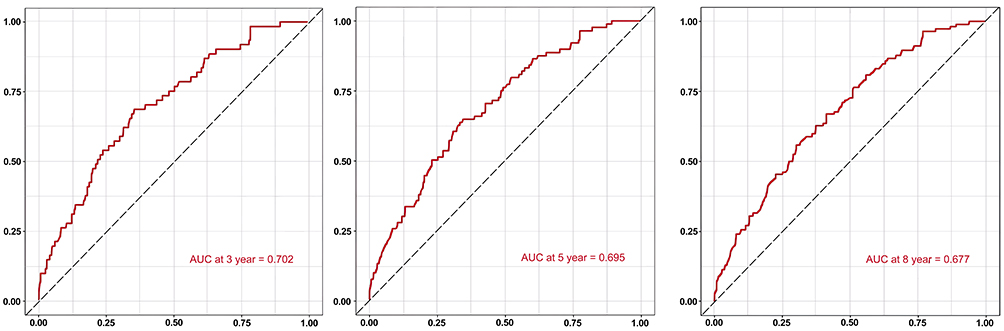 |
Figure 5 Discrimination performance of model 2 in predicting CVD events mortality: AUC over 3-, 5-, and 8-year periods (3-, 5-, 8-from left to right). Notes: AUC of CVD events mortality in model 2: 3-year AUC: 0.702. 5-year AUC: 0.695. 8-year AUC: 0.677. |
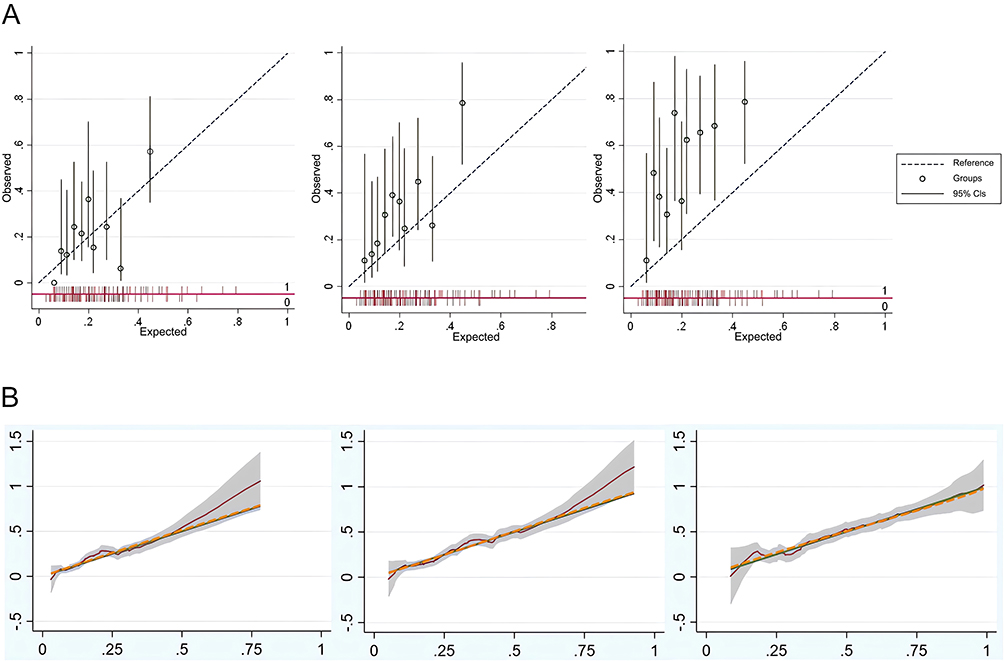 |
Figure 6 Calibration Performance of model 1’s training and validation cohorts for 3-, 5-, and 8-year periods (3-, 5-, 8-from left to right). Notes: (A) Calibration plots for predicting the probability of all-cause mortality in the training cohort in different periods (3-, 5-, and 8-year). (B) Calibration plots for predicting the probability of all-cause mortality in the validation cohort in different periods (3-, 5-, and 8-year). |
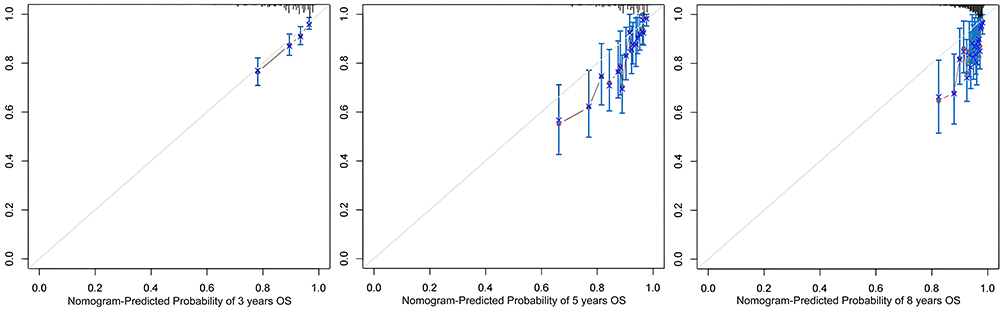 |
Figure 7 Calibration performance of model 2 for 3-, 5-, and 8-year periods (3-, 5-, 8-from left to right). Notes: The calibration plot for predicting the probability of CVD event mortality in different periods (3-, 5-, and 8-year). |
DCA
The clinical utility of models 1 and 2 was evaluated by DCA, respectively, in Figures 8 and 9, which illustrated the clinical application ability as acceptable net benefit performances were obtained.
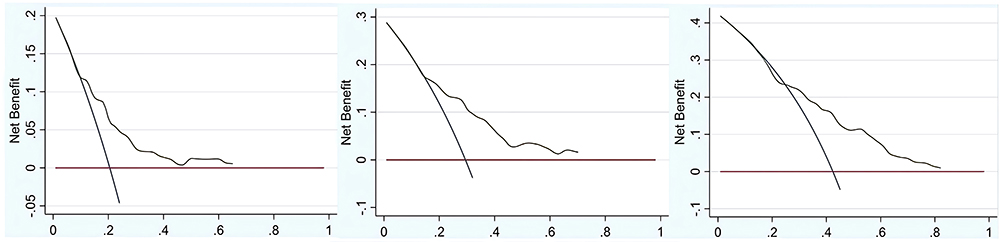 |
Figure 8 Decision curve analysis of model 1’s clinical utility for 3-, 5-, and 8-year all cause mortality prediction (3-, 5-, 8-from left to right). Notes: The acceptable net benefit performances illustrated by curves demonstrate the potential value of model 1 in predicting all-cause mortality. |
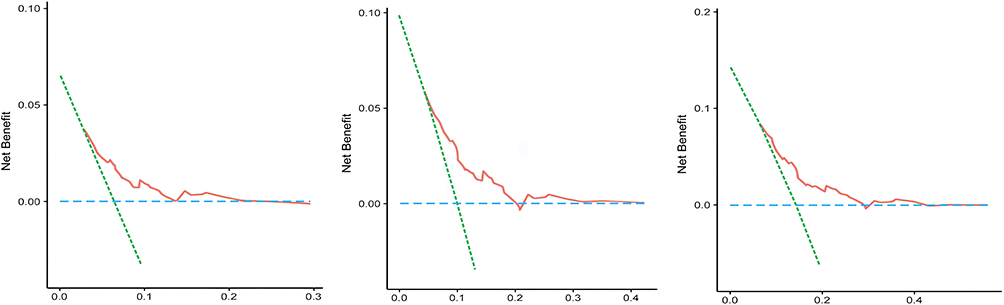 |
Figure 9 Decision curve analysis of model 2’s clinical utility for 3-, 5-, and 8-year CVD events mortality prediction (3-, 5-, 8-from left to right). Notes: The acceptable net benefit performances illustrated by curves demonstrate the potential value of model 2 in predicting CVD events mortality. |
Discussion
In this investigation, we computed the probabilities of all-cause mortality risk and CVD event mortality risk in HD patients. We devised and validated two user-friendly nomograms that utilize readily available baseline variables to provide information about all-cause mortality risk and CVD mortality risk in HD patients. The Cox proportional hazards model (model 1) was established and validated, and we identified age, sex, a history of diabetes and coronary artery disease, diastolic blood pressure, TG, and TC as significant indicators. In addition, we generated three indicators from model 2 based on fine-gray competing risk analysis, including history of diabetes and coronary artery disease, and TC. Both models demonstrated good calibration and discrimination, indicating their suitability for clinical application in survival prediction.
It has been demonstrated that age is an independent risk factor for many chronic diseases, including ESRD. Aging progressively affects the structure and function of the vasculature, leading to hemodynamic disturbance due to increased oxidative stress, premature cellular senescence, and impairments in the synthesis and/or secretion of endothelium-derived vasoactive molecules. This in turn results in a higher incidence of cardiovascular events in older patients with MHD. A study by Wu22 collected data on DKD deaths in China from 1990 to 2019 and demonstrated that the risk of DKD deaths increased exponentially with age for both sexes. Older patients have more fragile body functions and immune systems, which may be the possible explanation, as they tend to suffer concurrent complications more often than younger patients. Our model revealed that men on HD are at a higher risk for adverse outcomes than women. Women overall had lower all-cause and cardiovascular mortality rates. Several theories have been suggested, such as sex-specific differences in oxidative stress, metabolism of nitrogen oxide, and the actions of sex steroids.23 The predominance of data in humans suggests that the course of nondiabetic kidney disease is more aggressive in men than women. Male gender is arguably also a risk factor for progression of diabetic nephropathy.24
Diabetes and coronary artery disease exert deleterious effects on hemodialysis (HD) patients. Prior investigations have indicated that individuals with chronic kidney disease tend to have an unfavorable prognosis after experiencing cardiovascular disease (CVD).25 Given that CVD events contribute to over 40% of fatalities among those with end-stage renal disease (ESRD), and the proportion augmented to 60% in our sample. Notably, coronary artery disease represents a prominent cause of CVD. The prevalence of asymptomatic coronary artery disease (CAD) in hemodialysis patients appears to rise commensurately with the increasing age and prevalence of diabetes in the hemodialysis population.26 Moreover, the Global Registry of Acute Coronary Events study has demonstrated that patients undergoing dialysis concurrently with acute coronary syndromes exhibit significantly greater in-hospital and six-month mortality rates than the non-dialysis population.27
Nevertheless, the mortality risk associated with diabetes in HD patients is no less than that of coronary heart disease. According to a recent 2021 investigation,28 the proportion of ESRD patients with diabetes rose from 19% to 29.7%. Chronic hyperglycemia resulting in microvascular disease complications as diabetes progresses significantly reduces life expectancy among those with renal complications.29,30 Intensive management of diabetes is critical for HD patients as the mortality rate of diabetic patients on dialysis is higher than that of nondiabetic patients.31 In our study, both 2 models demonstrated significantly lower survival times among HD patients with diabetes. Considering the limitations doctors face in obtaining accurate information regarding HD patients’ glucose fluctuation patterns,32 a more rational dietary sugar control program, appropriate functional exercise, and improved patient self-management are warranted.
Numerous studies have reported the phenomenon of “reverse epidemiology” where a U-shaped or L-shaped association exists between blood pressure and mortality in dialysis patients. Hypotension during dialysis is a common complication associated with cardiovascular disease, vascular access thrombosis, and insufficient dialysis doses. Our study suggests that the risk of death rapidly increases when the diastolic pressure is below 79 mmHg. While some scholars have called for aggressive hypertension management policies to lower systolic blood pressure and reduce proteinuria levels, such intensive treatment inevitably leads to lower diastolic blood pressure.33 A prospective cohort of 9333 HD patients found an L-shaped association of diastolic pressure with all-cause mortality and a U-shaped association with CVD event mortality.34 Low diastolic pressure in HD patients with significant coronary artery disease leads to in-adequate coronary perfusion and increased risk of ischaemic cardiovascular events.35 In our study, excessively low diastolic blood pressure was also found to be detrimental to survival outcomes, and we suggest that treatment and prevention measures be improved based on these results.
While elevated serum TG and TC levels are known risk factors for chronic diseases, particularly CVD, our study’s findings based on the Cox proportional model show that mortality in patients with ESRD is associated with decreased TG. Similar reports support this idea.36,37 A cohort of 50,673 HD patients found that elevated TG/HDL-C was associated with better survival. Another study discovered a significant interaction between TG and survival outcomes via the mediating variable of waist circumference. An excess of 50 mg/dL in TG combined with a waist circumference of less than 95 cm resulted in a lower risk of all-cause mortality. Our study showed that high TC was an independent risk factor for death in all-cause and CVD, which is consistent with most research results. There is evidence that increased cholesterol levels were associated with high CVD risk,38 and the incidences of ischemic heart disease and CVD are significantly positively associated with higher cholesterol in HD patients. Another study found an association between higher serum levels of cholestanol, a marker of intestinal cholesterol absorption that indicates higher cholesterol, and increased mortality in patients on HD.39
Compared to other models, the present models offered prognostic capabilities for patients on hemodialysis (HD) for up to 8 years and assess the risks of all-cause and cardiovascular disease (CVD) mortality accordingly. The predictive nomogram exhibited sufficient accuracy and discriminative power. For patients at high risk of CVD, glycemic control, blood pressure stabilization, cardiac function improvement, and intensive lipid-lowering measures may be critical in extending life. Furthermore, since the data collected by this model is easily accessible, it can be applied even in primary care institutions with limited laboratory resources. This facilitates stratified management and referral, expanding the scope of this model’s application. Primary care physicians can identify high-risk groups more easily and manage the disease better or refer patients to higher-level hospitals in a timely manner. The most attractive feature of our model is its clinical feasibility and multifaceted applications in multiple medical and health sectors. Early intervention will benefit high-risk patients on HD. User-friendly nomograms are relatively straightforward to understand and can not only identify the risk level of patients on HD at an early stage, but also provide guidance on patients’ daily behaviors, such as dietary habits and exercise intensity. In regions with limited medical resources and developing countries, simple models based on universally available indicators are more easily promoted and accepted by the public. The United States Renal Data System40 reported that the median survival among patients on HD was approximately 47 months in 2013. However, as of June 2022, the proportion of patients who had been on dialysis for more than 5 years reached 71.49% in our cohort study. This result may be attributed to the general management of our dialysis center, which was assisted by information provided by our predictive risk models.
The current clinical models for risk assessment in patients undergoing HD have various limitations. Firstly, the patient data in this study was obtained from a single center, and the absence of external validation hinders the extended application of this model. Furthermore, the sample size of our study was inadequate due to incomplete original information, leading to the validation set’s absence for model 2. Secondly, mediating effects among influencing factors were not investigated, and there is a possibility that interactions were overlooked. Thirdly, as the demographic characteristics were based on Chinese patients on HD, additional regions and ethnicities’ further validation of models are required. Lastly, the current models are only suitable for patients on HD, and their use in peritoneal dialysis or other renal failure patients are limited. Future research directions may include prospective controlled studies based on existing risk prediction models to assess the effectiveness of preventive treatments. Furthermore, constructing a further external validation of the model can be done by expanding the sample size to include patient information from multiple other hospitals.
Conclusion
This study developed two clinical models that included useful nomograms for predicting 3-, 5-, and 8-year survival in patients on HD. Our predictive instruments evaluated all-cause mortality and the risk of CVD mortality in a more comprehensive and adaptable manner, thereby aiding clinical decision-making and enhancing patient prognosis.
Data Sharing Statement
The data that support the findings of this study are available from the corresponding author Qizhan Lin upon reasonable request.
Institutional Review Board Statement
This study was approved by The Clinical Re-search Ethics Committee of Guangdong Provincial Hospital of Traditional Chinese Medicine (No. ethics number: BE2020-278-01).
Informed Consent Statement
Patient consent was waived for this retrospective study of data from electronic medical records.
Acknowledgments
The authors thank all patients who participated in this study for their contributions.
Author Contributions
All authors have made substantial contributions to the present study, encompassing its conception, study design, execution, data acquisition, analysis and interpretation. Furthermore, they have actively participated in the drafting, revision, and critical review of the manuscript. Final approval of the publication version has been granted by all authors. Additionally, they have reached a consensus on the selection of the journal for article submission and have acknowledged their responsibility for all aspects of the work.
Funding
This study was supported by the Guangdong Provincial Administration of Traditional Chinese Medicine (grant number:20201131); and the Specialized Research Projects of Guangdong Provincial Hospital of Traditional Chinese Medicine(grant number:YN2020QN20); and the TCM Specialist Zhang Qi’s Academic Experience Heritage Studio (grant number:E43712).
Disclosure
The authors declare that they have no competing interests.
References
1. Ene-Iordache B, Perico N, Bikbov B, et al. Chronic kidney disease and cardiovascular risk in six regions of the world (ISN-KDDC): a cross-sectional study. Lancet Glob Health. 2016;4(5):e307–19. doi:10.1016/s2214-109x(16)00071-1
2. Zhang L, Wang F, Wang L, et al. Prevalence of chronic kidney disease in China: a cross-sectional survey. Lancet. 2012;379(9818):815–822. doi:10.1016/S0140-6736(12)60033-6
3. Bikbov B, Purcell CA, Levey AS. Global, regional, and national burden of chronic kidney disease, 1990–2017: a systematic analysis for the Global Burden of Disease Study 2017. Lancet. 2020;395(10225):709–733. doi:10.1016/S0140-6736(20)30045-3
4. Himmelfarb J, Ikizler TA. Hemodialysis. N Engl J Med. 2010;363(19):1833–1845. doi:10.1056/NEJMra0902710
5. Liyanage T, Ninomiya T, Jha V, et al. Worldwide access to treatment for end-stage kidney disease: a systematic review. Lancet. 2015;385(9981):1975–1982. doi:10.1016/S0140-6736(14)61601-9
6. Wang F, Yang C, Long J, et al. Executive summary for the 2015 annual data report of the China Kidney Disease Network (CK-NET). Kidney Int. 2019;95(3):501–505. doi:10.1016/j.kint.2018.11.011
7. Johansen KL, Chertow GM, Gilbertson DT, et al. US renal data system 2021 annual data report: epidemiology of kidney disease in the United States. Am J Kidney Dis. 2022;4(Suppl 1):A8–A12. doi:10.1053/j.ajkd.2022.02.001
8. Loutradis C, Sarafidis PA, Ferro CJ, et al. Volume overload in hemodialysis: diagnosis, cardiovascular consequences, and management. Nephrol Dial Transplant. 2021;36(12):2182–2193. doi:10.1093/ndt/gfaa182
9. Liu ZH. Nephrology in China. Nat Rev Nephrol. 2013;9(9):523–528. doi:10.1038/nrneph.2013.146
10. Saran R, Robinson B, Abbott KC, et al. US renal data system 2019 annual data report: epidemiology of kidney disease in the United States. Am J Kidney Dis. 2020;75(1 Suppl 1):A6–a7. doi:10.1053/j.ajkd.2019.09.003
11. Ok E, Asci G, Chazot C, et al. Controversies and problems of volume control and hypertension in haemodialysis. Lancet. 2016;388(10041):285–293. doi:10.1016/S0140-6736(16)30389-0
12. Bulbul MC, Dagel T, Afsar B, et al. Disorders of lipid metabolism in chronic kidney disease. Blood Purif. 2018;46(2):144–152. doi:10.1159/000488816
13. Lerner B, Desrochers S, Tangri N. Risk prediction models in CKD. Semin Nephrol. 2017;37(2):144–150. doi:10.1016/j.semnephrol.2016.12.004
14. You X, Huang YY, Wang Y, et al. Prediction model for cardiovascular disease risk in hemodialysis patients. Int Urol Nephrol. 2022;54(5):1127–1134. doi:10.1007/s11255-021-02984-7
15. Floege J, Gillespie IA, Kronenberg F, et al. Development and validation of a predictive mortality risk score from a European hemodialysis cohort. Kidney Int. 2015;87(5):996–1008. doi:10.1038/ki.2014.419
16. Tangri N, Grams ME, Levey AS, et al. Multinational assessment of accuracy of equations for predicting risk of kidney failure: a meta-analysis. JAMA. 2016;315(2):164–174. doi:10.1001/jama.2015.18202
17. Ranstam J, Cook JA. Kaplan-Meier curve. Br J Surg. 2017;104(4):442. doi:10.1002/bjs.10238
18. Fisher LD, Lin DY. Time-dependent covariates in the Cox proportional-hazards regression model. Annu Rev Public Health. 1999;20:145–157. doi:10.1146/annurev.publhealth.20.1.145
19. Moolgavkar SH, Chang ET, Watson HN, Lau EC. An assessment of the cox proportional hazards regression model for epidemiologic studies. Risk Anal. 2018;38(4):777–794. doi:10.1111/risa.12865
20. Ng R, Sutradhar R, Yao Z, Wodchis WP, Rosella LC. Smoking, drinking, diet and physical activity-modifiable lifestyle risk factors and their associations with age to first chronic disease. Int J Epidemiol. 2020;49(1):113–130. doi:10.1093/ije/dyz078
21. Zhou B, Fine J, Latouche A, Labopin M. Competing risks regression for clustered data. Biostatistics. 2012;13(3):371–383. doi:10.1093/biostatistics/kxr032
22. Wu X, Du J, Li L, Cao W, Sun S. Bayesian age-period-cohort prediction of mortality of type 2 diabetic kidney disease in China: a modeling study. Front Endocrinol. 2021;12:767263. doi:10.3389/fendo.2021.767263
23. Carrero JJ, Hecking M, Chesnaye NC, Jager KJ. Sex and gender disparities in the epidemiology and outcomes of chronic kidney disease. Nat Rev Nephrol. 2018;14(3):151–164. doi:10.1038/nrneph.2017.181
24. Neugarten J, Golestaneh L. Gender and the prevalence and progression of renal disease. Adv Chronic Kidney Dis. 2013;20(5):390–395. doi:10.1053/j.ackd.2013.05.004
25. Grams ME, Sang Y, Ballew SH, et al. Predicting timing of clinical outcomes in patients with chronic kidney disease and severely decreased glomerular filtration rate. Kidney Int. 2018;93(6):1442–1451. doi:10.1016/j.kint.2018.01.009
26. De Vriese AS, Vandecasteele SJ, Van den Bergh B, et al. Should we screen for coronary artery disease in asymptomatic chronic dialysis patients? Kidney Int. 2012;81(2):143–151. doi:10.1038/ki.2011.340
27. Gurm HS, Gore JM, Anderson FA, et al. Comparison of acute coronary syndrome in patients receiving versus not receiving chronic dialysis (from the Global Registry of Acute Coronary Events [GRACE] Registry). Am J Cardiol. 2012;109(1):19–25. doi:10.1016/j.amjcard.2011.07.062
28. Cheng HT, Xu X, Lim PS, Hung KY. Worldwide epidemiology of diabetes-related end-stage renal disease, 2000–2015. Diabetes Care. 2021;44(1):89–97. doi:10.2337/dc20-1913
29. Faselis C, Katsimardou A, Imprialos K, et al. Microvascular complications of type 2 diabetes mellitus. Curr Vasc Pharmacol. 2020;18(2):117–124. doi:10.2174/1570161117666190502103733
30. Wanner C, Inzucchi SE, Lachin JM, et al. Empagliflozin and progression of kidney disease in type 2 diabetes. N Engl J Med. 2016;375(4):323–334. doi:10.1056/NEJMoa1515920
31. Marrocos MSM, Teixeira AA, Quinto BM, et al. Diabetes acts on mortality in hemodialysis patients predicted by asymmetric dimethylarginine and inflammation. Nefrologia. 2022;49(2):177–185. doi:10.1016/j.nefro.2021.02.006
32. Hu K, Peng H, Ma Y, et al. Analysis of glycemic improvement in hemodialysis patients based on time in range, assessed by flash glucose monitoring. Blood Purif. 2021;50(6):883–890. doi:10.1159/000513162
33. Nesrallah GE, Suri RS, Guyatt G, et al. Biofeedback dialysis for hypotension and hypervolemia: a systematic review and meta-analysis. Nephrol Dial Transplant. 2013;28(1):182–191. doi:10.1093/ndt/gfs389
34. Hannedouche T, Roth H, Krummel T, et al. Multiphasic effects of blood pressure on survival in hemodialysis patients. Kidney Int. 2016;90(3):674–684. doi:10.1016/j.kint.2016.05.025
35. Cohen-Hagai K, Fanadka F, Grumberg T, et al. Diastolic blood pressure is associated with brain atrophy in hemodialysis patients: a single center case-control study. Ther Apher Dial. 2022;26(1):94–102. doi:10.1111/1744-9987.13647
36. Chang TI, Streja E, Soohoo M, et al. Association of serum triglyceride to HDL cholesterol ratio with all-cause and cardiovascular mortality in incident hemodialysis patients. Clin J Am Soc Nephrol. 2017;12(4):591–602. doi:10.2215/CJN.08730816
37. Moradi H, Streja E, Kashyap ML, Vaziri ND, Fonarow GC, Kalantar-Zadeh K. Elevated high-density lipoprotein cholesterol and cardiovascular mortality in maintenance hemodialysis patients. Nephrol Dial Transplant. 2014;29(8):1554–1562. doi:10.1093/ndt/gfu022
38. Jeong SM, Choi S, Kim K, et al. Effect of change in total cholesterol levels on cardiovascular disease among young adults. J Am Heart Assoc. 2018;12:27.
39. Rogacev KS, Pinsdorf T, Weingärtner O, et al. Cholesterol synthesis, cholesterol absorption, and mortality in hemodialysis patients. Clin J Am Soc Nephrol. 2012;7(6):943–948. doi:10.2215/CJN.05170511
40. Johansen KL, Chertow GM, Foley RN, et al. US renal data system 2020 annual data report: epidemiology of kidney disease in the United States. Am J Kidney Dis. 2021;77(4 Suppl 1):A7–A8. doi:10.1053/j.ajkd.2021.01.002
 © 2023 The Author(s). This work is published and licensed by Dove Medical Press Limited. The
full terms of this license are available at https://www.dovepress.com/terms
and incorporate the Creative Commons Attribution
- Non Commercial (unported, 3.0) License.
By accessing the work you hereby accept the Terms. Non-commercial uses of the work are permitted
without any further permission from Dove Medical Press Limited, provided the work is properly
attributed. For permission for commercial use of this work, please see paragraphs 4.2 and 5 of our Terms.
© 2023 The Author(s). This work is published and licensed by Dove Medical Press Limited. The
full terms of this license are available at https://www.dovepress.com/terms
and incorporate the Creative Commons Attribution
- Non Commercial (unported, 3.0) License.
By accessing the work you hereby accept the Terms. Non-commercial uses of the work are permitted
without any further permission from Dove Medical Press Limited, provided the work is properly
attributed. For permission for commercial use of this work, please see paragraphs 4.2 and 5 of our Terms.
Recommended articles
Development of Risk Prediction Model for Muscular Calf Vein Thrombosis with Acute Exacerbation of Chronic Obstructive Pulmonary Disease
Hu X, Li X, Xu H, Zheng W, Wang J, Wang W, Li S, Zhang N, Wang Y, Han K
International Journal of General Medicine 2022, 15:6549-6560
Published Date: 10 August 2022
Development and Validation of a Risk Nomogram Model for Predicting Constipation in Patients with Type 2 Diabetes Mellitus
Yuan HL, Zhang X, Peng DZ, Lin GB, Li HH, Li FX, Lu JJ, Chu WW
Diabetes, Metabolic Syndrome and Obesity 2023, 16:1109-1120
Published Date: 20 April 2023
Clinical Characteristics, Drug Resistance, and Risk Factors for Death of Klebsiella pneumoniae Infection in Patients with Acute Pancreatitis: A Single-Center Retrospective Study from China
Jia Y, Liu Y, Huang Y, Wang J, Wang H, Tan S, Shi Y, Wang Q, Peng J
Infection and Drug Resistance 2023, 16:5039-5053
Published Date: 7 August 2023
Current Knowledge of Beta-Blockers in Chronic Hemodialysis Patients
Haddiya I, Valoti S
International Journal of Nephrology and Renovascular Disease 2023, 16:223-230
Published Date: 12 October 2023
The Relationship Between Fracture and Mortality in a Chinese Maintenance Hemodialysis Patients Cohort
Liu X, Liu Z, Niu Y, Zhang K, Zhang X, Yu C
Journal of Multidisciplinary Healthcare 2024, 17:2031-2038
Published Date: 1 May 2024