Back to Journals » Psychology Research and Behavior Management » Volume 14
Development and Validation of Peer Relationship Scale for Chinese Community-Dwelling Elderly
Authors Fu J ![]() , Cheng Z, Liu S
, Cheng Z, Liu S ![]() , Hu Z, Zhong Z, Luo Y
, Hu Z, Zhong Z, Luo Y
Received 19 March 2021
Accepted for publication 27 May 2021
Published 28 June 2021 Volume 2021:14 Pages 889—903
DOI https://doi.org/10.2147/PRBM.S311352
Checked for plagiarism Yes
Review by Single anonymous peer review
Peer reviewer comments 2
Editor who approved publication: Dr Igor Elman
Jingjing Fu,1 Zhen Cheng,1 Siqi Liu,1 Zongping Hu,2 Zhu Zhong,1 Yu Luo1
1Department of Nursing Management, School of Nursing, Army Medical University (Third Military Medical University), Chongqing, People’s Republic of China; 2Department of Combination of Medical and Health, Thirteenth People’s Hospital of Chongqing, Chongqing, People’s Republic of China
Correspondence: Yu Luo
Department of Nursing Management, School of Nursing, Army Medical University (Third Military Medical University), No. 30 Gaotanyan Street, Shapingba District, Chongqing, 400038, People’s Republic of China
Tel +86-15730142871
Fax +86-23-68752356
Email [email protected]
Introduction: This study aimed to develop and psychometrically test the peer relationship scales (PRSs) for the Chinese community-dwelling elderly.
Methods: Based on the Adams–Blieszner–Ueno integrative conceptual framework, we first drafted item-pool from the literature review, in-depth interviews, and group discussion. After a cross-sectional study in Chongqing, PR, China, we recruited a random sample of 404 community-dwelling individuals aged ≥ 65 years. Subsequently, exploratory factor analysis (EFA) and confirmatory factor analysis (CFA) were performed to examine the factor structure of the scales. Cronbach’s alpha coefficient and split-half reliability were used to assess internal consistency. Moreover, test–retest reliability, concurrent validity, and construct validity were all calculated.
Results: The results supported a two-factor (ie, quantity of intimate peer relationship, the quantity of non-intimate peer relationship) model for PRS-Quantity and a 12-item three-factor (ie, cognitive process, affective process, behavioral process) model for PRS-Quality. The Cronbach’s alpha was 0.870 for PRS-Quantity and 0.851 for PRS-Quality. Both scales showed good test–retest reliability (r = 0.890 for PRS-Quantity, r = 0.889 for PRS-Quality), concurrent validity (r = 0.832 for PRS-Quantity, − 0.800 for PRS-Quality), and acceptable construct validity.
Discussion: Overall, our findings suggested that the PRSs are reliable and valid measurements to evaluate the quantity and quality of peer relationships among Chinese community-dwelling elderly. The scales may serve as attempted tools for researchers and practitioners to access the social health of the elderly and evaluate the effectiveness of related services.
Keywords: peer relationship, scale, psychometric testing, community-dwelling elderly
Introduction
Social networks distinctly affect well-being and life satisfaction across the whole lifespan, especially in later life when risks of social isolation and health challenges increase.1,2 For the elderly, the main relationship types may include partners, next generations, other relatives, friends, colleagues, neighbors, and acquaintances.3 Notably, among these relationships, intensive interaction usually occurs with peers because peers tend to exhibit similarity in terms of attitudes, values, personality, and interests. Moreover, retired people have more time for leisure activities such as gardening, walking, and sport participation.4,5 Further, they share similar schedules, which allow them to interact with each other. Relative to family members, peers may provide distinct companionship and emotional support.6 Sharifian et al7 also asserted that older people are more likely to turn to friends, mainly of a similar age, for companionship.8 Therefore, it seemed that peers play an essential part in older people’s social life.
According to Lerner et al,9 peer relationship refers to “the broad set of direct and indirect experiences that individuals of all ages have with their non-familial age-mates.” Across many studies, it has been noted that peer relationship difficulties are prone to social problems such as peer rejection, peer neglect, loneliness, and social isolation.10,11 The opposite holds as well. For instance, a recent study found that aging Chinese immigrants tended to experience lower emotional loneliness, fewer social participation barriers, and increased life satisfaction after attending peer-based support groups.12 Notably, as an essential part of social relationship, peer relationship is a manifest for social connectedness and may serve as an indicator of social health. Moreover, research evidence also confirms that good social relationships result in better health. The size of the social network, the frequency of contacts, and so on constitute stimuli to enhance the perception of health and improve the quality of life of the elderly.13 Thus, accurately assessing the peer network size and relationship quality between older adults and their peers is significant because a thorough understanding of the peer relationship can help predict the social health status and improve the health outcomes for the elderly through optimizing relationships.
Usually, the peer relationships were not directly measured but investigated within the framework of social network analysis, using the index of structure, quality, and function of friendship, considering that peer relationship and friendship are often used interchangeably. The most frequently asked questions concerning this include the following: “How many friends do you see or hear from at least once a month?”; “How many friends do you feel free with to share private matters?”; and “How many friends do you feel close to that you can call for help?”.14 To this end, most scales directly measuring peer relationships are all aimed at youngsters. One of the earliest and most widely used instruments for measuring peer relationships was a multidimensional 40-item Friendship Quality Questionnaire (FQQ),15 developed by Parker and Asher in 1993. Several peer relations were also assessed using the Peer Relation Questionnaire,16 which measures both three types of dyadic peer relations (ie, mutual understanding, self‐disclosure, and similarity of taste) and the number of friends. In addition to these measures, another common tool for peer relationship assessment is peer nomination. The peer relationship was judged according to whether another member nominated a member.17 Notably, although many tools exist concerning the peer relationships of children and overall social relationships for the elderly, none explicitly intended for the measurement of peer relationships for older adults. Given the unique social roles of older adults (ie, retired, widowed), it may not be appropriate to apply the same measures as those used among younger adults or general relationships among older adults.
Therefore, to address this methodological limitation, this study aimed to develop the Peer Relationship Scales (PRSs) for community-dwelling elderly and examine the psychometric properties of the PRSs in a random sample of Chinese elderly in Chongqing city. The scales may enable researchers, elderly caregivers, and service practitioners to measure the quantity and quality of relationships between older people and their peers more accurately and inform the development of effective interventions to strengthen peer relationships. Further, they may access related outcomes for gerontological social services.
Methods
The study protocol had been reviewed and approved by the ethical committees of Army Medical University, China [Reference No.2020–013-02]. The research was conducted per the Declaration of Helsinki. To develop and test the scales for measuring the quantity and quality of peer relationships among older adults, we applied a multistep approach as described by Boateng et al.18
Phase 1 Item Development
Identification of Domain and Item Generation
The Adams–Blieszner–Ueno integrative conceptual framework has comprehensively depicted that the friendship pattern consists of two parts—the internal structure and interactive processes,19 which could provide a lens for the measure of peer friendship. We referenced qualitative results obtained in our previous in-depth interviews, which identified a pattern and influencing factors that are considered necessary in measuring the peer relationships. Based on this, the authors drafted the items concerning specific aspects of the internal structure of peer relationships (eg, network size and interact frequency), and affective, cognitive, and behavioral facets of the interactive process of peer relationships.19 Additional items were developed using existing questionnaires, including the Berkman–Syme Social Network Index,20 FQQ,15 the Friendship Scale,21 the Interpersonal Support Evaluation List,22 the Neighborhood Cohesion Scale,23 and Guanxi Closeness Scale,24 and from a review of literature on social relationships or friendship.25–28 Through in-depth discussions within the research team, all drafted items were modified to fit with Chinese culture and make it easier for the elderly to understand. Owing to the specificity of response options, the instrument comprises two separate scales—the peer relationship scale for quantity (PRS-Quantity) and the peer relationship scale for quality (PRS-Quality). In PRS-Quantity, for items quantity 1–6, the response option for the number of peers was on a 6-point scale (0 = 0; 1 = 1; 2 = 2–3; 3 = 4–9; 4 = 10–19; and 5 = more than 20). For items quantity 8–12, responses were set as categories 0 = “never,” 1 = “less than once a year,” 2 = “at least once a year,” 3 = “at least once a month,” 4 = “at least once a week,” and 5 = “nearly daily,” respectively. In PRS-Quality, a 5-point Likert response scale (1 = Strongly disagree, 2 = Disagree, 3 = Neutral/Do not know, 4 = Agree, 5 = Strongly agree) was used to sensitively distinguish older peoples’ responses regarding their feelings and perceptions, reduce their cognitive load, and make it easier to respond. In the end, the authors formulated a preliminary draft of 12 items to measure the number of peer relationships and 28 items to measure the cognitive, emotional, and behavioral dimensions of the quality of peer relationships. As the target population was the elderly people in mainland China, all items were developed in Mandarin. For each subsequent validation, separate analyses were conducted for the PRS-Quantity and PRS-Quality.
Experts’ Review of Items
A two-round Delphi survey was conducted by e-mail for this research to screen the items included in the PRSs. A total of 23 experts with expertise in nursing, gerontology, psychology, and sociology were recruited to evaluate the scale’s preliminary item pool. In round one, the survey comprised a brief introduction to the aim of the study, theoretical underpinnings, and development process. Experts were invited to provide personal information (ie, age, professional title, years working, and education level), make suggestions using a free-text format, and rate each of the proposed items. All items were assessed on a scale from 1 (“least important”) to 5 (“most important”). The authors discussed the items with suggested adaptations of the language and with less importance. Further, they were changed or deleted as necessary. In the second round, round 1 experts were presented with the changes made based on feedback from the previous round and were invited to re-rate the items’ importance and provide additional rewording suggestions, comments, or questions. Through this process, items were deleted, rewritten, added, and subsequently assessed for content validity.
Content Validity
A panel of 7 experts was asked to assess each item’s relevance on the PRS using a 4-point Likert scale (1 = not relevant, 2 = somewhat relevant, 3 = relevant, 4 = very relevant) to determine content validity. The item-level content validity index (I-CVI) and the scale-level content validity index (S-CVI) were calculated. The CVI for an item is the proportion of experts who rate it as 3 or 4. Moreover, items with an I-CVI of < 0.78 were deleted.29,30 A scale-level content validity index was calculated as the average across items’ I-CVI (S-CVI/Ave) and the proportion of items that all experts rated as relevant (S-CVI/UA, scale-level content validity index universal agreement). Acceptable thresholds for S-CVI/Ave and S-CVI/UA were above 0.90 and 0.80, respectively.31
Phase 2: Scale Development
Cognitive Interview
A pre-test of 10 older people using cognitive interviewing was performed to ensure that the elderly could understand and respond to the items’ conformity to the original intention.
Survey Administration and Sample Size
We use a convenience sampling strategy to recruit participants in more than six communities in the main urban areas of Chongqing, China. The sample inclusion criteria are as follows: a) ≥ 65 years old; b) have a good cognitive function as measured by MMSE; c) voluntarily participate in the study and sign the informed consent. Initially, the community health service center staff helped put up information posters and conduct verbal announcements to recruit sufficient participants. Subsequently, these local contacts kept in touch with potential participants and organized a place and time for researchers to meet with and explain the study to participants. After providing written and oral informed consent, the study participants were administered a paper-based structured questionnaire. Those who did not have adequate language skills or withdrew mid-way were excluded. During the survey, direct face-to-face questionnaire interviews were conducted in Chinese by uniformly trained and qualified research group members who have considerable experience in this field. Unless the participants insisted on filling out the questionnaires without assistance, the investigators read the questionnaire to them item-by-item and then recorded their responses. Once each participant completed the questionnaire, the investigators immediately checked on-site and asked the participant to complete the questionnaire if there were any omissions. Notably, the sample recruitment was conducted at a particular time (between July 2020 and December 2020) when the threat of coronavirus disease 2019 (COVID-19) was already under good control in Chongqing, China. Therefore, the impact of the epidemic on recruitment was negligible.
The sample size was subsequently determined using the recommended minimum subject/item ratio of > 5:1.32 In this research, PRS-Quality had a maximum of 28 items; therefore, the sample size should have been at least 140. Considering the possibility of incomplete or invalid questionnaires, we expanded the sample size by 20%;33 thus, the sample size should be 168 cases. Owing to the recommendation for separate samples to perform EFA and CFA,34 the minimum sample size was 336. In total, 450 older adults were recruited in this study. According to the even and odd ID numbers, the sample was split into two groups (sample A and sample B) to ensure the samples’ mutual independence for two different factor analyses.35 Figure 1 presents the flowchart for this study.
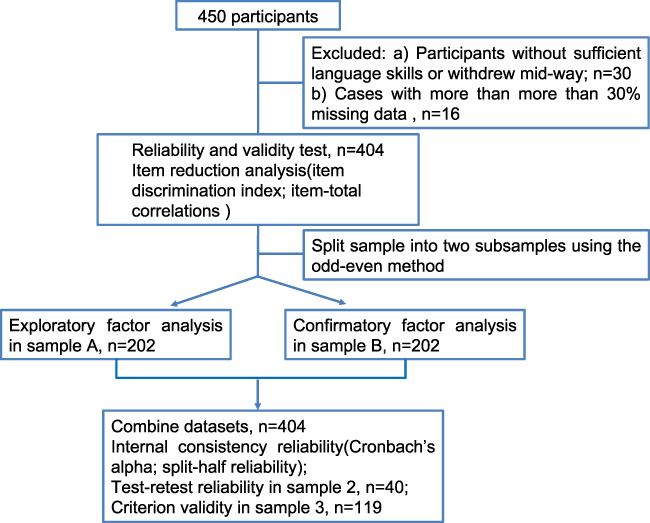 |
Figure 1 Flowchart of the study. |
After collecting the data, all the questionnaire data were sorted, coded, and double-entered into Epidata 3.1 and exported to SPSS 23.0 for analysis. The codes of the negatively worded questions were reversed at first. If the participants answered “Do not know” to any question after multiple careful explanations, it was coded as a missing value to eliminate confounding factors.36 Multiple imputations were then performed to handle missing cases.37 Descriptive statistics were used to describe the sample characteristics.
Item Reduction Analysis
The total scores were ranked from high to low, the first 27% were chosen as the highest scoring group, and the last 27% were selected as the lowest scoring group.38 Independent samples t-tests were used to analyze the empirical data, with the resulting t value being the critical ratio (CR).39 Items with poor discrimination values (p > 0.05) were removed from the item pool.
Item-total correlations aimed at examining the relationship between each item vs the total score of scale items. Items with no significant correlation with the total score of scale items are less desirable and deleted from the scale.
Extraction of Factors
To identify the scales’ factor structure, we subsequently performed an EFA— specifically the principal components extraction method—on sample A (n = 202). Varimax rotation was selected as it facilitates data pattern interpretation. The Kaiser-Meyer-Olkin (KMO) statistic and Bartlett’s test of sphericity were used to determine the appropriateness of running the factor analysis. KMO values vary from 0 to 1, and values > 0.5 are acceptable.40 Bartlett’s test requires to yield a significant result (p < 0.05). Factor loadings ≥ 0.4 were considered satisfactory.41
Phase 3: Scale Evaluation
Tests of Dimensionality
To further validate whether our data fit the theoretical three-factor model, sample B (n = 202) was used for CFA by covariance matrices and the maximum likelihood (ML) estimation method with AMOS 24.0. A model is regarded as acceptable if the relative chi-square value (CMIN/df) is less than 3,42 the goodness-of-fit index (GFI) exceeds 0.90, the comparative fit index (CFI) exceeds 0.90,43 and the root mean square error of approximation (RMSEA) is less than 0.08.44
Convergent and Discriminant Validity
The average variance extracted (AVE) was calculated to evaluate the convergent validity on sample B. If the AVE is larger than 0.50, then the convergent validity is good.42 Discriminant validity is acceptable when the square root of AVE is larger than the correlation coefficients between each two extracted factors.45
Tests of Reliability
After the factor structure was confirmed using CFA, the internal consistency reliability was judged by Cronbach’s alpha coefficient and split-half reliability based on the whole sample (n = 404). Cronbach’s alpha generally > 0.7 was considered acceptable, and that ≥ 0.80 was desirable.46,47 Split-half reliability was assessed as the Spearman-Brown coefficient. Further, 40 participants were randomly selected to complete the peer relationship scales again within two weeks to measure test–retest reliability.
Concurrent Validity
The concurrent validity was measured by correlating the PRS-Quality score with the University of California, Los Angeles (UCLA) Loneliness Scale. Further, the dimension of contacts with friends in the Lubben Social Network Scale (LSNS) was used as another proxy to examine the validity of the two-factor constructed PRS-Quantity. The correlations of all scale scores were calculated using Pearson’s correlation coefficients. P < 0.05 was considered statistically significant.
Results
Phase 1 Item Development
During the item selection stage, we conducted two rounds of the Delphi survey to elicit expert opinions regarding the specific items included in the PRS. The response rate was 100% in round 1 (23/23) and 86.96% in round 2 (20/23). Among the 23 experts, 100% of them held a bachelor’s degree or a higher qualification, and 78.26% had at least ten years of experience in their respective professional fields.
In the first round, 26 items received an agreement of over 75% experts regarding wording and relevance, and five items showed a lower agreement. After considering the experts’ suggestions, nearly all items were revised for wording, and nine items were added. In the second round of rating, item quality 7 (I have known most of my peers for more than three years) and item quality 8 (There are peers who really understand my views or feelings) were dropped out because of overlap content with other items. Thus, a total of 40 items were selected to form the two scales of peer relationship: 12 items for measuring the internal structure of peer relationship (mainly peer network size and contact frequency), and 28 items in evaluating the quality of peer relationship (mainly cognitive, affective, and behavioral process). The revised draft scales after two rounds of the Delphi survey were shown in Additional file 1.
According to the following expert consultation, for the PRS-Quality, the I-CVI was between 0.857 and 1.000, the S-CVI/ave was 0.980, and S-CVI/UA was 0.857. For the PRS-Quantity, the I-CVI was between 0.857 and 1.000. S-CVI/ave and S-CVI/UA were 0.976 and 0.833, respectively. The results suggested that most experts regarded items as relevant or very relevant to the peer relationship.
Phase 2: Scale Development
Cognitive Interview
Subsequently, cognitive interviews were conducted with ten older adults. Nearly all participants indicated that the wording and format of the items were understandable. However, two participants were confused about choosing the number of peers as they had many peer friends in the past while having no intimate peers now. Therefore, to avoid confusion and ensure that the items reflected an individual’s current state regarding peer relationship, the duration was added with the phrase “In the past three months … ” in the front instructions of the questionnaire.
Characteristics of the Participants
In total, 420 questionnaires were received from participants for a response rate of 93.33% (420 out of 450). Sixteen of the questionnaires with more than 30% missing data were excluded. Thus, only 404 questionnaires were valid and used for analysis. Study participants were aged 65–98 years, and the mean age was 75.11 years (SD = 7.41). Other demographic information of participants is shown in Table 1. Furthermore, it can be inferred that the answers “Do not know” had little impact on the overall results—only 1.67% (n = 7) of participants answered “Do not know” for any question with 5-point Likert options after the items and options were carefully explained to them.
 |
Table 1 Demographic Characteristics of the Study Participants |
Item Reduction Analysis
First, the “high-low-27-percent group method” in the item analysis assessed the items’ discriminant index. This step helped to examine whether the differences in the items between the two groups were significant. For item quality 6: “I feel some of my peers take advantage of me” and item quality 25: “I argued or quarreled with my peers”, the independent samples t-tests showed that there was no significant difference between the highest scoring and lowest scoring groups (CR = 1.454, 0.728; p = 0.147 > 0.05, 0.467 > 0.05, respectively). Based on the item-total correlation analysis, both items quality 6 and 25 have no statistically significant correlations with the total score (r = 0.045, 0.040; p = 0.365 > 0.05, 0.419 > 0.05, respectively). The correlation coefficients between the total score and other items ranged from 0.142 to 0.825 (p < 0.01). Therefore, combined with the above results, items quality 6 and 25 were omitted. The remaining 26 items for PRS-Quality and 12 items for PRS-Quantity were moved to the following analysis.
Extraction of Factors
For both item sets, the requirements for exploratory factor analysis in sample A were fulfilled (PRS-Quantity: KMO = 0.862, Bartlett’s test of sphericity χ2 = 1378.583, p < 0.001; for the PRS-Quality, KMO = 0.909, χ2 = 2817.949, p < 0.001). EFA was then performed on both scales. The items with initial eigenvalues above 1 would be systematically assigned to a certain factor. The criteria for removing the items were as follows: factor loading < 0.40, cross-loading < 0.20, less than three items in a factor dimension.48,49 First, for PRS-Quality, items quality 17, 28, and 29 were sequentially deleted because there were less than three items in a factor dimension. Second, the items cross-loaded on the two or more factors, which were approximately balanced, would be eliminated. Consequently, items quality 4, 12, 15, 11, 14, 10, 1, 27, and 30 were deleted step by step. Finally, the remaining 14 items were allocated to three factors, and items quality 5 and 9 were removed. From the professional perspective, they could not explain the practical meaning of the dimension to which they belonged.
Similarly, for PRS-Quantity, item quantity 8 was eliminated after the first EFA because it cross-loaded on the two factors with cross-loading < 0.20. Further, in the following EFA, item quantity 11 was removed because it did not fit the professional meaning of the factor to which it belonged. After this process, PRS-Quantity contained two factors. Factor 1 contained six items, featured an eigenvalue of 4.947, and explained 39.952% of the variance. This factor reflected the network size and contact frequency with intimate peers. Factor 2 contained four items, featured an eigenvalue of 1.575, and explained 25.272% of the variance. It indicated network size and contact frequency with non-intimate peers. The cumulative sum of variance explained by the two factors was 65.224% (Table 2). PRS-Quality contained three factors. Factor 1 contained three items and was consistent with the cognitive process envisaged according to its theoretical framework. Factor 2 (three items) was associated with the affective process of the scale’s theoretical framework and explained 15.881% of the variance. Factor 3 contained six items related to the behavioral dimension that is envisaged according to the scale’s theoretical framework. The cumulative sum of variance explained by the three factors was 66.781% (Table 3).
 |
Table 2 Results of Two-Factor Exploratory Factor Analyses for PRS-Quantity |
 |
Table 3 Results of Three-Factor Exploratory Factor Analyses for PRS-Quality |
Confirmation of Dimensionality
The structure of our theoretical model was largely confirmed by CFA using the data of sample B. Specifically, the ML estimation method with bootstrapping was utilized to estimate the models, as the observed data significantly violated the assumptions of multivariate normality (multivariate kurtosis = 34.605 for PRS-Quantity and 56.707 for PRS-Quality). For PRS-Quantity, the latent variables were the quantity of intimate and non-intimate peer relationships. The goodness-of-fit results were as follows: χ2/df = 2.000; CFI = 0.978; NFI = 0.957; TLI = 0.965; RMSEA = 0.071 (Figure 2, Table 4). The affective, behavioral, and cognitive processes were latent variables for PRS-Quality. Each item in the three factors was an observed variable. The goodness-of-fit results were as follows: χ2/df = 1.921; CFI = 0.959; NFI= 0.919; TLI = 0.947; RMSEA = 0.068 (Figure 3, Table 4). The results of Bollen-Stine bootstrapping also accepted these model fits (rejected null hypothesis with p = 0.060 for PRS-Quantity, 0.055 for PRS-Quality).
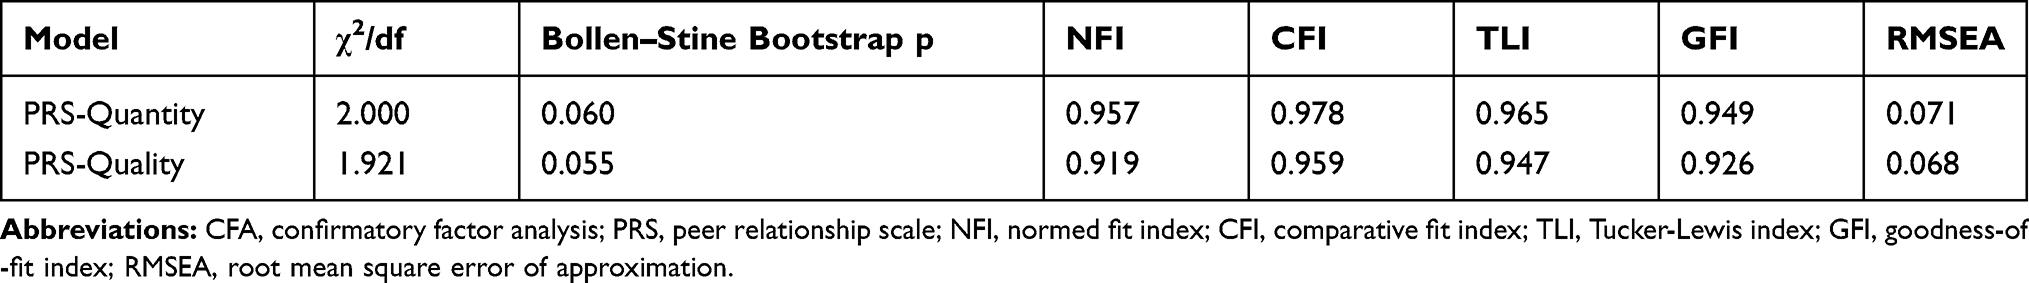 |
Table 4 Goodness-of-Fit Indexes of the Models Tested in the CFA |
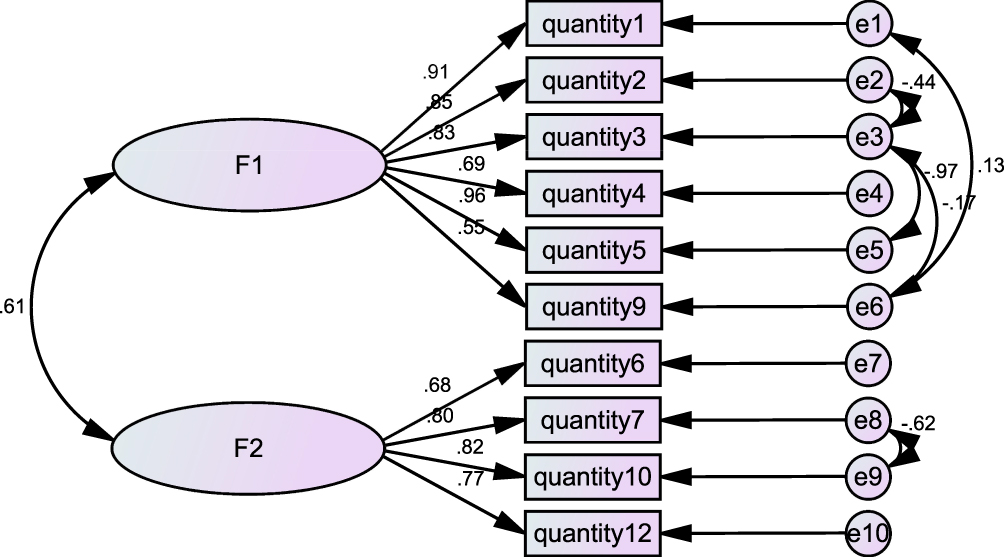 |
Figure 2 The standardized path diagrams of the confirmatory factor model for PRS-Quantity. Note: Quantity 1 to quantity 2 represents the items of PRS-Quantity, F1 to F2 represents the four factors of PRS-Quantity. |
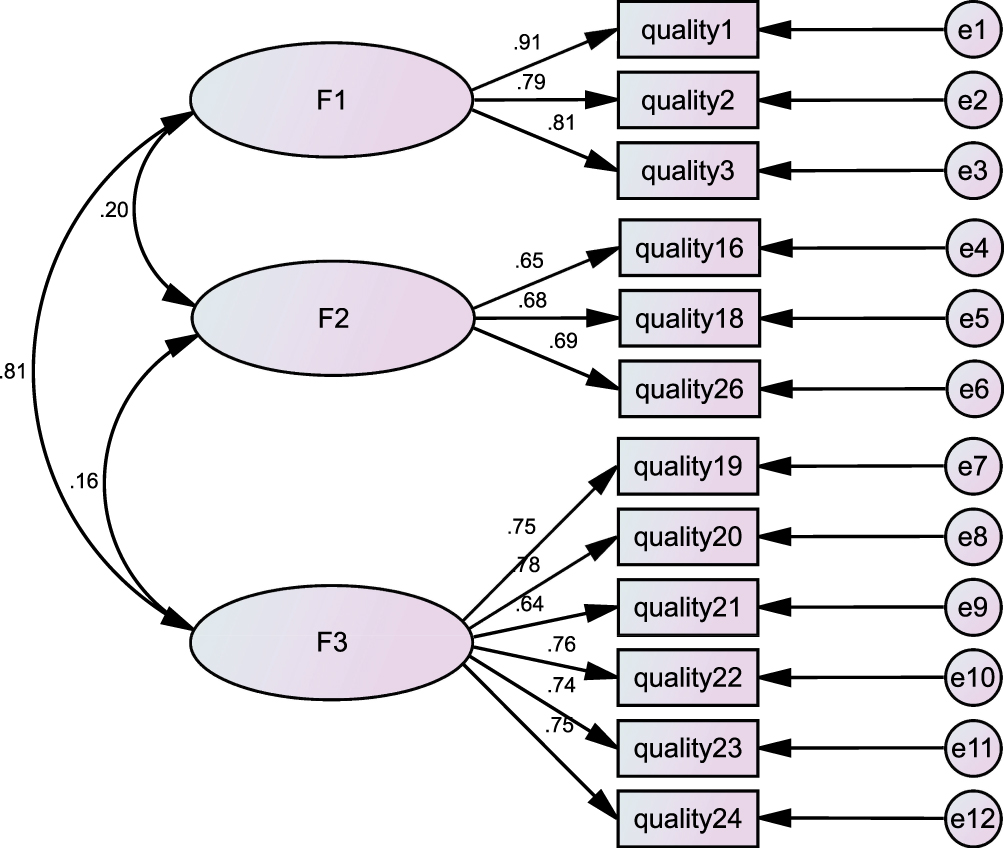 |
Figure 3 The standardized path diagrams of the confirmatory factor model for PRS-Quality. Note: Quality 1 to quality 24 represents the items of PRS-Quality, F1 to F3 represents the four factors of PRS-Quality. |
Convergent and Discriminant Validity
Construct validity was measured by convergent and discriminant validity. In this study, the AVE ranged from 0.459 to 0.703 (Table 5) and was greater than the recommended level of 0.5. This indicated an acceptable convergent validity. Furthermore, square roots of the AVEs of the latent variables for both scales were all greater than the correlation coefficients between the latent variables, indicating good discriminant validity.
 |
Table 5 Reliability and Validity of the PRS |
Test for Reliability
Characteristics of the internal consistency reliability are shown in Table 5. For PRS-Quantity, the overall and subscale Cronbach’s α and split-half reliability ranged from 0.754 to 0.895. Concerning the PRS-Quality, the standardized Cronbach’s α coefficient of the scale was 0.851, and those of dimensions were 0.815 (F1), 0.707 (F2), and 0.891 (F3). These results demonstrated that the scales had a satisfactory internal consistency and split-half reliability (Hair et al, 2010). According to the test–retest (n = 40) performed two weeks apart, the Pearson correlation coefficient of each scale and dimension were all above 0.741, which indicated good consistency of the test results over time.
Test for Concurrent Validity
Of the 404 valid respondents, data from 119 (sample 3) participants who also finished LSNS and UCLA Loneliness Scale were used in the concurrent validity analysis. As shown in Table 5, the overall PRS-Quantity and its two dimensions show moderate or high association with the total score of contacts with friends in the LSNS (r = 0.467–0.832, p < 0.01). Further, as expected, there was a negative and significant correlation (r = −0.271 – −0.800, p < 0.01) between the total score of the UCLA Loneliness Scale and all the PRS-Quality domains. These results demonstrate that both PRS-Quantity and PRS-Quality measured relatively distinct quantity and quality of peer relationship for older adults and could predict social network size for friends and social isolation.
Discussion
This study developed the theoretically-driven instruments, the PRSs, based on the Adams–Blieszner–Ueno integrative conceptual framework for friendship and conducted psychometric tests. The 31-item pool was generated initially using a literature review, group discussion, and in-depth interview, and the collection subsequently changed to 40 items after two rounds of Delphi surveys.
Two scales were developed measuring the peer relationship concerning the PRS-Quantity Scale and PRS-Quality Scale. Both scales are multifaceted. The PRS-Quantity Scale reflects the quantity of intimate and non-intimate peer relationships. The PRS-Quality Scale consists of three factors: cognitive, affective, and behavioral processes. EFA suggested satisfactory factor loadings for the sample of Chinese older adults, and the subsequent CFA confirmed this model with an independent sample. Convergent and discriminant validity indicated good construct validity of both scales. Meanwhile, the psychometric test found that the internal consistency is favorable as measured by alpha reliability coefficient (0.870 for PRS-Quantity Scale and 0.851 for PRS-Quality Scale) and split-half coefficient (0.754 for PRS-Quantity Scale and 0.828 for PRS-Quality Scale). The results also show good temporal stability and content validity for both scales.
PRS-Quantity Scale
PRS-Quantity Scale showed the quantity of intimate and non-intimate peers and contact frequency with them for community-dwelling elderly. The two dimensions we originally envisioned were the size of the peer social network and the frequency of peer interaction. However, the EFA and CFA results support the idea that it is more suitable to divide the scale on another two-factor model in measuring the quantity and contact frequency according to whether the peer relationships are close. Unlike previous scales, which only focused on close relationships such as the family and friends of the elderly, our scale evaluates and distinguishes the quantity and contact frequency of relationships within both close peers and peers that are not so intimate. As previously documented, contact frequency is one unique social resource stemming from social relations and can be viewed as distinct from other social resources (ie, social support, social strain, etc.). This resource can further be broken down by examining the source of this social contact.2 Our results are also consistent with the literature, which argue that relationships of proximity (neighbors), those of service (business personnel, including cab drivers, sales clerks, and wait staff), and those of chance (strangers) may enhance well-being and shape the everyday social world of older adults aging in place.50 These findings also echoes the concern of Wenger et al, who reported that both intimate friends and not so close-knit neighbors are shown to provide necessary support and assistance, which contribute to continuing well-being and independence in old age.51
Item quantity 7: “How many peers do you usually play with you or participate in activities (square dancing, chess, shopping, volunteer activities, senior colleges, etc.)” was loaded with the quantity of non-intimate peer relationship factor. One explanation could be that due to geographical restrictions or mobility difficulties, those who usually play with the elderly are the nearby peers like neighbors and other acquaintances with relationships of proximity, not those intimates who live far away. As described by a recent 5-year ethnographic fieldwork, elders engaged in regular gossip about other older people they encountered in their frequented establishments.52 Meanwhile, items quantity 3: “How many friends do you feel free with to share private matters?” and 4: “If you were to list the names of peers available to help and support you, how many people would you list?” were loaded with the quantity of intimate peer relationship factor. This is understandable because intimate peers are more likely to exchange instrumental support and share private matters.53
PRS-Quality Scale
The quality of social relationships experienced is possibly more important than the quantity of social interaction for older people.26 Studies have indicated that the use of a self-reported number of friendships is a limited proxy, and the examination of quality and reciprocity of friendships is advocated.54 The PRS-Quality Scale in our study exactly fulfilled this expectation. Myers proposed that the structure of human attitude comprised affection, behavior, and cognition, which composed the ABC theory.55 The three factors identified in PRS-Quality were cognitive, affective, and behavioral processes—this was consistent with previous studies and theories.19 The cognitive process explained 17.992% of the total variance. However, as the relationship pattern has three components (ie, cognition, emotion, and behavior) that are only moderately correlated,56 knowing about the effect on cognition does not necessarily reveal much about the effects on emotion and behavior concerning relationship quality. Therefore, the second pronounced factor reflecting the quality of peer relationships was the “affective process,” which denotes an individual’s emotional reactions to peers. The items aimed at measuring the positive emotion domain were included in the original item pool, such as “I feel happy with my peers.” However, they were not retained in the final construct because these items had a cross-loading less than 0.2 on more than two factors according to EFA results. This could be related to the fact that emotional well-being improves with age.57,58 Thus, the positive emotional experience may not be sensitive enough to measure the affective process of peer relationships among the elderly. The typical third dimension reflecting the quality of late-life peer relationships is behavioral processes. Based on Dennis’ suggestion that social support is embedded in the peer relationship construct,59 the behavioral dimension in the PRS-Quality Scale appeared in one or more of the following components in their conceptualizations of support—emotional, instrumental, and informational support60 —as shown from items quality 19 to 24. These items have something in common with that of the Multidimensional Scale of Perceived Social Support61 in measuring perceived friend support. However, there were distinct differences as we also included an item about the reciprocity of support between peers (Item quality 24: I would help my peers if they need help), which also differs from other previous instruments for friendship.21,62 We believe that all these specific supportive behaviors are essential embodiments of the quality of peer relationships.
Although the 12 items explained 66.781% of the total variance, and the scale showed acceptable structural validity, there were still 33.219% of variance that the model could not explain. As we collected data in several communities and given that there were large differences in older adults’ ability to understand, this may have caused additional variance. Moreover, our items may share some aspects (such as wording) that the model does not consider.
Apart from enriching our understanding of peer relationships and benefiting researchers conducting further investigations in this field, the PRS may enable comprehension of related social connectedness and social health of older adults. Meanwhile, the inquiry was designed to be particularly brief and easily understood. It usually took 10 to 15 minutes to complete both scales in most elderly.
Limitation
Although this study offered the first step in developing peer relationship scales among Chinese elders and indicated their good reliability and validity, it still had several limitations. First, the sample of this study was limited and mainly from central urban areas of Chongqing city. The results may not be generalized to the national level. Further, notably, this study is conducted in the context of China, where the values and social relationships are deeply shaped by Confucian culture. It is not clear whether the measure of peer relationship is invariant across different cultures. Therefore, additional large-scale studies in other countries are necessary to confirm whether this result is globally applicable. Finally, although COVID-19 epidemic has little impact on data collection because, during the period of the survey, the threat of COVID-19 was already under good control in China, further research is still needed to explore other potential impacts of the epidemic.
Conclusions
Altogether, new measurement tools for accessing the quantity and quality of peer relationships among the elderly were developed and validated in Chinese samples. To our knowledge, these are the first instruments of peer relationships aimed at community-dwelling elderly, addressing both quantity and quality evaluation. The two PRSs were reliable and valid for the current samples. PRS-Quantity consists of two factors: quantities of intimate and non-intimate peers. PRS-Quality is a three-factor structure: cognitive, affective, and behavioral processes. The 10-item PRS-Quantity and 12-item PRS-Quality also have appropriate lengths to administer and are easily understood for the elderly regardless of their education level. The two scales can be used jointly or separately depending on the research focus. Overall, we believe that the PRSs are reliable and valid measures in examining the quantity and quality of peer relationships among community-dwelling elderly, predicting individuals’ social health status, and accessing the effectiveness of interventions aimed at social isolation reduction in various ways. Future studies of the PRSs with larger sample sizes in other locales are needed to demonstrate the scales’ generalizability.
Ethical Statement
The study protocol had been reviewed and approved by the ethical committees of Army Medical University, China [Reference No.2020-013-02]. The research was conducted per the Declaration of Helsinki.
Funding
The authors disclosed receipt of the following financial support for the research, authorship, and publication of this article: This work was supported by The National Social Sciences Funds of China [grant number 19XRK001].
Disclosure
The authors declare that there is no conflict of interest.
References
1. Merz E-M, Huxhold O. Wellbeing depends on social relationship characteristics: comparing different types and providers of support to older adults. Ageing Soc. 2010;30(5):843–857.
2. Sharifian N, Sol K, Zahodne LB, Antonucci TC. Social Relationships and Adaptation in Later Life. Reference Module Neurosci Biobehav Psychol. 2022;B978-0-12-818697-8.00016-9.
3. Valdez RS, Guterbock TM, Fitzgibbon K, et al. From loquacious to reticent: understanding patient health information communication to guide consumer health IT design. J Am Med Inform Assoc. 2017;24(4):680–696.
4. Godfrey A, Lord S, Galna B, Mathers JC, Burn DJ, Rochester L. The association between retirement and age on physical activity in older adults. Age Ageing. 2014;43(3):386–393.
5. Cox A, Rhodes R. Increasing physical activity in empty nest and retired populations online: a randomized feasibility trial protocol. Int J Environ Res Public Health. 2020;17(10):3544.
6. La Greca AM. Peer influences in pediatric chronic illness: an update. J Pediatr Psychol. 1992;17(6):775–784.
7. Sharifian N, Kraal AZ, Zaheed AB, Sol K, Zahodne LB. Longitudinal associations between contact frequency with friends and with family, activity engagement and cognitive functioning. J Int Neuropsychol Soc. 2020;26(8):815.
8. Crohan SE, Antonucci TC. Friends as a Source of Social Support in Old Age. 1989.
9. Lerner RM, Bornstein MH, Leventhal T. Ecological settings and processes. In: Lerner RM. editor. Handbook of Child Psychology and Developmental Science. Vol. 4,
10. Kim JW, Kim B-N, Kim JI, et al. Social network analysis reveals the negative effects of Attention-Deficit/Hyperactivity Disorder (ADHD) symptoms on friend-based student networks. PLoS One. 2015;10(11):e0142782.
11. Juvonen J, Lessard LM, Schacter HL, Suchilt L. Emotional implications of weight stigma across middle school: the role of weight-based peer discrimination. J Clin Child Adolesc Psychol. 2016;46(1):150–158.
12. Lai DW, Li J, Ou X, Li CY. Effectiveness of a peer-based intervention on loneliness and social isolation of older Chinese immigrants in Canada: a randomized controlled trial. BMC Geriatr. 2020;20(1):1–12.
13. Rondón García LM, Aguirre Arizala BA, García García FJ. The importance of social relationships as a mechanism to improve the health and quality of life of the elderly, from an interdisciplinary perspective. Rev Esp Geriatr Gerontol. 2018;53(5):268–273.
14. Chang Q, Sha F, Chan CH, Yip PSF. Validation of an abbreviated version of the Lubben Social Network Scale (“LSNS-6”) and its associations with suicidality among older adults in China. PLoS One. 2018;13(8):e0201612.
15. Parker JG, Asher SR. Friendship and friendship quality in middle childhood: links with peer group acceptance and feelings of loneliness and social dissatisfaction. Dev Psychol. 1993;29(4):611.
16. Yamasaki K, Nishida N. The relationship between three types of aggression and peer relations in elementary school children. Int J Psychol. 2009;44(3):179–186.
17. Lubbers MJ, Snijders TA. A comparison of various approaches to the exponential random graph model: a reanalysis of 102 student networks in school classes. Soc Networks. 2007;29(4):489–507.
18. Boateng GO, Neilands TB, Frongillo EA, Melgar-Quiñonez HR, Young S. Best practices for developing and validating scales for health, social, and behavioral research: a primer. Front Public Health. 2018;6:149.
19. Ueno K, Adams RG. Adult friendship: a decade review. In: Noller P, Feeney JA, editors. Close Relationships: Functions, Forms and Processes.
20. Berkman LF, Syme SL. Social networks, host resistance, and mortality: a nine-year follow-up study of Alameda County residents. Am J Epidemiol. 1979;109(2):186–204.
21. Hawthorne G. Measuring social isolation in older adults: development and initial validation of the friendship scale. Soc Indic Res. 2006;77(3):521–548.
22. Cohen S, Hoberman H. Interpersonal support evaluation list (ISEL). J Appl Soc Psychol. 1983;13(1):99–125.
23. Buckner JC. The development of an instrument to measure neighborhood cohesion. Am J Community Psychol. 1988;16(6):771–791.
24. Chen XP, Peng S. Guanxi dynamics: shifts in the closeness of ties between Chinese coworkers. Manage Organ Rev. 2008;4(1):63–80.
25. Lopes PN, Salovey P, Côté S, Beers M, Petty RE. Emotion regulation abilities and the quality of social interaction. Emotion. 2005;5(1):113.
26. Hsu H-C, Chang W-C. Social connections and happiness among the elder population of Taiwan. Aging Ment Health. 2015;19(12):1131–1137.
27. Shaw BA, Krause N, Liang J, Bennett J. Tracking changes in social relations throughout late life. J Gerontol B Psychol Sci Soc Sci. 2007;62(2):S90–S99.
28. Blieszner R, Ogletree AM, Adams RG. Friendship in later life: a research agenda. Innov Aging. 2019;3(1):igz005.
29. Cheong AT, Chinna K, Khoo EM, Liew SM. Determinants for cardiovascular disease health check questionnaire: a validation study. PLoS One. 2017;12(11):e0188259.
30. Polit DF, Beck CT. The content validity index: are you sure you know what’s being reported? Critique and recommendations. Res Nurs Health. 2006;29(5):489–497.
31. Polit DF, Beck CT, Owen SV. Is the CVI an acceptable indicator of content validity? Appraisal and recommendations. Res Nurs Health. 2007;30(4):459–467.
32. Worthington RL, Whittaker TA. Scale development research: a content analysis and recommendations for best practices. Couns Psychol. 2006;34(6):806–838.
33. Li Y, Zhang S, Zhang T, et al. Chinese health literacy scale for tuberculosis patients: a study on development and psychometric testing. BMC Infect Dis. 2019;19(1):1–14.
34. Gaskin CJ, Happell B. On exploratory factor analysis: a review of recent evidence, an assessment of current practice, and recommendations for future use. Int J Nurs Stud. 2014;51(3):511–521.
35. Bai X. Development and validation of a multidimensional intergenerational relationship quality scale for aging Chinese parents. Gerontologist. 2018;58(6):e338–e348.
36. Kulas JT, Stachowski AA, Haynes BA. Middle response functioning in Likert-responses to personality items. J Bus Psychol. 2008;22(3):251–259.
37. Gottschall AC, West SG, Enders CK. A comparison of item-level and scale-level multiple imputation for questionnaire batteries. Multivariate Behav Res. 2012;47(1):1–25.
38. Lyu X, Liu Y, Yu H, et al. Development and validation of a risk perception scale of medical help-seeking behavior in Chinese adults. Ann Transl Med. 2020;8(21):1352.
39. Wu X, Gao J, Li Y, Wu C. Development of a safety climate scale for geological prospecting projects in China. Int J Environ Res Public Health. 2019;16(6):1082.
40. Siriwardhana DD, Walters K, Rait G, Bazo-Alvarez JC, Weerasinghe MC. Cross-cultural adaptation and psychometric evaluation of the Sinhala version of Lawton Instrumental Activities of Daily Living Scale. PLoS One. 2018;13(6):e0199820.
41. Mitzenmacher M, Upfal E. Probability and Computing: Randomization and Probabilistic Techniques in Algorithms and Data Analysis.
42. Hair J, Anderson R, Babin B, Black W. Multivariate Data Analysis: A Global Perspective.
43. Meyers LS, Gamst G, Guarino AJ. Applied Multivariate Research: Design and Interpretation.
44. MacCallum RC, Austin JT. Applications of structural equation modeling in psychological research. Annu Rev Psychol. 2000;51(1):201–226.
45. Fornell C, Larcker DF. Evaluating structural equation models with unobservable variables and measurement error. J Mark Res. 1981;18(1):39–50.
46. Tavakol M, Dennick R. Making sense of Cronbach’s alpha. Int J Med Educ. 2011;2:53.
47. Taber KS. The use of Cronbach’s alpha when developing and reporting research instruments in science education. Res Sci Educ. 2018;48(6):1273–1296.
48. Hulsbosch LP, Nyklíček I, Potharst ES, Boekhorst MG, Pop VJJBP. Development of the Labor Pain Relief Attitude Questionnaire for pregnant women (LPRAQ-p). BMC Pregnancy Childbirth. 2020;20(1):1–12.
49. Marsh HW, Hau K-T, Balla JR, Grayson D. Is more ever too much? The number of indicators per factor in confirmatory factor analysis. Multivariate Behav Res. 1998;33(2):181–220.
50. Gardner PJ. Natural neighborhood networks—Important social networks in the lives of older adults aging in place. J Aging Stud. 2011;25(3):263–271.
51. Wenger GC. The special role of friends and neighbors. J Aging Stud. 1990;4(2):149–169.
52. Torres S. Aging Alone, Gossiping Together: older Adults’ Talk as Social Glue. J Gerontol B Psychol Sci Soc Sci. 2018;74(8):1474–1482.
53. Solikhah S, Matahari R, Utami FP, Handayani L, Marwati TA. Breast cancer stigma among Indonesian women: a case study of breast cancer patients. BMC Womens Health. 2020;20:1–5.
54. Zukerman JM, Devine KA, Holmbeck GN. Adolescent predictors of emerging adulthood milestones in youth with spina bifida. J Pediatr Psychol. 2011;36(3):265–276.
55. Myers DG. Behavior and attitudes. Soc Psychol. 1993.
56. Silvestre A, Huart J, Dardenne B. Implicit belittlements call for implicit measures: emotional reactions to youth paternalistic stereotypes. Psychol Belg. 2017;57(2):133.
57. Burr DA, Castrellon JJ, Zald DH, Samanez-Larkin GR. Emotion dynamics across adulthood in everyday life: older adults are more emotionally stable and better at regulating desires. Emotion. 2021;21(3):453–464.
58. Carstensen LL, Shavit YZ, Barnes JT. Age Advantages in Emotional Experience Persist Even Under Threat From the COVID-19 Pandemic. Psychol Sci. 2020;31(11):1374–1385.
59. Dennis CL. Peer support within a health care context: a concept analysis. Int J Nurs Stud. 2003;40(3):321–332.
60. Ranerup A, Sparud-Lundin C, Koinberg I, Skärsäter I, Jenholt-Nolbris M, Berg M. Role of theories in the design of web-based person-centered support: a critical analysis. Int J Chronic Dis. 2014;2014:603047.
61. Zimet GD, Dahlem NW, Zimet SG, Farley GK. The multidimensional scale of perceived social support. J Pers Assess. 1988;52(1):30–41.
62. Verswijvel K, Heirman W, Hardies K, Walrave M. Designing and validating the friendship quality on social network sites questionnaire. Comput Human Behav. 2018;86:289–298.
 © 2021 The Author(s). This work is published and licensed by Dove Medical Press Limited. The
full terms of this license are available at https://www.dovepress.com/terms
and incorporate the Creative Commons Attribution
- Non Commercial (unported, 3.0) License.
By accessing the work you hereby accept the Terms. Non-commercial uses of the work are permitted
without any further permission from Dove Medical Press Limited, provided the work is properly
attributed. For permission for commercial use of this work, please see paragraphs 4.2 and 5 of our Terms.
© 2021 The Author(s). This work is published and licensed by Dove Medical Press Limited. The
full terms of this license are available at https://www.dovepress.com/terms
and incorporate the Creative Commons Attribution
- Non Commercial (unported, 3.0) License.
By accessing the work you hereby accept the Terms. Non-commercial uses of the work are permitted
without any further permission from Dove Medical Press Limited, provided the work is properly
attributed. For permission for commercial use of this work, please see paragraphs 4.2 and 5 of our Terms.