Back to Journals » International Journal of General Medicine » Volume 14
Development and Validation of Nomogram for Predicting Delayed Graft Function After Kidney Transplantation of Deceased Donor
Received 3 August 2021
Accepted for publication 12 November 2021
Published 30 November 2021 Volume 2021:14 Pages 9103—9115
DOI https://doi.org/10.2147/IJGM.S331854
Checked for plagiarism Yes
Review by Single anonymous peer review
Peer reviewer comments 3
Editor who approved publication: Dr Scott Fraser
Jiashan Pan, Guiyi Liao
Department of Urology, The First Affiliated Hospital of Anhui Medical University and Institute of Urology and Anhui Province Key Laboratory of Genitourinary Diseases, Anhui Medical University, Hefei, Anhui, 230022, People’s Republic of China
Correspondence: Guiyi Liao
Department of Urology, The First Affiliated Hospital of Anhui Medical University and Institute of Urology and Anhui Province Key Laboratory of Genitourinary Diseases, Anhui Medical University, Hefei, Anhui, 230022, People’s Republic of China
Email [email protected]
Background: Delayed graft function (DGF) is a major complication of kidney transplantation (KT), especially in patients receiving donor of decease (DD) KT. Therefore, the kidney donor pool is rare worldwide, it is critical to evaluate the risk coefficient of DGF using preoperative data of donors and recipients and provide a reference for clinical decision-making and resource allocation.
Method and Analysis: A total of 238 DD recipients were performed in our center. Finally, 211 patients were included. The clinical database was divided into 34 clinical blood indicators (CBIs) and 6 demographics indexes (DIs). CBIs and DIs were screened for variables with P< 0.05 and demonstrated the best cut-off value using multivariable logistics regression. The selected CBIs were passed through the least absolute shrinkage and selection operator (LASSO) to obtain the predictive factors and synthesized into a Riskscore, forming a nomogram with the selected DIs. We used receiver operating characteristic (ROC), calibration, and decision curve analysis (DCA) to verify the discrimination and clinical effects of this nomogram. Finally, 10-fold cross-validation was conducted internally to show the effect of the model.
Results: The 34 CBIs of the database finally screened out 12 predictors, which were synthesized into Riskscore. The 6 DIs selected 3 variables. Riskscore and 3 DIswere constructed into a nomogram, and the ROC of the nomogram has an AUC value of 0.725. Calibration and DCA showed excellent verification effects on the nomogram. The 10-fold crossover internal validation also demonstrated the model’s excellent discrepancy.
Conclusion: The nomogram has an excellent ability to predict DGF and provides an essential reference for decision-making and resource allocation in a clinical setting.
Keywords: kidney transplantation, donor of decease, delayed graft function, clinical blood indicators, demographics indexes, nomogram
Introduction
End-stage renal disease (ESRD) is the terminal stage of irreversible decline in renal function caused by various kidney diseases. Patients can only rely on alternative treatments (including kidney transplantation, hemodialysis, and peritoneal dialysis) to maintain a normal life.1 With the rapid development of organ transplantation in China, an increasing number of patients ESRD patients are undergoing kidney transplantation (KT). However, this has also increased surgeon concerns about the quality and function of a transplanted kidney. It is worth noting that delayed graft function (DGF) manifests acute kidney injury in transplanted kidneys and a unique attribute of transplanted organs. DGF can cause oliguria and anuria in the early postoperative period, resulting in increased allograft immunogenicity, increased risk of acute rejection, and reduced long-term survival.2 The kidney donor pool is still extremely rare worldwide. Avoiding DGF has become a hot topic in the allograft field.
Donor renal comes from a donor of decease (DD) (including donation after cardiac death and donation after brain death) or Living Donation (LD). Studies have shown that the incidence of DGF in DD is much higher than in LD, ranging from 20% to 50%,3 and in LD from 4% to 10%.4 Therefore, evaluating the risk factors of DGF from DD is an important research topic. However, many risk factors are leading to the occurrence of DGF in the recipient. Among the currently recognized pathological and epidemiological factors, the donor, transport and recipient are involved in the occurrence of DGF. On the donor side, crucial independent risk factors, including ischemia injury (including warm ischemia time (WIT),5 cold ischemia time (CIT),6 and inflammatory signaling are involved. In terms of receptors, recipient age (R-age), refusion injury, body mass index (R-BMI), the innate immune response and the adaptive immune response are all involved.7 Besides, the CBIs between the donor and the recipient, such as blood routine, liver function, renal function, anticoagulant and other indicators are also related to DGF. However, no study has reported detailed research and analysis on this aspect. Therefore, guiding preoperative clinical dataset of donors and recipients by DGF, comprehensively analyzed and quantified, and presented in a concise and clear form will significantly increase the value of the database, and assist surgeons in organ allocation and clinical decision-making. In this study, we aim to make a nomogram for predicting postoperative DGF based on the preoperative demographics indexes (DIs) and the clinical blood indicators (CBIs) (including donor and recipient) of DD. Our purpose is to help clinicians induce defense and treatment according to the patient’s DGF risk level.
Materials and Methods
Study Population and the Definition of DGF
We collected data of recipients and their donors who received DD for the first time from January 1, 2017 to December 31, 2019 in the Urology Kidney Transplant Ward of the First Affiliated Hospital of Anhui Medical University. A database of 382 cases composed of a data set of 150 donors and a data set of 238 recipients (because the blood marks and general epidemiological index of the donor are tested, the data of the twain kidneys donated by some donors are duplicated). The current study was approved by the Ethics Committee of the First Affiliated Hospital of Anhui Medical University. Ultimately, 211 cases had complete data from the recipients (added 133 cases of the matched donors). The database was collected from China Organ Transplantation Response System 2.0 and the patient inpatient system of this hospital.
There are many definitions of DGF, but the widely accepted is that the recipient still needs 1 dialysis within one week after KT.4
Data Collection and Requirements
The selected DIs include R-age, R-BMI, donor age (D-age), body mass index (D-BMI), WIT, and CIT. CBIs include receptor serum creatinine (R-creatinine), uric acid (R-UA), R-urea, R-ALT, R-AST, total bilirubin (R-TB), R-total protein, R-albumin, R-globulin, blood glucose (R-GLU), R-K+, R-Na+, R-HCO3−,R-Cl−; WBC count (R-WBC), neutrophil count (R-NEUT), neutrophil percent (R-NEUT-P), lymphocyte count (R-LYMP), monocytes count (R-MONO), eosinophils count (R-EO), red blood cell count (R-RBC), hemoglobin count (R-Hb), platelet count (R-PLT); prothrombin time (R-PT), activated partial prothrombin time (R-APTT), coagulation time (R-TT), international standard ratio (R-INR), and fibrinogen (R-FIB). Matching donor blood indicators included glomerular filtration rate (D-GFR), serum creatinine level (D-creatinine), D-urea, D-albumin, D-K+, and D-Na+. A total of 6 DIs and 34 CBIs were used to construct the prediction model. All donor information was collected before hospital death, and recipient messages were collected seven days before allograft.
Rejection criteria: 1. Missing any of the above indicators; 2. Recipients who have received 2 or more transplants.
Observation endpoint: 1. The follow-up time is until June 30, 2021; 2. During the follow-up period, the loss of the allograft or death of the recipient is the observation endpoint.
Immunosuppressant Regimen
During surgery and on the first and second days after surgery, 500mg of methylprednisolone (bodyweight above 50 kg) or 250 mg of methylprednisolone (bodyweight below 50 kg) were administered as shock therapy, 120 mg on the 3rd day after surgery, 80 mg on the 4th day, and 40 mg on the 5th day. On the 6th day, prednisone acetate tablet (Pred) 10 mg (orally, once a day) was changed. Induction with anti-thymocyte globulin or basiliximab for injection is not routine. Oral administration of Mycophenolate mofetil capsule (MMF) was immediately started after the operation, and tacrolimus capsule (FK506) was routinely added on the second day after the operation. The three-way anti-rejection regimen during the maintenance period was MMF+FK506+PRED. The use of MMF was adjusted according to the AUC of MPA, so that the AUC of MPA was maintained at 30–60 mg·h/L. Adjust the FK506 according to the trough concentration of tacrolimus, the treatment window of FK506 was 10–15 ng/mL 1 month after surgery, 9–12 ng/mL 2~3 months after surgery, 7–10 ng/mL 4~6 months after surgery, and 4–8 ng/mL after 6 months of surgery.
Statistical Analysis
Statistical data analysis was performed using the R software (Version 4.0.5; https://www.R-project.org), and P values less than 0.05 were considered statistically significant. GraphPad 8.0 was used to plot graft survival of two groups with and without DGF.
The collected database is all continuous variables to utilize the role of continuous data in model building and find the best cut-off value of variables in the R code, we used multivariable logistics regression to convert 34 blood indicators into dichotomous variables. We screened the variables with P<0.05. Then, the least absolute shrinkage and selection operator (LASSO) was used to filter for the above qualifying binary variables and decrease the dimensionality of the prediction model so that it could be expressed simply and clearly.8,9 The non-zero coefficients of the predictors and the odds ratio (OR) data, such as the 95% confidence interval, are produced following the model construction with the LASSO technique. The non-zero scores were used to aggregate the LASSO-selected predictors into a Riskscore. Likewise, using multivariable logistic regression, six types of demographic characteristics screened out predictive factors of P<0.05, and together they produced an in-hospital DGF-prediction model, which was illustrated using a nomogram.
The coefficients of the predictors were used to create receiver operating characteristic (ROC) curves and get values of the area under the curve (AUC) with a 95% confidence interval after establishing the nomogram. The AUC was used to evaluate the model’s discrimination under the ROC curve, whereas the calibration plot was utilized to examine the nomogram’s calibration graphically in both the training and validation cohorts. To test the prediction model standardization, calibration curves were plotted. The model was not perfectly calibrated, according to a significance test. Whereas standard diagnostic indicators only indicate the diagnostic accuracy of a prediction model and not its clinical applications, decision curve analysis (DCA) considers patient characteristics.10 Furthermore, by measuring the net benefit at various probability thresholds, this sort of research verifies the clinical validity of a prediction model. The net benefit was computed by subtracting the proportion of false-positive recipients from true-positive recipients and balancing the proportional damage of foregoing the treatment with the adverse effects of an unwanted treatment.11 In the last phase, the 211 recipients’ dataset (with the 133 donors’ dataset) was evenly and randomly divided into two groups: Training and Validation. This operation was carried out a total of ten times (the performance of the model was also augmented with 10-fold cross-validation in the cohort). Consequently, we tested the internal dataset 10 times, and the two subgroups provided a collection of AUC values, false-positive rates, and true-positive rates for each division. Figure 1 depicts the whole workflow.
 |
Figure 1 The flowchart of the predictive model of DGF. |
Result
Table 1 shows the collected DIs and CBIs. The cut-off value, P-value, and AUC value of each variable were based on the results from the best separation (Table 1). The donor database was based on 211 cases of matched recipient data. A total of 211 recipients (133 donors) were selected out of 238 cases for the study, 29 cases developed DGF, and the incidence rate was (29/211) 13.7%. Among the donors, the male to female ratio was 107:26, and the mean age was 45.1±16.3 years. Among the recipients, the male to female ratio was 145:66, and the mean age was 39.9±9.9 years. The results of the pre-transplant Panel reactive antibody are all negative This database converts blood indicators into dichotomous variables through multivariable logistics regression and obtains the following dichotomous variables through P<0.05: R-K+, R-Na+, R-HCO3−, R-LYMP, R-EO, R-INR, R-FIB, R-TT, D-GFR, D-creatinine, D-urea, D-albumin, D-Na+. There are 13 predictors in total. LASSO’s algorithm obtained 12 predictors for the above 13 dichotomous variables (R-INR was removed) (Figure 2A and B), and the non-zero coefficient, OR value and 95% confidence interval of the predictor were obtained, as shown in Table 2. Moreover, these 12 predictors are formed into a Riskscore. In addition, the three predictive factors of R-age, R-BMI, and WIT selected by the 6 independent risk factors of DIs are combined to construct a nomogram to visualize the predictive model, as shown in Figure 3 (Three predictive factors of demographic characteristics were screened multivariable Logistic regression, and obtained three corresponding coefficients. On the other hand, the 12 clinical blood indicators screened by LASSO also generated corresponding coefficients used to synthesize a Riskscore. Our nomogram is constructed using the above three demographic coefficients and Riskscore). The nomogram illustrates that A recipient with Riskscore of 7.9, R-age of 47 years, R-BMI of 25.5, and WIT of 20 minutes, suffered the probability of postoperative DGF is 0.65. ROC exhibits an excellent predictive ability of the nomogram for DGF, and the AUC value under ROC is 0.725, as shown in Figure 4A. Calibration also verifies the model, as shown in Figure 4B. The DCA shows that when the probability of predicting DGF is between 0.1 and 0.9, the clinical effect of an intervention on the patient is the best, as shown in Figure 4C, verifying excellent clinical effect of the model. To further evaluate the universality of model performance, we performed 10-fold cross-validation on the model in training cohort. We obtained an AUC value and 95% confidence interval, which also achieved good prediction results, as shown in Table 3.
 | 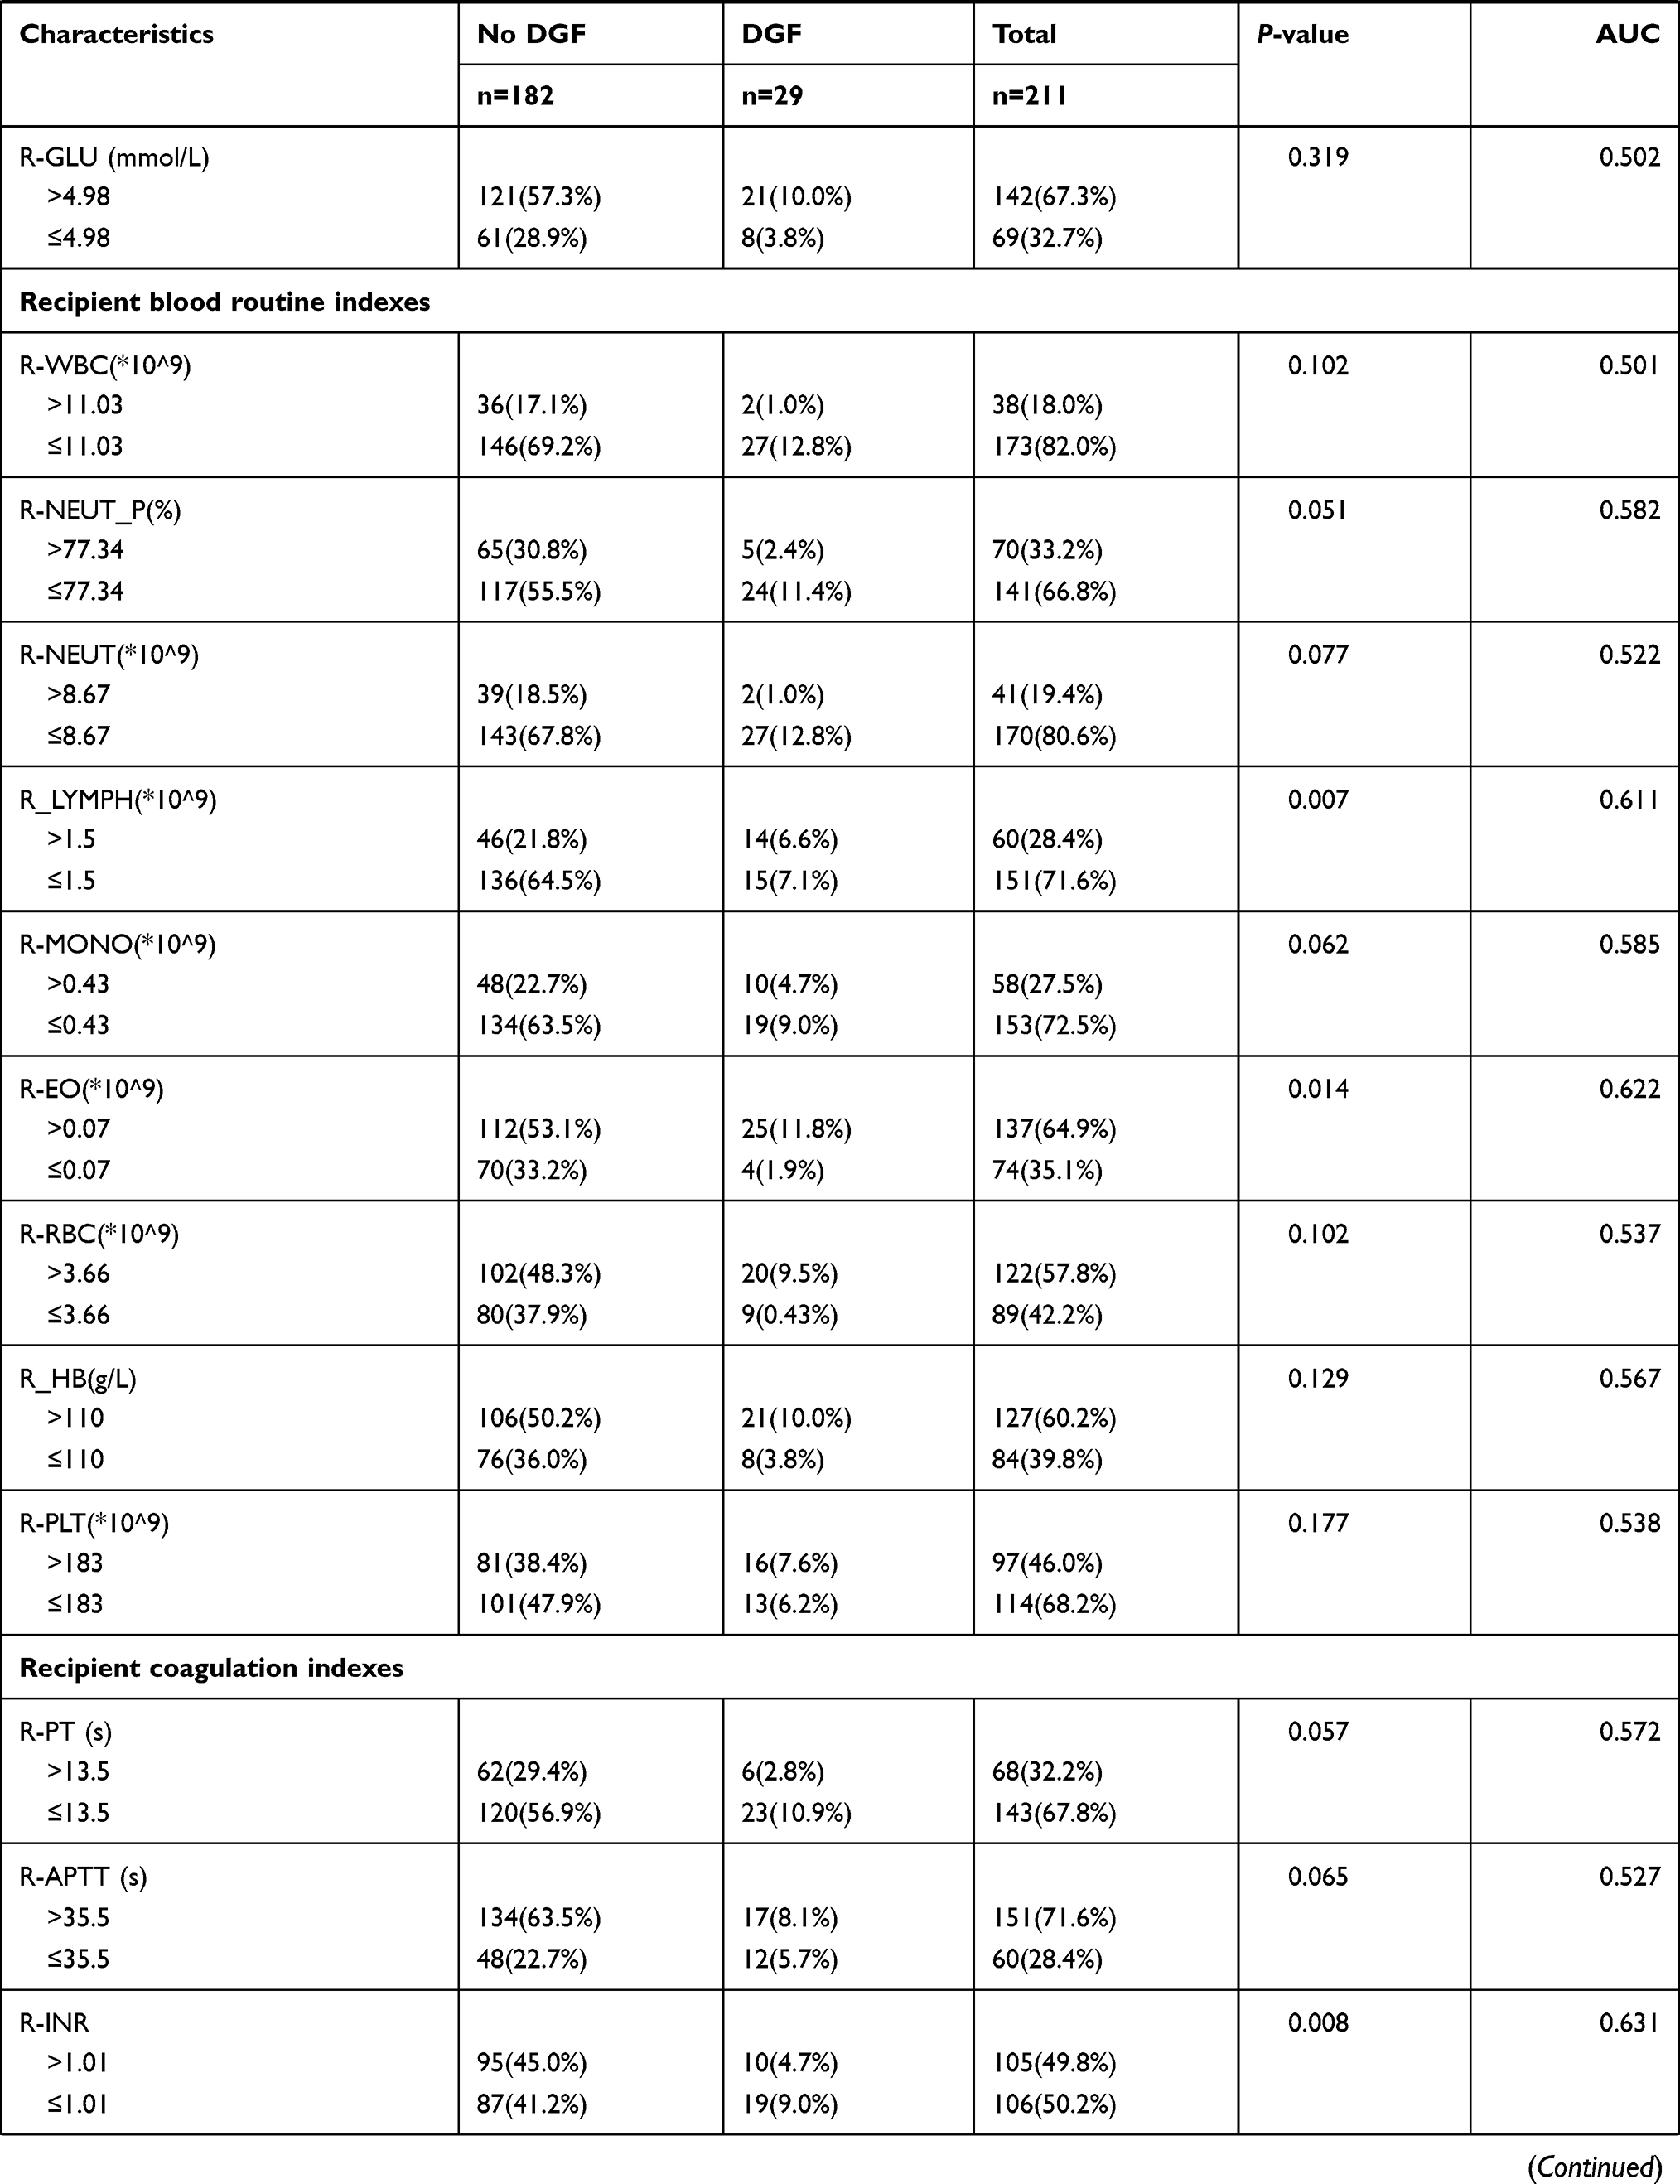 | 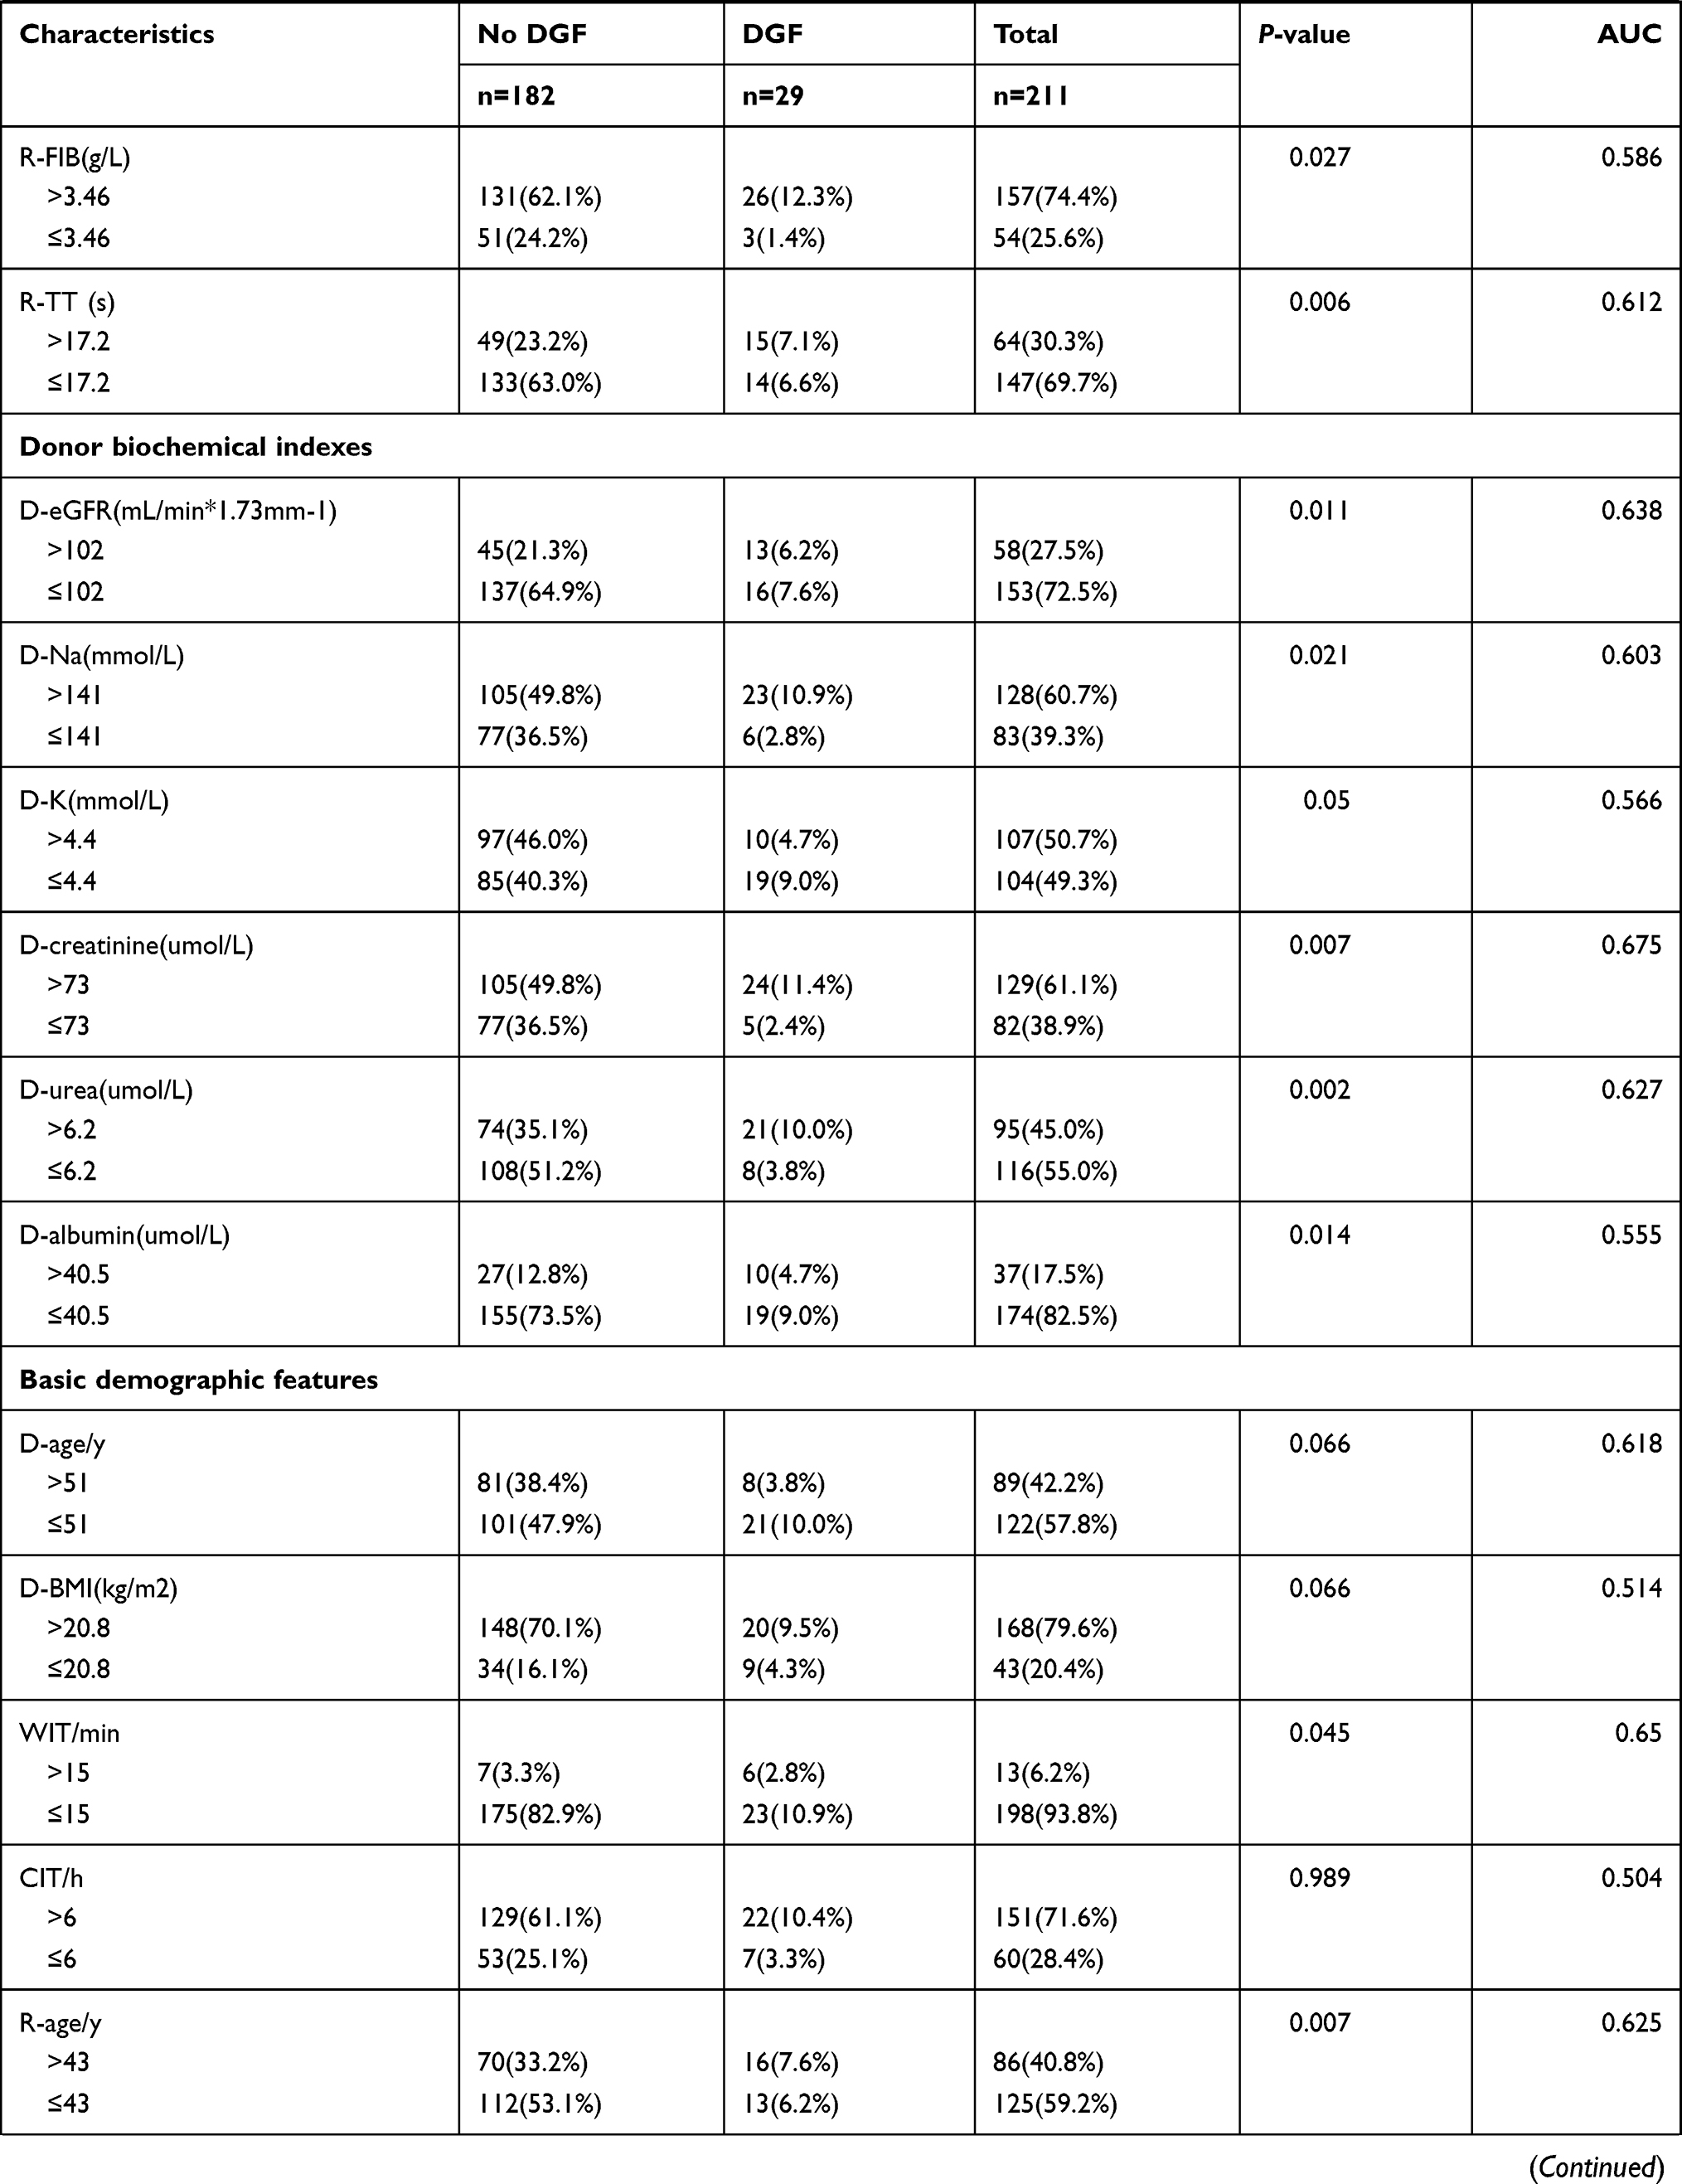 | 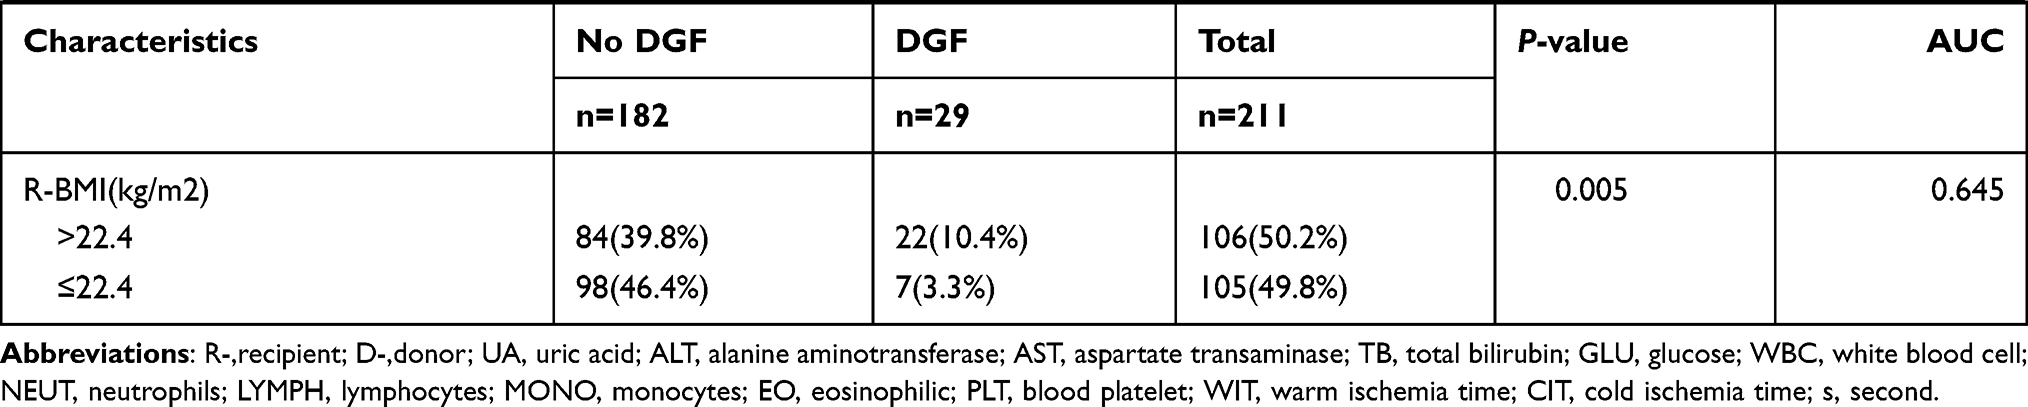 |
Table 1 Demographics and Clinical Characteristics of the DGF and Non-DGF Groups |
 |
Table 2 Morbidity of DGF Prediction Factors After Renal Transplantation from DD Donors |
 |
Table 3 Evaluation Results for the Proposed Model Among 10 Randomly Selected Independent Subgroups |
 |
Figure 2 Demographics and clinical features selection using the LASSO binary regression model. Notes: (A) In the LASSO model, the best lambda parameter is selected using 5-fold cross-validation and minimal criteria. The curve of the partial likelihood deviance (binomial deviance) was plotted versus the logarithm of the lambda parameter. Dotted vertical lines were drawn at the optimal values using the minimum criteria and the I SE of the minimum criteria (I-SE criteria). (B) For 13 characteristics, LASSO coefficient profiles were created. Each coefficient profile was displayed against the lambda parameter’s logarithm. The vertical line was generated using 5-fold cross-validation at the selected value, where the best lambda value was generated in 12 features with nonzero coefficients. |
 |
Figure 3 Developed nomogram of DGF. Notes: The nomogram of DGF was developed in the cohort using WIT, R-age, R-BMI, and Riskscore. The Riskscore includes 12 CBIs, namely R-K+, R-Na+, R-HCO3−, R-LYMP, R-EO, R-FIB, R-TT, D-GFR, D-creatinine, D-urea, D-albumin, and D-Na+. |
 |
Figure 4 Assessment of the clinical effectiveness of the proposed model. Notes: (A) The post-KT morbidity risk prediction nomogram’s receiver operating characteristic (ROC) curves. The x-axis and y-axis reflect the post-KT morbidity prediction’s false-positive and true-positive rates, respectively. The AUC (area under the receiver operating characteristic curve) is 0.725. (B) The research cohort’s calibration curves for the nomogram of post-KT morbidity risk prediction. The post-KT DGF forecasts are on the x-axis, while the actual DGF is on the y-axis. An ideal model’s flawless prediction results match the diagonal dotted line. The nomogram performance is represented by the solid line, with a closer match to the diagonal dotted line indicating better prediction. (C) For post-KT DGF, decision curve analysis (DCA) was used. The net benefit is represented on the y-axis. The post-KT DGF risk nomogram is represented by the red line. The thin solid line denotes the assumption that all kidney receivers would survive following transplantation, whereas the thick solid line denotes the assumption that all kidney recipients will suffer DGF after transplantation. The decision curve shows that the threshold probabilities of a patient and a doctor are (>0.1) and (<0.9), respectively. The current study found that using the morbidity risk nomogram for post-KT morbidity risk prediction is more helpful than using the intervention-for-all-recipients or no-intervention schemes. |
The average follow-up time of the above 211 recipients was 31 months, and interquartile range (25,39) months. We found 4 patients with graft loss in the DGF group and 7 patients with non-DGF, a total of 11 cases. Statistical analysis showed that the Log-rank (Mantel-Cox) test P=0.0234, Hazard Ratio (log-rank)=DGF/non-DGF=3.736. The drawn K-M curve is shown in Figure 5.
 |
Figure 5 Kaplan-Meier plot of graft survival for DGF. |
Discussion
With the development of DD KT, an increasing number of ESRD patients get the opportunity of KT; however, the incidence of postoperative complications also increases parallel. DGF is one of the typical and essential complications. The occurrence of DGF can lead to postoperative oliguria and anuria, which increases the risk of postoperative renal transplant rejection, affects the short- and long-term outcome and increases the medical expenses of treatment. In the medical community, risk assessment is also increasingly used as a tool to update clinical protocol decisions and resource allocation. Therefore, using the preoperative data of our center to conduct the risk assessment of DGF for patients is beneficial to clinicians to match the best donor and recipient. It is also helpful to conduct induction therapy in advance for patients who have completed the operation to reduce the risk of DGF and improve the survival rate of the recipient.
In this study, 34 CBIs were placed in the multivariable logistics regression and Lasso algorithm to obtain 12 predictors, constituting a Riskscore. The Riskscore and 3 DIs (R-age, R-BMI and WIT) jointly form a nomogram. The obtained ROC effect is good, and the AUC value is 0.725. Calibration and DCA also showed excellent discrimination. 10-fold cross-internal validation also demonstrated the accuracy and reliability of the model.
In our perspective and observational model, 12 blood indicators were included; however, these indicators are widespread and must be checked before allograft, which is easy for clinicians to obtain. Secondly, these indicators include D-creatinine, D-GFR, and D-urea, which reflect the renal function of the donor,12 and indicators that reflect the important coagulation function of the receptor, including R-FIB and R-TT. There are R-K+, R-Na+, R-HCO3−, R-LYMPH, R-EO and other indicators that reflect the homeostasis and resistance of the patient’s body. Therefore, blood markers are involved in the risk assessment of DGF in the model.
During constructing the prediction model, it is noteworthy that the effect of CIT on DGF is not significant, which is contrary to some previous studies.13,14 With the progress of medicine and in-depth research on DGF in recent years, some researchers found that the effect of CIT on DGF is gradually decreasing. For example, Lobb and Colleagues reported that15 compared with the control group, the survival rate of allograft animal models treated with hydrogen sulfide during cold storage was significantly improved (P<0.01). In an analysis of a large clinical database, Chapal et al16 also found that recipients using immunosuppressants after KT can also regardless of the impact of CIT. Helanterä et al17 reported that the risk of CIT to DGF was not significant while analyzing the data of 90,810 recipients who received DD in the United States from 2010 to September 2018. LifePort cryogenic machine perfusion18 and other advances in preserving the donor kidney during the transport stage have significantly reduced the impact of CIT on renal ischemia-reperfusion injury. Therefore, the above-mentioned series of experiments and clinical cohort analysis demonstrate the insignificance of the CIT of the center for predicting the effect of DGF. In addition, using the original database, we found that the gender ratio of donors and recipients is highly unbalanced. This is related to the province’s social ideology, family income, and insufficient hospital publicity coverage. This imbalance will lead to significant errors in the model. To increase the universality of the model, gender factor was not included in this study.
The nomogram shows that WIT has a significant impact on graft renal. WIT is a period of time from stopping the donor’s blood supply to the beginning of cold perfusion. From the perspective of pathology, kidney cells are still undergoing metabolism in the absence of blood supply. Meanwhile, due to the lack of oxygen and various metabolic substrates, the metabolic level of organs is still high, so ischemic organ damage appears faster and more severe. Moreover, anaerobic metabolism can still be conducted after oxygen consumption; however, the metabolites cannot be eliminated, cause acidosis, and consume nutrients and enzyme systems necessary for metabolism.19 Therefore, the above-mentioned chain reactions cause kidney damage, which is directly proportional to time. This is also an important topic for transplant-related researchers.
The influence of R-age and R-BMI on the occurrence of DGF has been reported in many studies, and the opinions tend to be unified. As R-age increases, the risk of triggering postoperative DGF is higher.20,21 The risk of DGF is also proportional to R-BMI. Hill et al22 reported that obese patients (BMI≥30kg/m2) are more likely to suffer from DGF than normal patients (18.5kg/m2≤BMI≤24.9 kg/m2).
Compared with other related predictive DGF models, the nomogram obtained in this study strives to pursue a concise and refined visualization model based on a comprehensive analysis of preoperative clinical indicators. The earliest widely recognized DGF prediction model was reported by Irish et al The nomogram included 18 parameters. However, it was limited to the non-blood index data of the donor and recipient, and the nomogram was more complicated.23 Chapal et al selected many samples to make prediction models and used mathematical formulas to evaluate DGF. However, they did not use a specific and intuitive form to show the final result, which was difficult to understand.16 Zaza et al lack a verification link in the model.12 Unlike the database built by the above-mentioned researchers, this study not only contains basic clinical information of donors and recipients, but also innovatively incorporates a large number of CBIs of donors and recipients for analysis, evaluates the risk probability of DGF in multiple dimensions, and makes the model more scientific and comprehensive.
Certainly, this study still has some weaknesses that limit the maturity of this model. Firstly, the data samples need to be further explored to improve the accuracy of the results, optimize the fitting degree, and avoid false regression. Secondly, the model needs to be validated by multi-center data. The database is mainly from the province, and further verification is needed for the other provinces or other countries to strengthen the universality and practicability of the model. In addition, it should be emphasized that this prediction model is only applicable to kidney transplant recipients who have received DD for the first time.
In conclusion, the prediction model established in this database integrated two aspects of donor and recipient, including demographics, clinical blood routine, biochemical, anticoagulant, and other 40 indicators, and has important guiding significance for inducing and avoiding DGF in advance.
Data Sharing Statement
All data generated or analyzed during this study are included in this published article.
Ethics Approval and Consent to Participate
This study was conducted with approval from the Ethics Committee of the First Affiliated Hospital of Anhui Medical University. This study was conducted in accordance with the declaration of Helsinki. Written informed consent was obtained from all participants. Moreover, all kidneys were donated voluntarily with written informed consent, and that this was conducted with the Declaration of Istanbul.
Acknowledgments
Thanks to M Zhang and JL Meng for their valuable comments and substantial support for the guidance of the paper.
Author Contributions
All authors made substantial contributions to conception and design, acquisition of data, or analysis and interpretation of data; took part in drafting the article or revising it critically for important intellectual content; gave final approval of the version to be published; and agree to be accountable for all aspects of the work.
Funding
There is no funding to report.
Disclosure
The authors declare that they have no competing interests.
References
1. Levey AS, de Jong PE, Coresh J, et al. The definition, classification, and prognosis of chronic kidney disease: a KDIGO Controversies Conference report. Kidney Int. 2011;80(1):17–28. doi:10.1038/ki.2010.483
2. Perico N, Cattaneo D, Sayegh MH, Remuzzi G. Delayed graft function in kidney transplantation. Lancet. 2004;364(9447):1814–1827. doi:10.1016/S0140-6736(04)17406-0
3. Bahl D, Haddad Z, Datoo A, Qazi YA. Delayed graft function in kidney transplantation. Curr Opin Organ Transplant. 2019;24:82–86.
4. Yarlagadda SG, Coca SG, Garg AX, et al. Marked variation in the definition and diagnosis of delayed graft function: a systematic review. Nephrol Dial Transplant. 2008;23(9):2995–3003. doi:10.1093/ndt/gfn158
5. Ravaioli M, De Pace V, Comai G, et al. Preliminary experience of sequential use of normothermic and hypothermic oxygenated perfusion for donation after circulatory death kidney with warm ischemia time over the conventional criteria - a retrospective and observational study. Transpl Int. 2018;31(11):1233–1244. doi:10.1111/tri.13311
6. Treat E, Chow EKH, Peipert JD, et al. Shipping living donor kidneys and transplant recipient outcomes. Am J Transplant. 2018;18(3):632–641. doi:10.1111/ajt.14597
7. Siedlecki A, Irish W, Brennan DC. Delayed graft function in the kidney transplant. Am J Transplant. 2011;11(11):2279–2296. doi:10.1111/j.1600-6143.2011.03754.x
8. Sauerbrei W, Royston P, Binder H. Selection of important variables and determination of functional form for continuous predictors in multivariable model building. Stat Med. 2007;26(30):5512–5528. doi:10.1002/sim.3148
9. Friedman J, Hastie T, Tibshirani R. Regularization paths for generalized linear models via coordinate descent. J Stat Softw. 2010;33(1):1. doi:10.18637/jss.v033.i01
10. Vickers AJ, Cronin AM, Elkin EB, Gonen M. Extensions to decision curve analysis, a novel method for evaluating diagnostic tests, prediction models and molecular markers. BMC Med Inform Decis Mak. 2008;8:53. doi:10.1186/1472-6947-8-53
11. Huang YQ, Liang CH, He L, et al. Development and validation of a radiomics nomogram for preoperative prediction of lymph node metastasis in colorectal cancer. J Clin Oncol. 2016;34(18):2157–2164. doi:10.1200/JCO.2015.65.9128
12. Zaza G, Ferraro PM, Tessari G, et al. Predictive model for delayed graft function based on easily available pre-renal transplant variables. Intern Emerg Med. 2015;10(2):135–141. doi:10.1007/s11739-014-1119-y
13. Melih KV, Boynuegri B, Mustafa C, Nilgun A. Incidence, risk factors, and outcomes of delayed graft function in deceased donor kidney transplantation. Transplant Proc. 2019;51(4):1096–1100. doi:10.1016/j.transproceed.2019.02.013
14. Kayler LK, Srinivas TR, Schold JD. Influence of CIT-induced DGF on kidney transplant outcomes. Am J Transplant. 2011;11(12):2657–2664. doi:10.1111/j.1600-6143.2011.03817.x
15. Lobb I, Jiang J, Lian D, et al. Hydrogen sulfide protects renal grafts against prolonged cold ischemia-reperfusion injury via specific mitochondrial actions. Am J Transplant. 2017;17(2):341–352. doi:10.1111/ajt.14080
16. Chapal M, Le Borgne F, Legendre C, et al. A useful scoring system for the prediction and management of delayed graft function following kidney transplantation from cadaveric donors. Kidney Int. 2014;86(6):1130–1139. doi:10.1038/ki.2014.188
17. Helanterä I, Ibrahim HN, Lempinen M, Finne P. Donor age, cold ischemia time, and delayed graft function. Clin J Am Soc Nephrol. 2020;15(6):813–821. doi:10.2215/CJN.13711119
18. Hosgood SA, Yang B, Bagul A, Mohamed IH, Nicholson ML. A comparison of hypothermic machine perfusion versus static cold storage in an experimental model of renal ischemia reperfusion injury. Transplantation. 2010;89(7):830–837. doi:10.1097/TP.0b013e3181cfa1d2
19. Halazun KJ, Al-Mukhtar A, Aldouri A, Willis S, Ahmad N. Warm ischemia in transplantation: search for a consensus definition. Transplant Proc. 2007;39(5):1329–1331. doi:10.1016/j.transproceed.2007.02.061
20. Ozkul F, Erbis H, Yilmaz VT, Kocak H, Osmanoglu IA, Dinckan A. Effect of age on the outcome of renal transplantation: a single-center experience. Pak J Med Sci. 2016;32(4):827–830. doi:10.12669/pjms.324.10094
21. Moreira P, Sá H, Figueiredo A, Mota A. Delayed renal graft function: risk factors and impact on the outcome of transplantation. Transplant Proc. 2011;43(1):100–105. doi:10.1016/j.transproceed.2010.12.023
22. Hill CJ, Courtney AE, Cardwell CR, et al. Recipient obesity and outcomes after kidney transplantation: a systematic review and meta-analysis. Nephrol Dial Transplant. 2015;30(8):1403–1411. doi:10.1093/ndt/gfv214
23. Irish WD, Ilsley JN, Schnitzler MA, Feng S, Brennan DC. A risk prediction model for delayed graft function in the current era of deceased donor renal transplantation. Am J Transplant. 2010;10(10):2279–2286. doi:10.1111/j.1600-6143.2010.03179.x
 © 2021 The Author(s). This work is published and licensed by Dove Medical Press Limited. The
full terms of this license are available at https://www.dovepress.com/terms
and incorporate the Creative Commons Attribution
- Non Commercial (unported, 3.0) License.
By accessing the work you hereby accept the Terms. Non-commercial uses of the work are permitted
without any further permission from Dove Medical Press Limited, provided the work is properly
attributed. For permission for commercial use of this work, please see paragraphs 4.2 and 5 of our Terms.
© 2021 The Author(s). This work is published and licensed by Dove Medical Press Limited. The
full terms of this license are available at https://www.dovepress.com/terms
and incorporate the Creative Commons Attribution
- Non Commercial (unported, 3.0) License.
By accessing the work you hereby accept the Terms. Non-commercial uses of the work are permitted
without any further permission from Dove Medical Press Limited, provided the work is properly
attributed. For permission for commercial use of this work, please see paragraphs 4.2 and 5 of our Terms.