Back to Journals » Drug Design, Development and Therapy » Volume 12
Development and validation of an oxygen dissociation assay, a screening platform for discovering, and characterizing hemoglobin–oxygen affinity modifiers
Authors Patel MP, Siu V, Silva-Garcia A, Xu Q, Li Z ![]() , Oksenberg D
, Oksenberg D
Received 20 November 2017
Accepted for publication 10 April 2018
Published 1 June 2018 Volume 2018:12 Pages 1599—1607
DOI https://doi.org/10.2147/DDDT.S157570
Checked for plagiarism Yes
Review by Single anonymous peer review
Peer reviewer comments 3
Editor who approved publication: Dr Qiongyu Guo
Mira P Patel,1 Vincent Siu,1 Abel Silva-Garcia,1 Qing Xu,2 Zhe Li,2 Donna Oksenberg1
1Biology Department, Global Blood Therapeutics Inc., South San Francisco, CA, USA; 2Chemistry Department, Global Blood Therapeutics Inc., South San Francisco, CA, USA
Introduction: Hemoglobin (Hb) is a critical molecule necessary for all vertebrates to maintain aerobic metabolism. Hb–oxygen (O2) affinity modifiers have been studied to address various diseases including sickle cell disease, hypoxemia, tumor hypoxia, and wound healing. However, drug development of exogenous Hb modifiers has been hindered by the lack of a technique to rapidly screen compounds for their ability to alter Hb–O2 affinity. We have developed a novel screening assay based upon the spectral changes observed during Hb deoxygenation and termed it the oxygen dissociation assay (ODA).
Methodology: ODA allows for the quantitation of oxygenated Hb at given time points during Hb deoxygenation on a 96-well plate. This assay was validated by comparing the ability of 500 Hb modifiers to alter the Hb–O2 affinity in the ODA vs the oxygen equilibrium curves obtained using the industry standard Hemox Analyzer instrument.
Results: A correlation (R2) of 0.7 indicated that the ODA has the potential to screen and identify potent exogenous Hb modifiers. In addition, it allows for concurrent comparison of compounds, concentrations, buffers, or pHs on the level of Hb oxygenation.
Conclusion: With a cost-effective, simple, rapid, and highly adaptable assay, the ODA will allow researchers to rapidly characterize Hb–O2 affinity modifiers.
Keywords: hemox analyzer, in vitro assays, small-molecule screening, voxelotor
Introduction
Hemoglobin (Hb) is a critical protein involved in binding, transporting, and off-loading oxygen.1–3 Due to this multifaceted role, Hb has evolved to exist in equilibrium between the liganded, oxygenated Hb (oxy Hb) form and unliganded, deoxygenated (deoxy Hb) form.1 Hb is sensitive to allosteric modifiers, such as carbon dioxide (CO2), hydrogen ions, and 2,3 diphosphoglycerate (2,3-DPG), which enables adequate binding, transport, and delivery of oxygen.1,4 Such allosteric modifiers enable Hb variable oxygen affinity in vivo.1,2 Modulating the oxygen (O2) affinity of Hb with exogenous modifiers may be a promising approach for treating a range of diseases.1 For example, maintaining a portion of Hb in the high-affinity oxygenated state is beneficial for sickle cell disease (SCD), as it will delay the polymerization of deoxygenated sickle Hb (HbS), which is the major driver of the pathophysiology of the disease.5,6 In addition, increasing the Hb–O2 affinity may benefit hypoxemia related to pulmonary diseases as it will increase O2 saturation in the lungs.7,8 Alternatively, decreasing Hb–O2 affinity could be useful in diseases such as tumor hypoxia, wound healing, or ischemia where increased O2 delivery to tissues is needed.1 For these reasons, various Hb modifiers have been identified that either increase (5-HMF, tucaresol, BW12C, voxelotor [previously known as GBT440], GBT1118) or decrease (RSR-13, ITPP) Hb–O2 affinity.5,7,9
Drug discovery in the Hb–O2 affinity modifier field has been hampered by limitations wherein instruments requiring high concentrations of Hb necessitate high concentrations of compounds for testing. Hb–O2 affinity modifiers have been identified using clinical instrumentation that measures the partial pressure of O2 at which Hb is 50% saturated with O2 (p50) through oxygen equilibrium curves (OECs).10 These instruments have included tonometers, Hem-O-Scans, and TCS Hemox Analyzers.10 Though the TCS Hemox Analyzer and similar equipment are the standard in the field for characterizing Hb mutations with altered Hb–O2 affinity, such instruments are not conducive to screening, or to performing structure–activity relationship (SAR)-based drug discovery, which often requires high-throughput screening. The TCS Hemox Analyzer, which is the most advanced instrumentation currently deployed, measures the oxygen partial pressure and concurrently measures Hb saturation with a Clark oxygen electrode and spectrophotometry, respectively. The TCS Hemox Analyzer uses a 20–30 μM Hb solution and a 5 mL cuvette, which prevents simultaneous measurements. Due to these limitations, measuring an OEC using the TCS Hemox Analyzer requires a minimum of 20 minutes per sample and sufficient compound to be tested against 20–30 μM of Hb in a 5 mL cuvette.11 In addition, to measure reliable OECs, the compounds need to be soluble at the concentrations being tested. These factors are limiting when using OECs for drug discovery.
To overcome these drawbacks, researchers have attempted to develop a variety of miniaturization techniques. One such assay, the Hb–oxygen binding assay, was developed by Nakagawa et al (2014) wherein changes were observed over a 14-hour period at three different FO2 (fraction of oxygen gas in chamber) levels in a 384-plate format.12 Based upon similar principles, we developed the oxygen dissociation assay (ODA), which uses the Soret (400–450 nm) and Q (500–600 nm) bands of Hb to measure the level of oxy Hb during deoxygenation within a 96-well plate format.5 In addition, the ODA was optimized for Hb tetramer concentrations as low as 3 μM, which consequently lowers the concentration of compounds utilized in screening. The design of the ODA will allow researchers to rapidly compare and characterize putative Hb–O2 affinity modifiers across different concentrations, buffers, and pH conditions.
Materials and methods
Compounds
Phytic acid (also known as inositol hexaphosphate) was purchased from MilliporeSigma, Burlington, MA, USA and efaproxiral was purchased from BePharm Ltd, Shanghai, China. All other compounds including reference compounds, tucaresol, voxelotor (formerly known as GBT440), and GBT1118, were synthesized at Global Blood Therapeutics, South San Francisco, CA, USA.5,7,13 For all studies herein, compounds were solubilized in 100% dimethyl sulfoxide (DMSO) at concentrations ranging from 10 to 100 mM.
Buffers
TES buffer, also known as TES/saline buffer, is 30 mM TES (2-[[1,3-dihydroxy-2-(hydroxymethyl)pro-pan-2-yl]amino]ethanesulfonic acid), 140 mM saline, pH 7.4 at 25°C (unless noted otherwise). Phosphate buffer is 50 mM KH2PO4, 30 μM 2,3-DPG, pH 7.4 (unless noted otherwise).
Blood source
Blood was either obtained through the Children’s Hospital Oakland Research Institute (CHRCO, Oakland, CA, USA [Institutional Review Board {IRB} 2013-006]) or was purchased from the Stanford Blood Center (Stanford, CA, USA) under their approved protocols and with donor written informed consents.
Hb purification
Unique donors (>30) were used for the studies presented herein. Hb was purified from individual donor red blood cells (RBCs) by gel filtration and DE-52 anion exchange chromatography.14 Samples of the eluted fractions were run on a Tris-glycine 12% acrylamide native gel where they were separated according to their isoelectric point (pI) allowing for their identification.
Oxygen dissociation assay
The ODA uses the spectral signatures of Hb (Soret bands: 400–450 nm and Q bands: 500–600 nm) to measure the level of oxy Hb during deoxygenation. Purified Hb (3 μM tetramer in various buffers)15,16 was incubated for 1 hour under ambient air at 37°C in the presence or absence of various compounds in sealed 96-well, half-area, optically transparent polystyrene plates (μClear® bottom; Greiner Bio-One International GmbH, Kremsmünster, Austria). After incubation, the plate seal was removed, and the samples were deoxygenated with gaseous dry N2 for 2 hours at 37°C in a SPECTROstar Nano (BMG Labtech, Inc., Ortenberg, Germany), an ultraviolet/visible (UV/Vis) absorbance spectrometer capable of reading full spectra in <1 second/well. Deoxygenation was achieved by blowing N2 over (but not directly into) the samples at 20 L/min. As the buffer and Hb equilibrate during deoxygenation, spectral measurements (350–700 nm, with a spectral resolution of 1 nm) were obtained every 6 minutes to determine the oxy Hb level over time. In between each measurement, the plate was shaken in a figure 8 for 1 minute at 300 rpm. Data analysis was performed using Excel’s LINEST function on the wavelengths ranging from 380 to 700 nm. The Hb spectrum at time zero was used as the reference for 100% oxy Hb, while the average spectra of Hb with 15 mM sodium dithionite (Merck Millipore, Burlington, MA, USA), a reducing agent, was used as the reference for 100% deoxy Hb (spectra not shown). The results were then expressed as %oxy Hb.5 For the data presented within this manuscript, the issue of methemoglobin was resolved by a visual inspection of all spectra.
Oxygen equilibrium curves
To measure changes in the binding affinity of O2 to Hb, OECs were collected using a TCS Hemox Analyzer (TCS Scientific Corporation, New Hope, PA, USA).11 Hb (25 μM tetramer) was incubated for 45 minutes at 37°C with various concentrations of compounds in TES buffer3. Purified Hb samples were then oxygenated with compressed air for 10 minutes within the Hemox Analyzer. After oxygenation, the samples were deoxygenated with compressed N2 and OECs were collected during deoxygenation as previously described.11 From the OECs, p50 values were derived using TCS Hemox Analysis Software.
pH-dependent Hb–O2 affinity
For the pH-dependent experiments, the ODA was adapted to allow comparison of various pHs within a single plate. In these studies, different pHs (6.8–8.0) were used in the columns of the 96-well plates. Columns 1–3 contained pH 6.8 buffer, columns 4–6 contained pH 7.0 buffer, columns 7–9 had pH 7.4 buffer, and columns 10–12 had pH 8.0 buffer. Row H was the Hb control specific to each pH condition. Hb and compounds were incubated for 1 hour at 37°C under the four pH conditions used. After incubation, data collection and data analysis proceeded as in the standard ODA.
Hb/human serum albumin (HSA) competition experiment
For these studies, all work was conducted using the basic ODA method, with a minor adaptation to include a preincubation step of voxelotor or tucaresol with HSA (MilliporeSigma, Burlington, MA, USA, globulin and fatty acid free). The experiments were conducted using 50 mM potassium phosphate buffer at pH 7.4. Voxelotor or tucaresol was diluted from a 10 mM stock solution (in 100% DMSO). HSA (at concentrations ranging from 0.02 to 200 μM) was incubated with 6 μM voxelotor or 6 μM tucaresol for 1 hour at room temperature. The samples were then diluted twofold with Hb and 2,3-DPG to a final concentration of 0.01–100 μM HSA, 30 μM 2,3-DPG, 3 μM voxelotor or tucaresol, and 3 μM Hb tetramer. These samples were then sealed and incubated at 37°C for an additional hour in a humidified incubator. Following the incubation, data collection and data analysis proceeded as in the standard ODA. As the maximal activity for tucaresol and voxelotor is not equivalent, the data were normalized to the maximal %oxy Hb value. This normalization allowed for discerning the contributions of HSA binding for different compounds.
Results
Assay design
All instruments used to determine the oxygen affinity of Hb rely on the spectral difference between oxy Hb and deoxy Hb. The first step in validating the ODA was to monitor the spectral change from oxy Hb to deoxy Hb during the 2-hour deoxygenation process. After samples are incubated with Hb in 96-well half-area plates, they are placed in the spectrophotometer. The spectrophotometer is set up with a gas inlet that allows for the reading chamber to be filled with N2. When using a BMG SPECTROstar Nano, the microplate chamber can be filled with N2 directly (Figure 1A). As the chamber fills, each well within the 96-well plate is exposed to diminishing levels of O2 (Figure 1B). This change in O2 levels alters the equilibrium between the well and the local atmosphere driving O2 out of the buffer. As oxy Hb releases O2 to the buffer, a spectral shift can be measured (Figure 1C). Humid (≥56% humidity) vs dry N2 was evaluated during assay development and it was found there was no quantitative difference between the two in terms of dehydration or deoxygenation (data not shown). Humidity was measured using a hygrometer placed up against the vent port in the spectrophotometer.
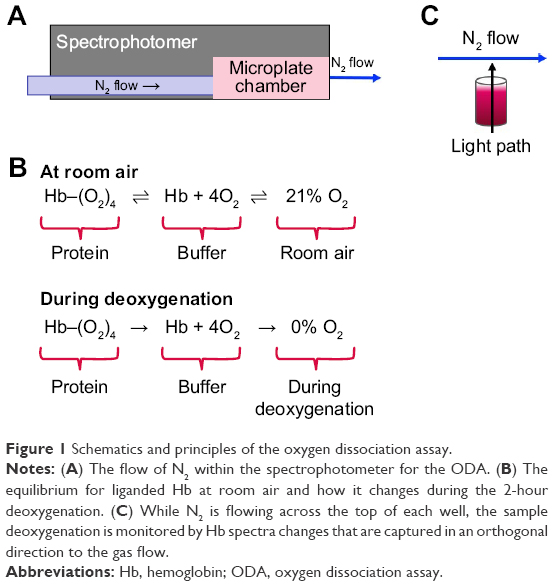 | Figure 1 Schematics and principles of the oxygen dissociation assay. |
Figure 2A shows the spectral measurements of Hb at the beginning and end of the 2-hour deoxygenation process. The characteristic Soret peak at 415 nm transitions toward 430 nm (the λmax of deoxy Hb). Similarly, in the Q-band region, the double peaks of oxy Hb (541, 577 nm) transition toward a single peak at 555 nm, which is also characteristic of deoxy Hb. Data analysis was performed using Excel’s LINEST function on the wavelengths ranging from 380 to 700 nm, as described in the Materials and methods. The results were then expressed as %oxy Hb. The above analysis was conducted on the two spectra from Figure 2A as well as the 18 spectra in between and the results were plotted against time in Figure 2B. As expected the percent of oxy Hb decreased over time, with Hb proceeding from 100 %oxy Hb to 6.46 %oxy Hb.
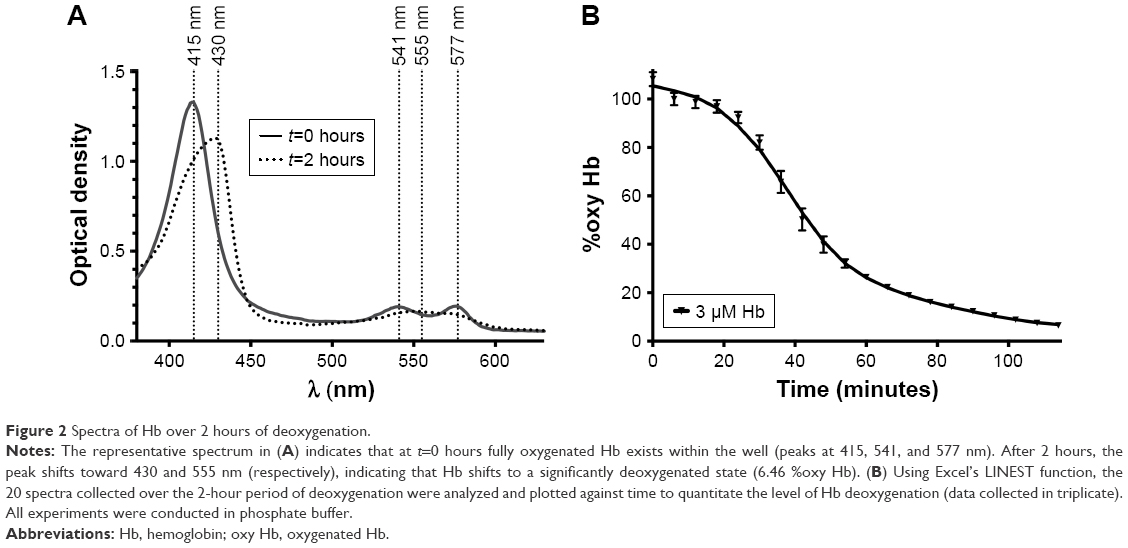 | Figure 2 Spectra of Hb over 2 hours of deoxygenation. |
Comparison to the TCS Hemox Analyzer
We compared the effects of allosteric modifiers on Hb–O2 affinity in the TCS Hemox Analyzer and in the ODA. Figure 3A shows representative OECs of GBT1118,7 an analog of voxelotor,5,13 and phytic acid,17 a potent analog of 2,3-DPG, in comparison to Hb alone. GBT1118 has a left-shifted OEC and a lower p50 value while phytic acid has a right-shifted OEC and a higher p50 in comparison to Hb control (Table 1). Figure 3B shows the %oxy Hb values over time for phytic acid and GBT1118 in the ODA. The data indicate that GBT1118 delays the transition from oxy Hb to deoxy Hb while phytic acid accelerates the transition. Based upon data from Figure 3B, left-shifting compounds seem to be best evaluated at longer deoxygenation times (108 minutes). On the other hand, right-shifting compounds (such as phytic acid) seem to be better differentiated at earlier times (30 minutes).
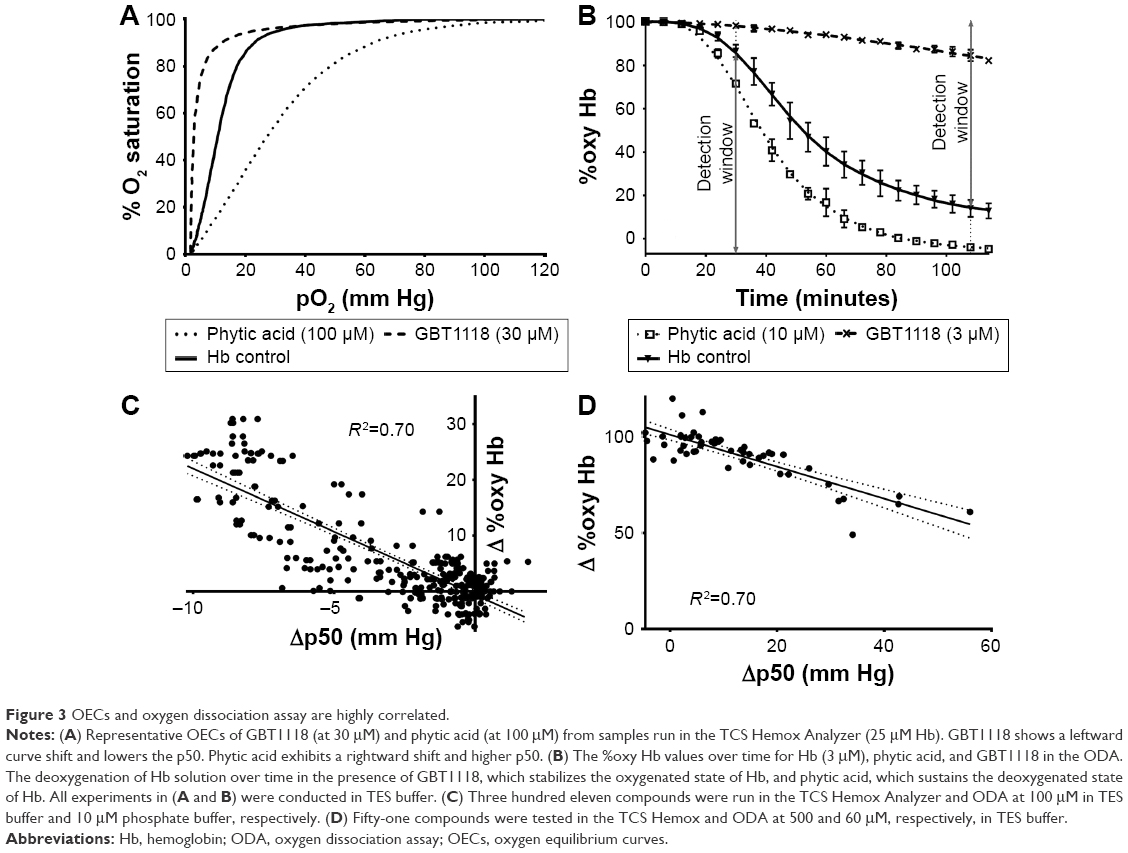 | Figure 3 OECs and oxygen dissociation assay are highly correlated. |
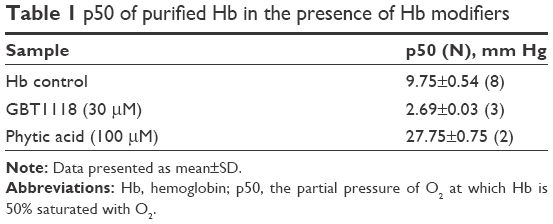 | Table 1 p50 of purified Hb in the presence of Hb modifiers |
Based upon the changes observed with reference compounds, a large-scale comparison was performed to establish how left-shifters (compounds with left-shifted OECs compared to the Hb control) and right-shifters (compounds with right-shifted OECs compared to the Hb control) behaved in the TCS Hemox Analyzer and ODA. Using a subset of GBT Hb modifiers, a correlation was established between the Δp50s (p50sample−p50control) generated on the TCS Hemox Analyzer and the Δ %oxy Hb (%oxy Hbsample−%oxy Hbcontrol) obtained in the ODA. Figure 3C and D shows the correlations between Δp50 and Δ %oxy Hb for various compounds. A correlation (R2) of 0.70 was obtained for both left-shifter (with %oxy Hb measured at 108 minutes) and right-shifter compounds (with %oxy Hb measured at 30 minutes) indicating that this is a relevant primary screening assay to filter out inactive compounds as well as to rank compounds based on Hb modifying potency. The other major advantage is the small amount of compound required – reducing compound aggregation – compared to the greater quantity of compound needed to conduct the assay in a TCS Hemox Analyzer.
The robustness of the assay was determined with a variety of parameters. The intraplate variability is 3.0%–8.0% coefficient of variation (CV) for 30 minutes and 8.9%–13.7% CV for 108 minutes. Similarly, the interplate variability is 3.1%–3.9% CV for 30 minutes and 19.4%–22.2% CV for 108 minutes. The Z′ for 30 minutes is 0.52 while the Z′ for 108 minutes is 0.83.
Various uses for ODA
Dose–response curves
Evaluating dose responses is a standard procedure in drug discovery to evaluate a compound potency. Dose responses help determine the dose necessary to achieve the desired effect for a given ligand/receptor combination. However, in the Hb modifier field, standard dose responses in triplicate have been hindered by the limitation of the instrumentation. For example, in a TCS Hemox Analyzer, a seven-point dose response in triplicate for a single compound would take 3 days, while the same experiment can be completed in a single plate alongside three other Hb–O2 affinity modifiers within 3.5 hours using the ODA. Figure 4 shows examples of ODA dose response of two compounds, GBT11187 (a left-shifter, Figure 4A) and phytic acid17 (a right-shifter, Figure 4B), previously described in the literature.
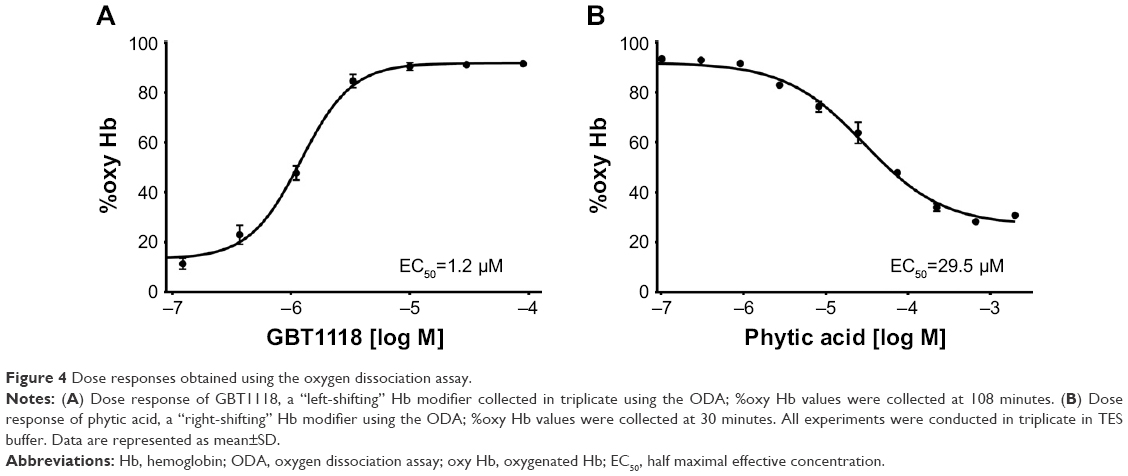 | Figure 4 Dose responses obtained using the oxygen dissociation assay. |
pH-dependent Hb–O2 affinity
A major property of Hb is its ability to deliver oxygen based upon the local tissue needs.2 Hb achieves this through multiple means, one of which is the ability of Hb to change Hb–O2 affinity based upon the hydrogen ion concentration, known as the Bohr effect.2 Metabolically active, or oxygen-starved tissues have a higher demand for oxygen, a buildup of CO2 and switch from aerobic metabolism to anaerobic metabolism, which increases the lactic acid concentration. The combination of the increasing CO2 and increasing lactic acid levels lowers the pH of the oxygen-starved tissues. Due to the Bohr effect, under conditions of lowered pH, the Hb–O2 affinity decreases, allowing for Hb to deliver more oxygen.18 As this is a key property of Hb–O2 affinity modifiers, it was necessary to ensure that the ODA could capture the effect of pH. Figure 5A shows how Hb behaves over time in the ODA. As expected, Hb at pH 6.8 is more rapidly deoxygenated than Hb at pH 7.4, while Hb at pH 8 sustains the oxy Hb state for a longer time frame. Figure 5B shows that GBT1118 maintains a similar % of Hb in the oxy Hb state regardless of pH, which is ideal for a compound designed to maintain a portion of Hb in the oxy Hb state in order to delay HbS polymerization and prevent sickling in SCD patients.13 Even though there was a response to the changing pH, GBT1118 is able to maintain an approximately equal portion of Hb in the oxy Hb state, thereby ensuring that it will be effective at delaying HbS polymerization even in metabolically active tissues. On the other hand, Figure 5C shows that efaproxiral is more effective at deoxygenating Hb at lower pHs, which is ideal for a compound that was designed to deliver more oxygen to hypoxic tissues.19 By having a small decrease in Hb–O2 affinity at pH 7.4, it ensures that Hb is still able to load oxygen in the lungs, while at pH 6.8 in the presence of efaproxiral, the Hb–O2 affinity is significantly decreased, thereby allowing for maximal unloading of oxygen. Table 2 shows the p50s measured for GBT1118 and efaproxiral at pH 6.8 and 8.0. GBT1118 shows a small change (Δp50) between the two pHs (-0.5 to -3.2 mm Hg), while efaproxiral shows a significant increase in Δp50 going from pH 8.0 to pH 6.8 (5 to 22.7 mm Hg). These data corroborate well with what is observed in the ODA.
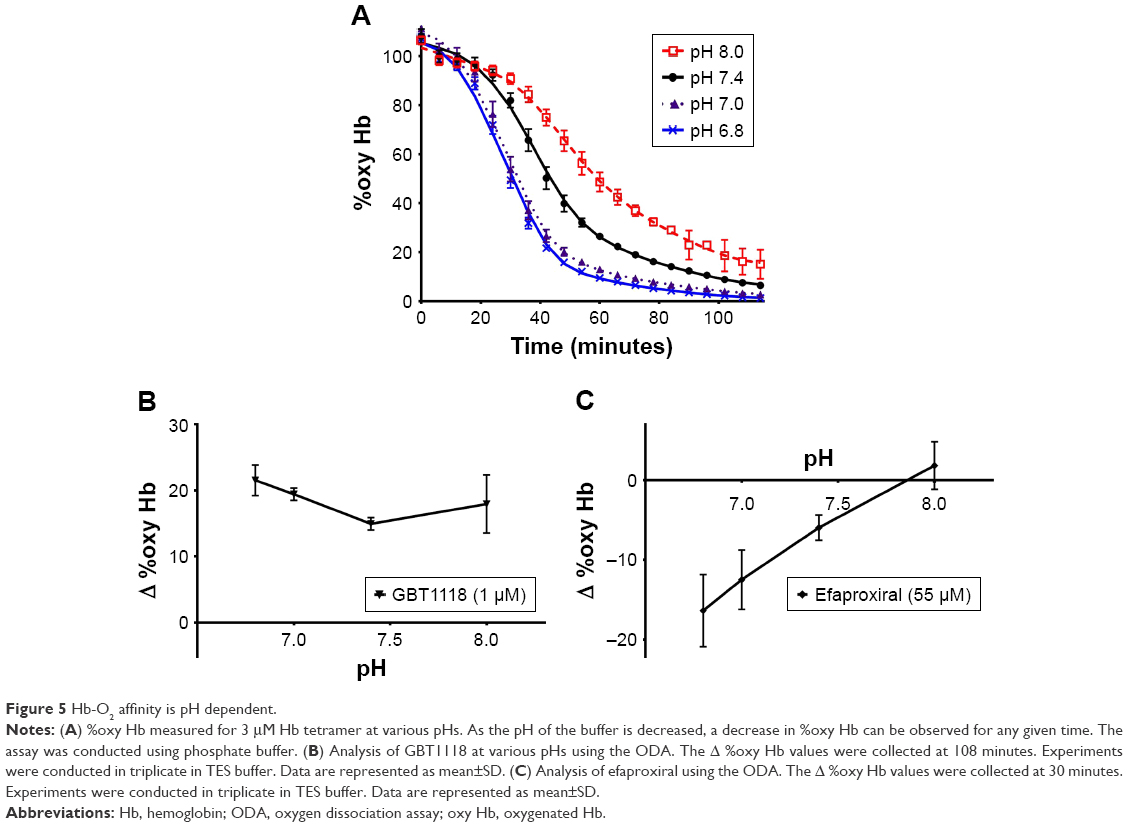 | Figure 5 Hb-O2 affinity is pH dependent. |
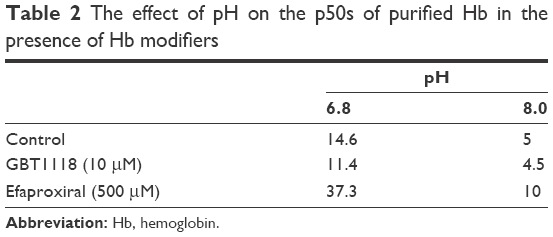 | Table 2 The effect of pH on the p50s of purified Hb in the presence of Hb modifiers |
Albumin vs Hb binding
Finally, the ODA can be used to screen and select Hb modifiers with appropriate protein binding profiles. Depending on the desired output, the compound can be preincubated with either Hb or albumin first and then the second protein added. In Figure 6, the samples were preincubated with albumin for 1 hour and then Hb was added to the system followed by a subsequent 1-hour incubation. The data in Figure 6 indicate that compared to tucaresol, a compound known to have high affinity for plasma proteins,20 voxelotor has a tenfold greater affinity for Hb over albumin. This is demonstrated by the ability of voxelotor to maintain a higher proportion of oxy Hb in the presence of HSA (HSA IC50=10 μM) when compared to tucaresol (HSA IC50=1.4 μM). The preferential voxelotor binding to Hb compared to tucaresol likely contributed to the greater RBC:plasma partitioning of voxelotor with less voxelotor remaining in the plasma compartment upon oral dosing to humans (NCT02285088).20–22 This method can clarify the relative affinities of a given compound for Hb vs HSA, or the nonspecific binding contributions in whole blood.
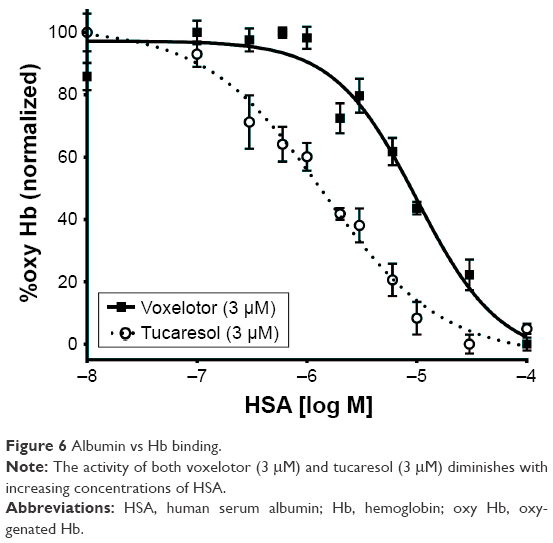 | Figure 6 Albumin vs Hb binding. |
Discussion
The use of Hb–O2 affinity modifiers has been investigated in depth to target diseases, such as SCD,5,6 pulmonary diseases with associated hypoxemia (eg, IPF),7 tumor hypoxia,23,24 wound healing,1 and ischemia.1 However, optimizing such modifiers through SAR for drug discovery has proven difficult because of the limitations of available analytical methodologies. The TCS Hemox Analyzer is a well-established instrument convenient for clinical samples. However, it requires a significant amount of time and compound in order to conduct SAR studies. In this paper, we present the ODA assay – a modular, medium-throughput assay conducive to simultaneously screen Hb–O2 affinity modifiers in a variety of conditions in small volumes. These conditions include, but are not limited to: pH, buffers, and coincubation with proteins such as HSA. As shown in the voxelotor vs tucaresol experiment, measuring HSA effects could prove predictive of pharmacokinetic parameters or RBC:plasma partitioning. This predictive power was confirmed by the data from the clinical trials of voxelotor and tucaresol.20–22 In the Phase I/IIa trial, voxelotor (NCT02285088) was shown to partition preferentially into the RBC compartment in relation to plasma (60–90:1), which indicates a high affinity and specificity for Hb.21 To the contrary, tucaresol, which exhibited a higher HSA IC50 (Figure 6), had a much poorer RBC:plasma partitioning (10–13:1).20,22
In the ODA, we screened over 500 compounds, a combination of left and right-shifters, and showed that this assay can be used to rapidly screen compounds and determine half maximal effective concentration (EC50). We also showed the ability of the ODA to be adapted to characterize compounds with respect to pH and albumin binding sensitivity. Though the ODA is ideal for primary screening, the TCS Hemox Analyzer would still be necessary for a detailed characterization of the Hb–O2 affinity as the ODA does not measure the partial pressure of O2 throughout the assay.
One of the major challenges in developing ODA was determining the optimal Hb concentration. Many screening assays use protein concentrations within the pico- to nano molar range in an effort to minimize compound needs and compound solubility issues. However, at such concentrations, the Hb tetramer dissociates to dimers making lower Hb concentrations a non-optimal choice for a screening campaign. Conversely, as the TCS Hemox Analyzer uses a Hb tetramer concentration of 25 μM, compounds would regularly be above the solubility limit preventing accurate quantitation of the Hb–O2 affinity changes. Based upon the literature references in similar buffer systems, a concentration of 3 μM tetramer became an ideal choice, with Hb levels above the tetramer:dimer equilibrium.15,16 This will still allow for a tenfold decrease in compound concentration (compared to the TCS Hemox), which would ensure that most compounds are below their solubility limit. The secondary benefit gained by decreasing the Hb concentration while simultaneously reducing the volume (TCS Hemox cuvette uses 5 mL, while ODA uses 160 μL/well) ensured a 300-fold total reduction in compound needed for primary screening and SAR studies. Though 3 μM Hb tetramer concentrations could occasionally lead to increases in Hb dimers under different pHs or in the presence of tetramer-destabilizing compounds, a secondary screen using the TCS Hemox will allow confirmation of the ODA hits. On the other hand, if compound solubility is not a concern, the assay and data analysis can be adapted to 10 or 25 μM Hb tetramer concentrations.
As detailed above, the ODA examines the ability of compounds to modulate the release of O2 from Hb under various conditions. This is exemplified by the ODA experiments at various pHs. To conduct a similar experiment with the Hemox Analyzer, the data collection alone would take 2 weeks, which would add day-to-day variability to the data. In addition, such an experiment would require a great amount of compound (1.3 mL for the TCS Hemox Analyser vs 4 μL for the ODA from a 10 mM stock). On the other hand, the ODA can complete such a comparison in triplicate within 3.5 hours in the same day eliminating day-to-day variability, and with <1% of the compound needed.
Although Nakagawa et al12 have reported a similar assay, the ODA goes a step further by decreasing the Hb concentration to 3 μM (vs 10 μM) and the assay time to 2 hours (vs 14 hours) and shows a significant correlation with the TCS Hemox Analyzer for both left-shifters and right-shifters. Finally, one of the strengths of the ODA is its adaptability, allowing researchers to use the assay for both screening and characterizing Hb modifiers. As this article shows, the ODA allowed GBT1118 and efaproxiral to be characterized at a variety of pHs to elucidate the role of pH on Hb–O2 affinity modification. Similarly, the albumin vs Hb assay can aid in rank-ordering compounds for in vivo studies.
Conclusion
This novel assay (ODA) is simple, reproducible, and adaptable and requires no special reagents. It has been evaluated against the TCS Hemox Analyzer with over 500 compounds and displayed a correlation of 0.7 for both right and left-shifting Hb modifiers. In addition, the ODA platform has been used to characterize various compounds5 including those discussed in this article: GBT1118, phytic acid, voxelotor, tucaresol, and efaproxiral. The equipment cost is comparable to a single TCS Hemox and can easily be used for SAR in a screening setting to identify novel Hb–O2 affinity modifiers. The use of the ODA will improve the throughput and allow for a rapid development of novel Hb–O2 affinity modifiers, which will be beneficial to a variety of diseases.
Disclosure
Mira P Patel, Vincent Siu, Abel Silva-Garcia, Qing Xu, Zhe Li, and Donna Oksenberg are employees, and shareholders, of Global Blood Therapeutics, Inc. The authors report no other conflicts of interest in this work.
References
Safo MK, Ahmed MH, Ghatge MS, Boyiri T. Hemoglobin-ligand binding: understanding Hb function and allostery on atomic level. Biochim Biophys Acta. 2011;1814:797–809. | ||
Mairbäurl H, Weber RE. Oxygen transport by hemoglobin. Compr Physiol. 2012;2:1463–1489. | ||
Duarte CD, Greferath R, Nicolau C, Lehn JM. Myo-inositol trispyrophosphate: a novel allosteric effector of hemoglobin with high permeation selectivity across the red blood cell plasma membrane. ChemBioChem. 2010;11:2543–2548. | ||
Sahu SC, Simplaceanu V, Gong Q, et al. Insights into the solution structure of human deoxyhemoglobin in the absence and presence of an allosteric effector. Biochemistry. 2007;46:9973–9980. | ||
Oksenberg D, Dufu K, Patel MP, et al. GBT440 Increases haemoglobin oxygen affinity, reduces sickling and prolongs RBC half-life in a murine model of sickle cell disease. Br J Haematol. 2016;175:141–153. | ||
Safo MK, Kato GJ. Therapeutic strategies to alter the oxygen affinity of sickle hemoglobin. Hematol Oncol Clin North Am. 2014;28:217–231. | ||
Geng X, Dufu K, Hutchaleelaha A, et al. Increased hemoglobin–oxygen affinity ameliorates bleomycin-induced hypoxemia and pulmonary fibrosis. Physiol Rep. 2016;4(17):e12965. | ||
Dufu K, Yalcin O, Ao-ieong ES, et al. GBT1118, a potent allosteric modifier of hemoglobin oxygen affinity increases tolerance to severe hypoxia in mice. Am J Physiol – Hear Circ Physiol. 2017;313(2):H381–H391. | ||
Amorino GP, Lee H, Holburn GE, et al. Enhancement of tumor oxygenation and radiation response by the allosteric effector of hemoglobin, RSR13. Radiat Res. 2001;156:294–300. | ||
Kister J, Wajcman H. Oxygen equilibrium measurements of human red blood cells. Methods Mol Med. 2003;82:49–64. | ||
Guarnone R, Centenara E, Barosi G. Performance characteristics of hemox-analyzer for assessment of the hemoglobin dissociation curve. Haematologica. 1995;80:426. | ||
Nakagawa A, Lui FE, Wassaf D, et al. Identification of a small molecule that increases hemoglobin oxygen affinity and reduces SS erythrocyte sickling. ACS Chem Biol. 2014;9(10):2318–2325. | ||
Metcalf B, Chuang C, Dufu K, et al. Discovery of GBT440, an orally bioavailable R state stabilizer of sickle cell hemoglobin. ACS Med Chem Lett. 2017;8(3):321–326. | ||
Goldberg MA, Husson MA, Bunn HF. Participation of hemoglobins A and F in polymerization of aickle hemoglobin. J Biol Chem. 1977;252:3414–3421. | ||
Arisaka F, Nagai Y, Nagai M. Dimer-tetramer association equilibria of human adult hemoglobin and its mutants as observed by analytical ultracentrifugation. Methods. 2011;54:175–180. | ||
Griffon N, Baudin V, Dieryck W, et al. Tetramer-dimer equilibrium of oxyhemoglobin mutants determined from auto-oxidation rates. Protein Sci. 1998;7:673–680. | ||
Fylaktakidou KC, Lehn JM, Greferath R, Nicolau C. Inositol tripyrophosphate: a new membrane permeant allosteric effector of haemoglobin. Bioorg Med Chem Lett. 2005;15:1605–1608. | ||
Jensen FB. Red blood cell pH, the bohr effect, and other oxygenation-linked phenomena in blood O2 and CO2 transport. Acta Physiol Scand. 2004;182:215–227. | ||
Kavanagh BD, Khandelwal SR, Schmidt-Ullrich RK, et al. A Phase I study of RSR13, a radiation-enhancing hemoglobin modifier: tolerance of repeated intravenous doses and correlation of pharmacokinetics with pharmacodynamics. Int J Radiat Oncol Biol Phys. 2001;49:1133–1139. | ||
Rolan PE, Parker JE, Gray SJ, et al. The pharmacokinetics, tolerability and pharmacodynamics of tucaresol (589C80; 4[2-Formyl-3-Hydroxyphenoxymethyl] benzoic acid), a potential anti-sickling agent, following oral administration to healthy subjects. Br J Clin Pharmacol. 1993;35:419–425. | ||
Lehrer-Graiwer J, Howard J, Hemmaway CJ, et al. GBT440, a potent anti-sickling hemoglobin modifier reduces hemolysis, improves anemia and nearly eliminates sickle cells in peripheral blood of patients with sickle cell disease. Blood. 2015;126:542. | ||
Rolan PE, Mercer AJ, Wootton R, Posner J. Pharmacokinetics and pharmacodynamics of tucaresol, an antisickling agent, in healthy volunteers. Br J Clin Pharmacol. 1995;39:375–380. | ||
Aprahamian M, Bour G, Akladios CY, et al. Myo-InositolTrisPyroPhosphate treatment leads to HIF-1α suppression and eradication of early hepatoma tumors in rats. ChemBioChem. 2011;12:777–783. | ||
Raykov Z, Grekova SP, Bour G, et al. Myo-inositol trispyrophosphate-mediated hypoxia reversion controls pancreatic cancer in rodents and enhances gemcitabine efficacy. Int J Cancer. 2014;134:2572–2582. |
 © 2018 The Author(s). This work is published and licensed by Dove Medical Press Limited. The
full terms of this license are available at https://www.dovepress.com/terms
and incorporate the Creative Commons Attribution
- Non Commercial (unported, 3.0) License.
By accessing the work you hereby accept the Terms. Non-commercial uses of the work are permitted
without any further permission from Dove Medical Press Limited, provided the work is properly
attributed. For permission for commercial use of this work, please see paragraphs 4.2 and 5 of our Terms.
© 2018 The Author(s). This work is published and licensed by Dove Medical Press Limited. The
full terms of this license are available at https://www.dovepress.com/terms
and incorporate the Creative Commons Attribution
- Non Commercial (unported, 3.0) License.
By accessing the work you hereby accept the Terms. Non-commercial uses of the work are permitted
without any further permission from Dove Medical Press Limited, provided the work is properly
attributed. For permission for commercial use of this work, please see paragraphs 4.2 and 5 of our Terms.