Back to Journals » Clinical Epidemiology » Volume 10
Development and validation of a risk prediction model for severe hypoglycemia in adult patients with type 2 diabetes: a nationwide population-based cohort study
Authors Han K, Yun JS, Park YM ![]() , Ahn YB, Cho JH, Cha SA, Ko SH
, Ahn YB, Cho JH, Cha SA, Ko SH
Received 31 March 2018
Accepted for publication 26 July 2018
Published 23 October 2018 Volume 2018:10 Pages 1545—1559
DOI https://doi.org/10.2147/CLEP.S169835
Checked for plagiarism Yes
Review by Single anonymous peer review
Peer reviewer comments 5
Editor who approved publication: Professor Irene Petersen
Kyungdo Han,1,* Jae-Seung Yun,2,* Yong-Moon Park,3 Yu-Bae Ahn,2 Jae-Hyoung Cho,2 Seon-Ah Cha,2 Seung-Hyun Ko2
1Department of Biostatistics, The Catholic University of Korea, Seoul, Republic of Korea; 2Division of Endocrinology and Metabolism, Department of Internal Medicine, St. Vincent’s Hospital, College of Medicine, The Catholic University of Korea, Seoul, Republic of Korea; 3Epidemiology Branch, National Institute of Environmental Health Sciences, National Institutes of Health, Research Triangle Park, NC, USA
*These authors contributed equally to this work
Purpose: There is a scarcity of long-term prediction models for severe hypoglycemia (SH) in subjects with type 2 diabetes mellitus (T2DM). In this study, a model was developed and validated to predict the risk of SH in adult patients with T2DM.
Patients and methods: Baseline and follow-up data from patients with T2DM who received health evaluations from January 1, 2009, to December 31, 2010 (n=1,676,885) were analyzed as development (n=1,173,820) and validation (n=503,065) cohorts using the National Health Insurance Database (DB) in Korea. New SH episodes were identified using ICD-10 codes. A Cox proportional hazards regression model and Cox model coefficients were used to derive a risk scoring system, and 14 predictive variables were selected. A risk score nomogram based on the risk prediction model was created to estimate the 1-year risk of SH.
Results: In the development cohort, a total of 5,325 (0.45%) patients experienced SH episodes during the follow-up period. After multivariable adjustment, older age, female sex, current smoker, drinking, low body mass index, lack of exercise, previous SH events, insulin or multiple oral hypoglycemic agent use, presence of hypertension or chronic kidney disease, longer duration of diabetes, low or high glucose level, and high Charlson Comorbidity Index score were found to be significant risk factors for the development of SH and were incorporated into the risk model. The concordance indices were 0.871 (95% confidence interval, 0.863–0.881) in development cohort and 0.866 (95% CI, 0.856–0.879) in the validation cohort. The calibration plot showed a nearly 45° line, which indicates that this model predicts well an absolute SH event.
Conclusion: This 14-variable prediction model for SH events may be a useful tool to identify high-risk patients and guide prevention of SH in adult patients with T2DM.
Keywords: type 2 diabetes, severe hypoglycemia, risk model, risk prediction
Introduction
Many large epidemiological studies have emphasized that glycemic control with the HbA1c target <7% is the best strategy for the prevention of diabetes-related vascular complications.1 International practice guidelines recommend that various classes of antidiabetic medications, along with lifestyle modifications, should be initiated to achieve glycemic goals.2,3 In addition, a stepwise combination and intensification of medications are recommended for proper glycemic control in the updated guidelines. However, intensive glycemic control with antidiabetic medications or insulin injections can increase the risk of macrovascular events and mortality in patients with comorbidities and can be accompanied by the risk of hypoglycemia in patients with type 2 diabetes mellitus (T2DM).4,5
Hypoglycemia associated with antidiabetic drugs is a major barrier in diabetes treatment.6 It is categorized as mild if it is self-limiting and severe if it requires external assistance for recovery.7 Only a small fraction of patients with T2DM with glycemic control experience severe hypoglycemia (SH) episodes. One US study suggested that the age- and sex-standardized rate of SH was 1.3 events per 100 person-years in 2013, and a UK retrospective study showed that admission for hypoglycemia was 72.3 per 100,000 total hospital admissions in 2013–2014.8,9 However, the outcome of an SH event can be serious. Hypoglycemia, regardless of severity, is clinically important not only due to its association with increased cardiovascular disease (CVD) and cardiovascular (CV) mortality but also first and foremost due to the risk of loss of consciousness, falls, seizures, motor vehicle accidents, other injuries, and possible coma and death.10 Meta-analyses and large clinical studies have demonstrated that SH is significantly associated with a higher risk of CVD and an increased risk of all-cause and CV mortality in patients with T2DM.11–13 Although the causal relationship between SH and CVD or CV death has not been clearly elucidated, SH has the potential to trigger fatal arrhythmic events by more than one mechanism in patients with a high CV risk.14,15 Therefore, methods to identify high-risk groups and interventions to prevent SH events are urgently needed. An accurate prediction model for SH would be very helpful for this purpose. Despite the clinical importance of a prediction model, there is a scarcity of currently available long-term prediction models for SH in T2DM.
In Korea, the national health care program operated by the Ministry of Health and Welfare, called the National Health Insurance Service (NHIS), covers the entire Korean population through a social insurance benefits system.16 The computerized database (DB) includes all of the national health examination DBs, claims DBs, and information on drug prescriptions using the ICD-10 coding system.16,17 From this DB, we can sort out claims and national health examination data for patients with T2DM within a certain time period and obtain subsequent specific clinical outcome results during follow-up.
The aim of this study was to create development and validation cohorts and to develop an SH risk prediction model in adult patients with T2DM using the NHIS DB in Korea. To the best of our knowledge, the present study is the first long-term risk prediction tool for identifying individuals at high-risk for SH in a large number of subjects with T2DM.
Patients and methods
DB source
In this retrospective cohort study, we used the NHIS DB maintained by the Korean NHIS, a government-affiliated agency under the Korean Ministry of Health and Welfare that supervises all medical services in Korea. All Korean citizens are encouraged to receive regular biannual or pre-employment health evaluations provided by the NHIS. This regular health evaluation includes assessments of anthropometric measurements, blood pressure, social history, physical activity levels, and laboratory tests after overnight fasting, including serum glucose, total cholesterol, creatinine, liver function, and urinalysis. Quality control procedures for laboratory tests are performed in accordance with the Korean Association of Laboratory Quality Control.17 Medical history and alcohol, smoking, and exercise habits are collected by standardized self-reporting questionnaires. Additionally, the NHIS has information on patients’ demographics, medication use, transaction information, healthcare evaluations, and the claims DB.16,17
This study was based on data from NHIS which were fully anonymized and de-identified for the analysis. This study was approved by the institutional review board of the Catholic University of Korea (VC17RESI-0160). The study was conducted in compliance with the Declaration of Helsinki.
Eligibility criteria and definition of T2DM
Among all NHI beneficiaries, the source population for this study consisted of patients who visited clinics or hospitals from January 1, 2009 to December 31, 2010. Screening rates of national health examination between 2009 and 2010 was 54.2% of total population aged over 30 years. Patients were classified as having T2DM 1) when they had at least one service claim with a diagnosis of T2DM based on ICD-10 (E11–14) in the outpatient or inpatient setting and were prescribed at least one antidiabetic drug (metformin, sulfonylureas, alpha-glucosidase inhibitors, meglitinides, dipeptidyl peptidase-4 (DPP-4) inhibitors, thiazolidinediones, and any type of insulin) at any time over 1 year to exclude prediabetic or non-diabetic individuals or 2) when they showed fasting plasma glucose ≥7.0 mmol/L during health examinations (newly diagnosed diabetes).16–18 We excluded duplicate individuals who underwent multiple health examinations in consecutive years.
The inclusion criteria for patients with T2DM were as follows: 1) ≥30 years old; 2) received health evaluations between January 1, 2009, and December 31, 2010. Patients with T1DM, with gestational diabetes, or with missing data were excluded. The number of excluded participants due to missing data for each variable was as follows: current smoker, 6,615 (0.4% of total subjects); alcohol consumption, 20,791 (1.2%); exercise, 7,684 (0.4%); hypertension, 2,486 (0.1%); total cholesterol, 2,279 (0.1%); body mass index (BMI), 2,101 (0.1%), and estimated glomerular filtration rate (GFR), 1,859 (0.1%), and missing data of the other variables were all included in excluded data (Figure S1). Among the participants who had received a national health examination between January 1, 2009 and December 31, 2010 (n=1,934,024), 1,676,885 patients with T2DM were enrolled in this study (Figure S1), and whether they experienced SH episodes within the 3 years before the date of the current health examination (January 1, 2006 to December 31, 2008) was identified (Figure S2). The claims DBs were followed until December 31, 2011, to evaluate the occurrence of SH among the included participants.
Cohort development
The development and validation data sets were formed by splitting the original cohort DB into two data sets. For the development cohort, 70% of the eligible subjects were sampled from the DB from January 1, 2009 to December 31, 2010. A total of 1,173,820 individuals with T2DM were finally selected. For the internal validation cohort, 503,065 subjects with T2DM (the remaining 30% of the total eligible subjects in the DB) were extracted from the same DB according to the Harrell’s bootstrap resampling method (Figure S1).
SH event assessment as an outcome
Generally, SH was defined as any hypoglycemic event requiring the assistance of another person to actively administer carbohydrates or other corrective actions, hospitalization, or medical care.17 It also includes hypoglycemia associated with severe cognitive impairment requiring external assistance for recovery. Due to the limitation of the claims DB, from which glucose concentrations during SH events could not be confirmed, we used the ICD-10 codes for SH (E16.x, E11.63, E13.63, E14.63) in the enrolled patients with T2DM from the claims DB records of hospitalizations, clinic visits, or emergency room for 1 year from the index date.19,20 Only the first SH episode within the observation period was included. We searched for participants who had experienced at least one SH episode according to ICD-10 codes within the 3 years prior to the date of the current health examination.
Predictor variables
All the available values were extracted from the NHIS DB. Demographic information and personal clinical information were obtained, including age, sex, BMI, and socioeconomic status as quartile income status. Age range was divided into three groups (<40, 40–64, and ≥65 years) according to the logistic regression results to simplify the risk model. We also classified the subjects by BMI into five groups according to the BMI category of WHO recommendations for Asians (<18.5, 18.5–22.9, 23.0–24.9, 25.0–29.9, and ≥30 kg/m2) and fasting glucose levels into six groups (<5.6, 5.6–6.9, 7.0–8.2, 8.3–9.9, 10.0–11.6, and ≥11.7 mmol/L). Heavy drinking was defined as alcohol consumption ≥30 g/day, and physical activity was defined as 30 minutes of moderate exercise ≥5 days/week or 20 minutes of vigorous exercise 3 days/week. Current smoking status and lifestyle habits were determined by self-reported questionnaires. Hypertension was defined by the ICD-10 codes of I10-I13 and I15 and treatment with anti-hypertensive agents or systolic or diastolic blood pressure ≥140 and ≥90 mmHg, respectively. Dyslipidemia was defined by the ICD-10 code of E78 and treatment with lipid-lowering agents or total cholesterol ≥6.2 mmol/L.15 Duration of diabetes was categorized as <5 years and ≥5 years using the date of the first claim in the pair as the index date. Laboratory parameters were measured after an overnight fast. Estimated GFR (eGFR) was calculated from serum creatinine using the Modification of Diet in Renal Disease Study Group equation.21 Chronic kidney disease (CKD) was defined as an eGFR <60 mL/min/1.73 m2.22
We identified potential risk factors for SH based on the literature10,20 and selected variables that were most likely to have good predictive abilities.23 We finally considered the following 14 candidate predictors: age, sex, current smoking, BMI, exercise, alcohol consumption, insulin or multiple oral hypoglycemic agent (OHA) use, Charlson Comorbidity Index score, hypertension, CKD, previous SH history within the past 3 years, duration of diabetes, and fasting glucose level.
The primary outcome was newly diagnosed SH after the health examination, including diagnosis (ICD-10 code of SH) during hospitalization, in the emergency room, or in the outpatient clinics or until censored by death.24
Statistical analysis
Statistical analyses were performed using SAS version 9.4 (SAS Institute Inc., Cary, NC, USA). Descriptive statistics are presented as means ± SD or 95% CIs. Data are also expressed as numbers and frequencies as percentages (%). Chi-squared test was used to determine the differences in the proportion of categorical variables, and independent Student’s t-tests were conducted to evaluate the differences between the means of two continuous variables. Incidence rates are expressed as events per 1,000 patient-years.
A Cox proportional hazards regression model was used to estimate the hazard ratio (HR) and corresponding 95% CI to predict the study outcome (SH). Variable selection to build the risk prediction model was conducted using the multivariate model. We identified potential risk factors for SH based on the literature and also selected variables that were most likely to have good predictive ability in our model. The coefficients from the fitted Cox model were used to develop an interactive web-based tool that calculates the predictions automatically (available from http://md.koobian.com/sh/index.html). The proportional hazards assumption was evaluated by Schoenfeld residuals with the logarithm of the cumulative hazards function based on Kaplan–Meier curves. We assigned risk scores based on the HR for each risk factor in the final Cox hazard regression model. Each of the 14 variables, including age, sex, current smoking, drinking, BMI, exercise status, insulin use, presence of hypertension or CKD, previous SH events within the past 3 years, duration of diabetes, number of OHA classes taken, fasting glucose level category, and Charlson Comorbidity Index score was applied with scores of 0–100. Each variable corresponded to a specific point by drawing a line straight up the score axis.
To assess discrimination, receiver operating characteristic (ROC) curves and Harrell C-statistics were compared with the risk prediction model. The C-statistic is a concordance measure analogous to the area under the ROC curve.25 A C-statistic value of 0.5 means a random chance and the usual C-statistic range for a prediction model is 0.60–0.85; a range of 0.80–0.90 is considered excellent.25 Observed and predicted risks of SH at 1 year in the development and validation cohorts were compared by ranking subjects into deciles of predicted risk. Calibration was also assessed using the quintiles of the predicted SH event at 1 year and calculation of the corresponding observed Kaplan–Meier estimates.
The χ2 statistic was calculated by first dividing the data into deciles based on the predicted probabilities produced by the model in ascending order. Then, the average predicted probabilities were compared with the actual event rate estimated by the Kaplan–Meier approach in each decile. We did not need to consider missing data during the follow-up because all the claims details from the medical institutions and death certificates (censoring by death) for the participants were monitored using the DBs.
The risk prediction model for SH was translated into a risk score nomogram.26 A two-sided P-value <0.05 was considered statistically significant, and all analyses were performed using complete data only.
Results
Clinical characteristics of the study population in the development cohort
From January 1, 2009, to December 31, 2010, 1,676,885 participants with T2DM were included in this study after exclusion. At baseline, the mean age was 57.9±12.1 years, and 39.9% of the patients were female in the development cohort. During the follow-up period of 1.0 years, 5,325 individuals (0.45% of the total patients with T2DM) had a newly identified SH event. Compared with the patients without SH events, patients with SH events were older, had a lower BMI (23.6±3.5 vs 25.0±3.3 kg/m2), and were more likely to be female than male (51.7% vs 39.7%), have hypertension (77.8% vs 57.7%), be on insulin treatment (41.6% vs 8.6%), be taking multiple classes of OHAs (72.3% vs 43.9%), have had diabetes for a duration of ≥5 years (67.8% vs 33.8%), have higher Charlson Comorbidity Index score (score over 6 points: 36.2% vs score 0 or 1 point: 8.1%), and have a previous history of an SH event (4.4% vs 0.1%) (Table 1). The age- and sex-adjusted HRs and HRs for all 14 variables for the model are presented (Table 2). The age- and sex-adjusted HR for SH in older patients (≥65 years) according to age category was 7.92 (95% CI 7.35–8.53). This significant result persisted after adjusting for age category, sex, exercise level, BMI, smoking and drinking habits, presence of hypertension and CKD, insulin or multiple OHA use, glucose level, recent SH history, a Charlson Comorbidity Index score, and duration of diabetes. The fasting glucose levels, which were categorized into six levels, showed a U-shaped relationship. A BMI <18.5 kg/m2 revealed a higher HR than those of the normal or obese populations. Additionally, female sex (HR 1.07, 95% CI 1.01–1.14), presence of hypertension (HR 1.29, 95% CI 1.21–1.38) or CKD (HR 1.92, 95% CI 1.81–2.04), use of insulin (HR 2.76, 2.60–2.93), use of ≥2 classes of OHAs (HR 1.68, 95% CI 1.52–1.85), ≥2 SH events within the previous 3 years (HR 8.02, 95% CI 7.01–9.19), and duration of diabetes >5 years (HR 1.43, 95% CI 1.35–1.53) were also significant predictive factors for the development of SH after adjustment for all 14 variables (Table 2). A risk score nomogram based on the risk prediction model was created to estimate the 1-year risk of SH (Figure 1, Table S1).
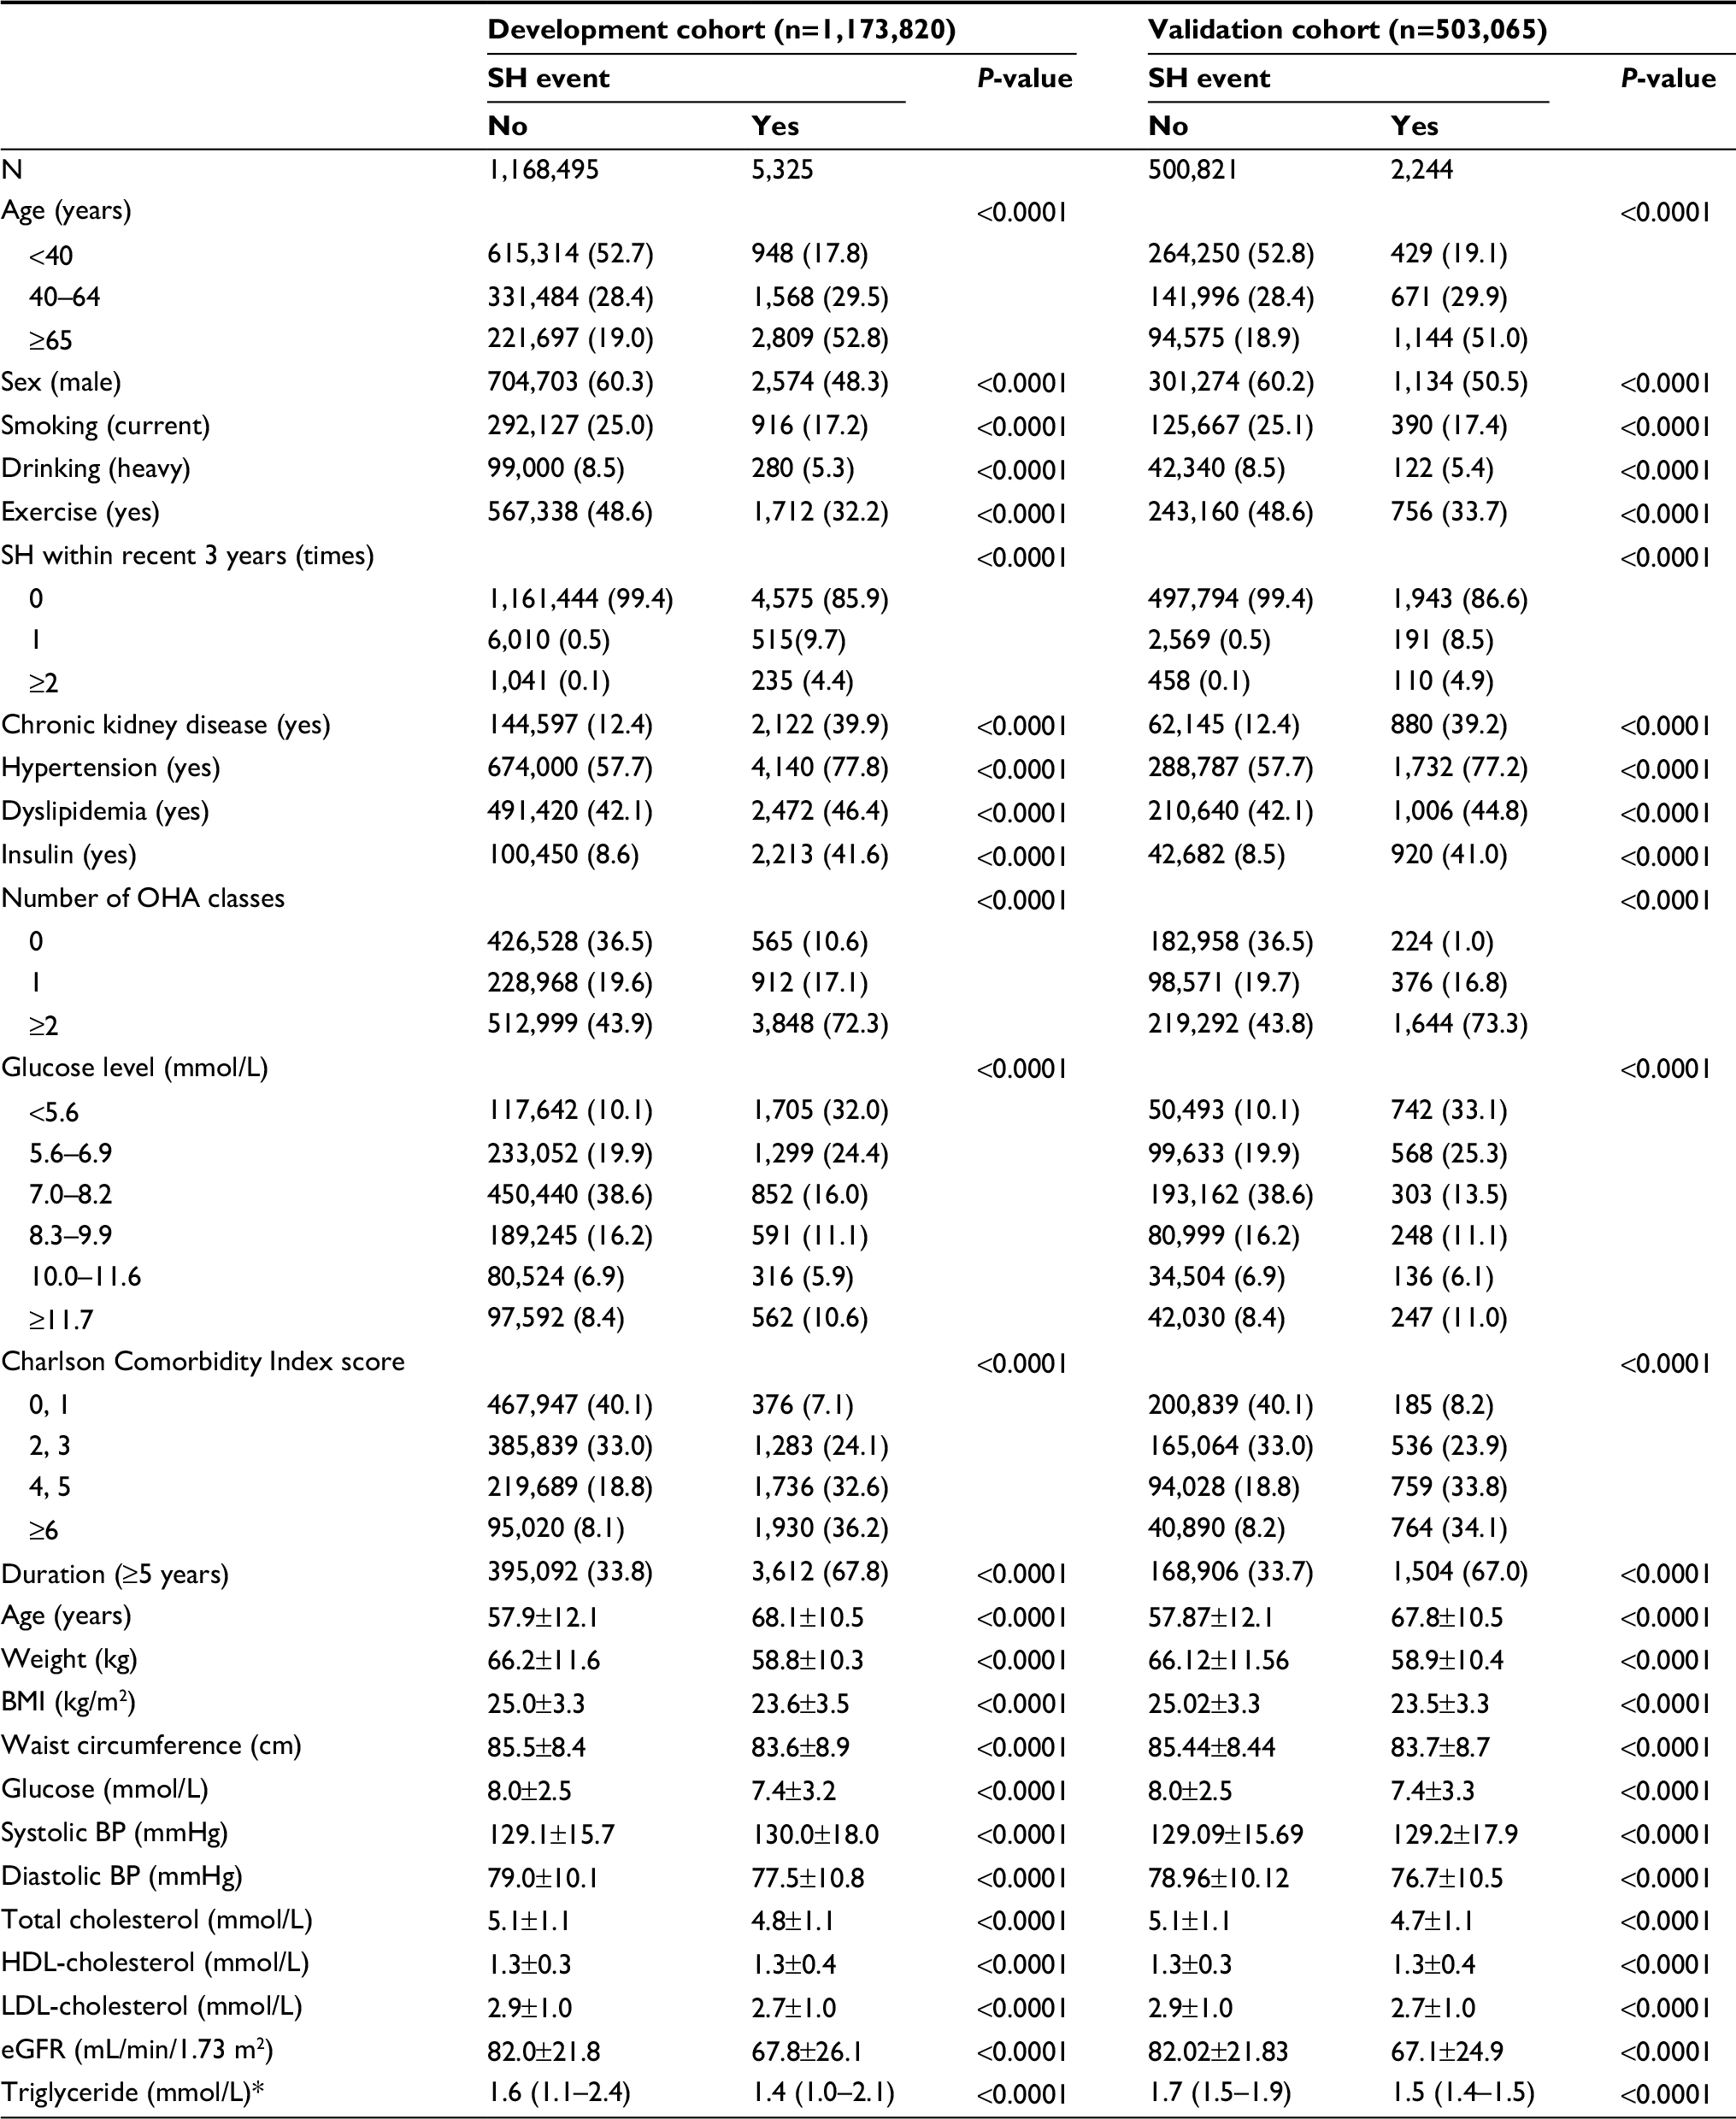 | Table 1 Baseline characteristics of the study participants according to SH events in the development and validation cohorts Note: Data are number (%) or mean ± SD. *Triglyceride, median (25th–75th percentile). Abbreviations: BP, blood pressure; eGFR, estimated glomerular filtration rate; OHA, oral hypoglycemic agents; SH, severe hypoglycemia. |
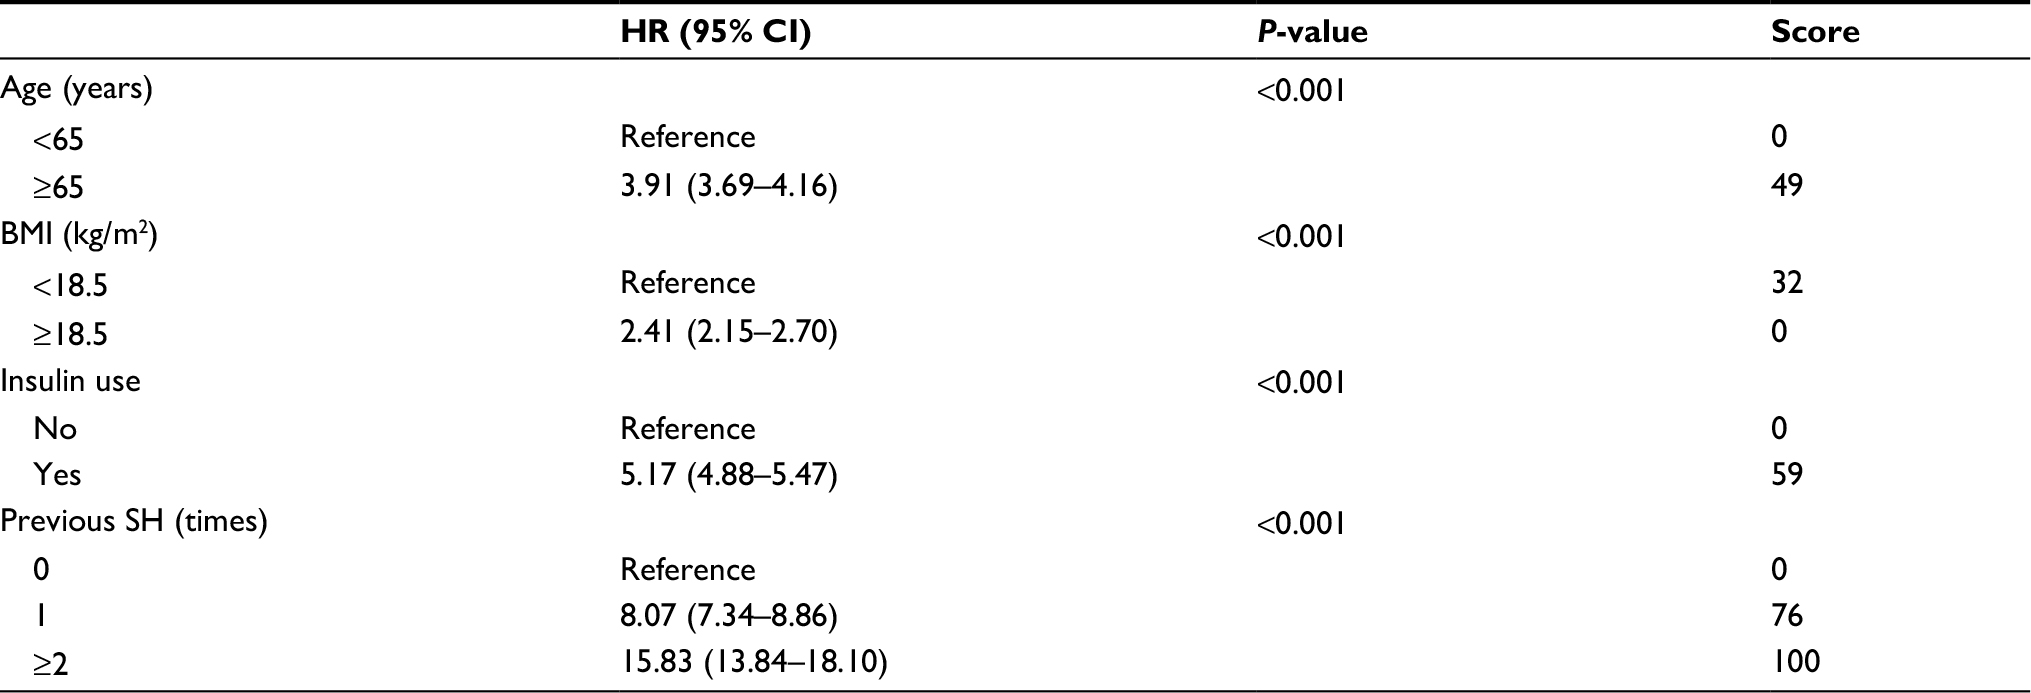
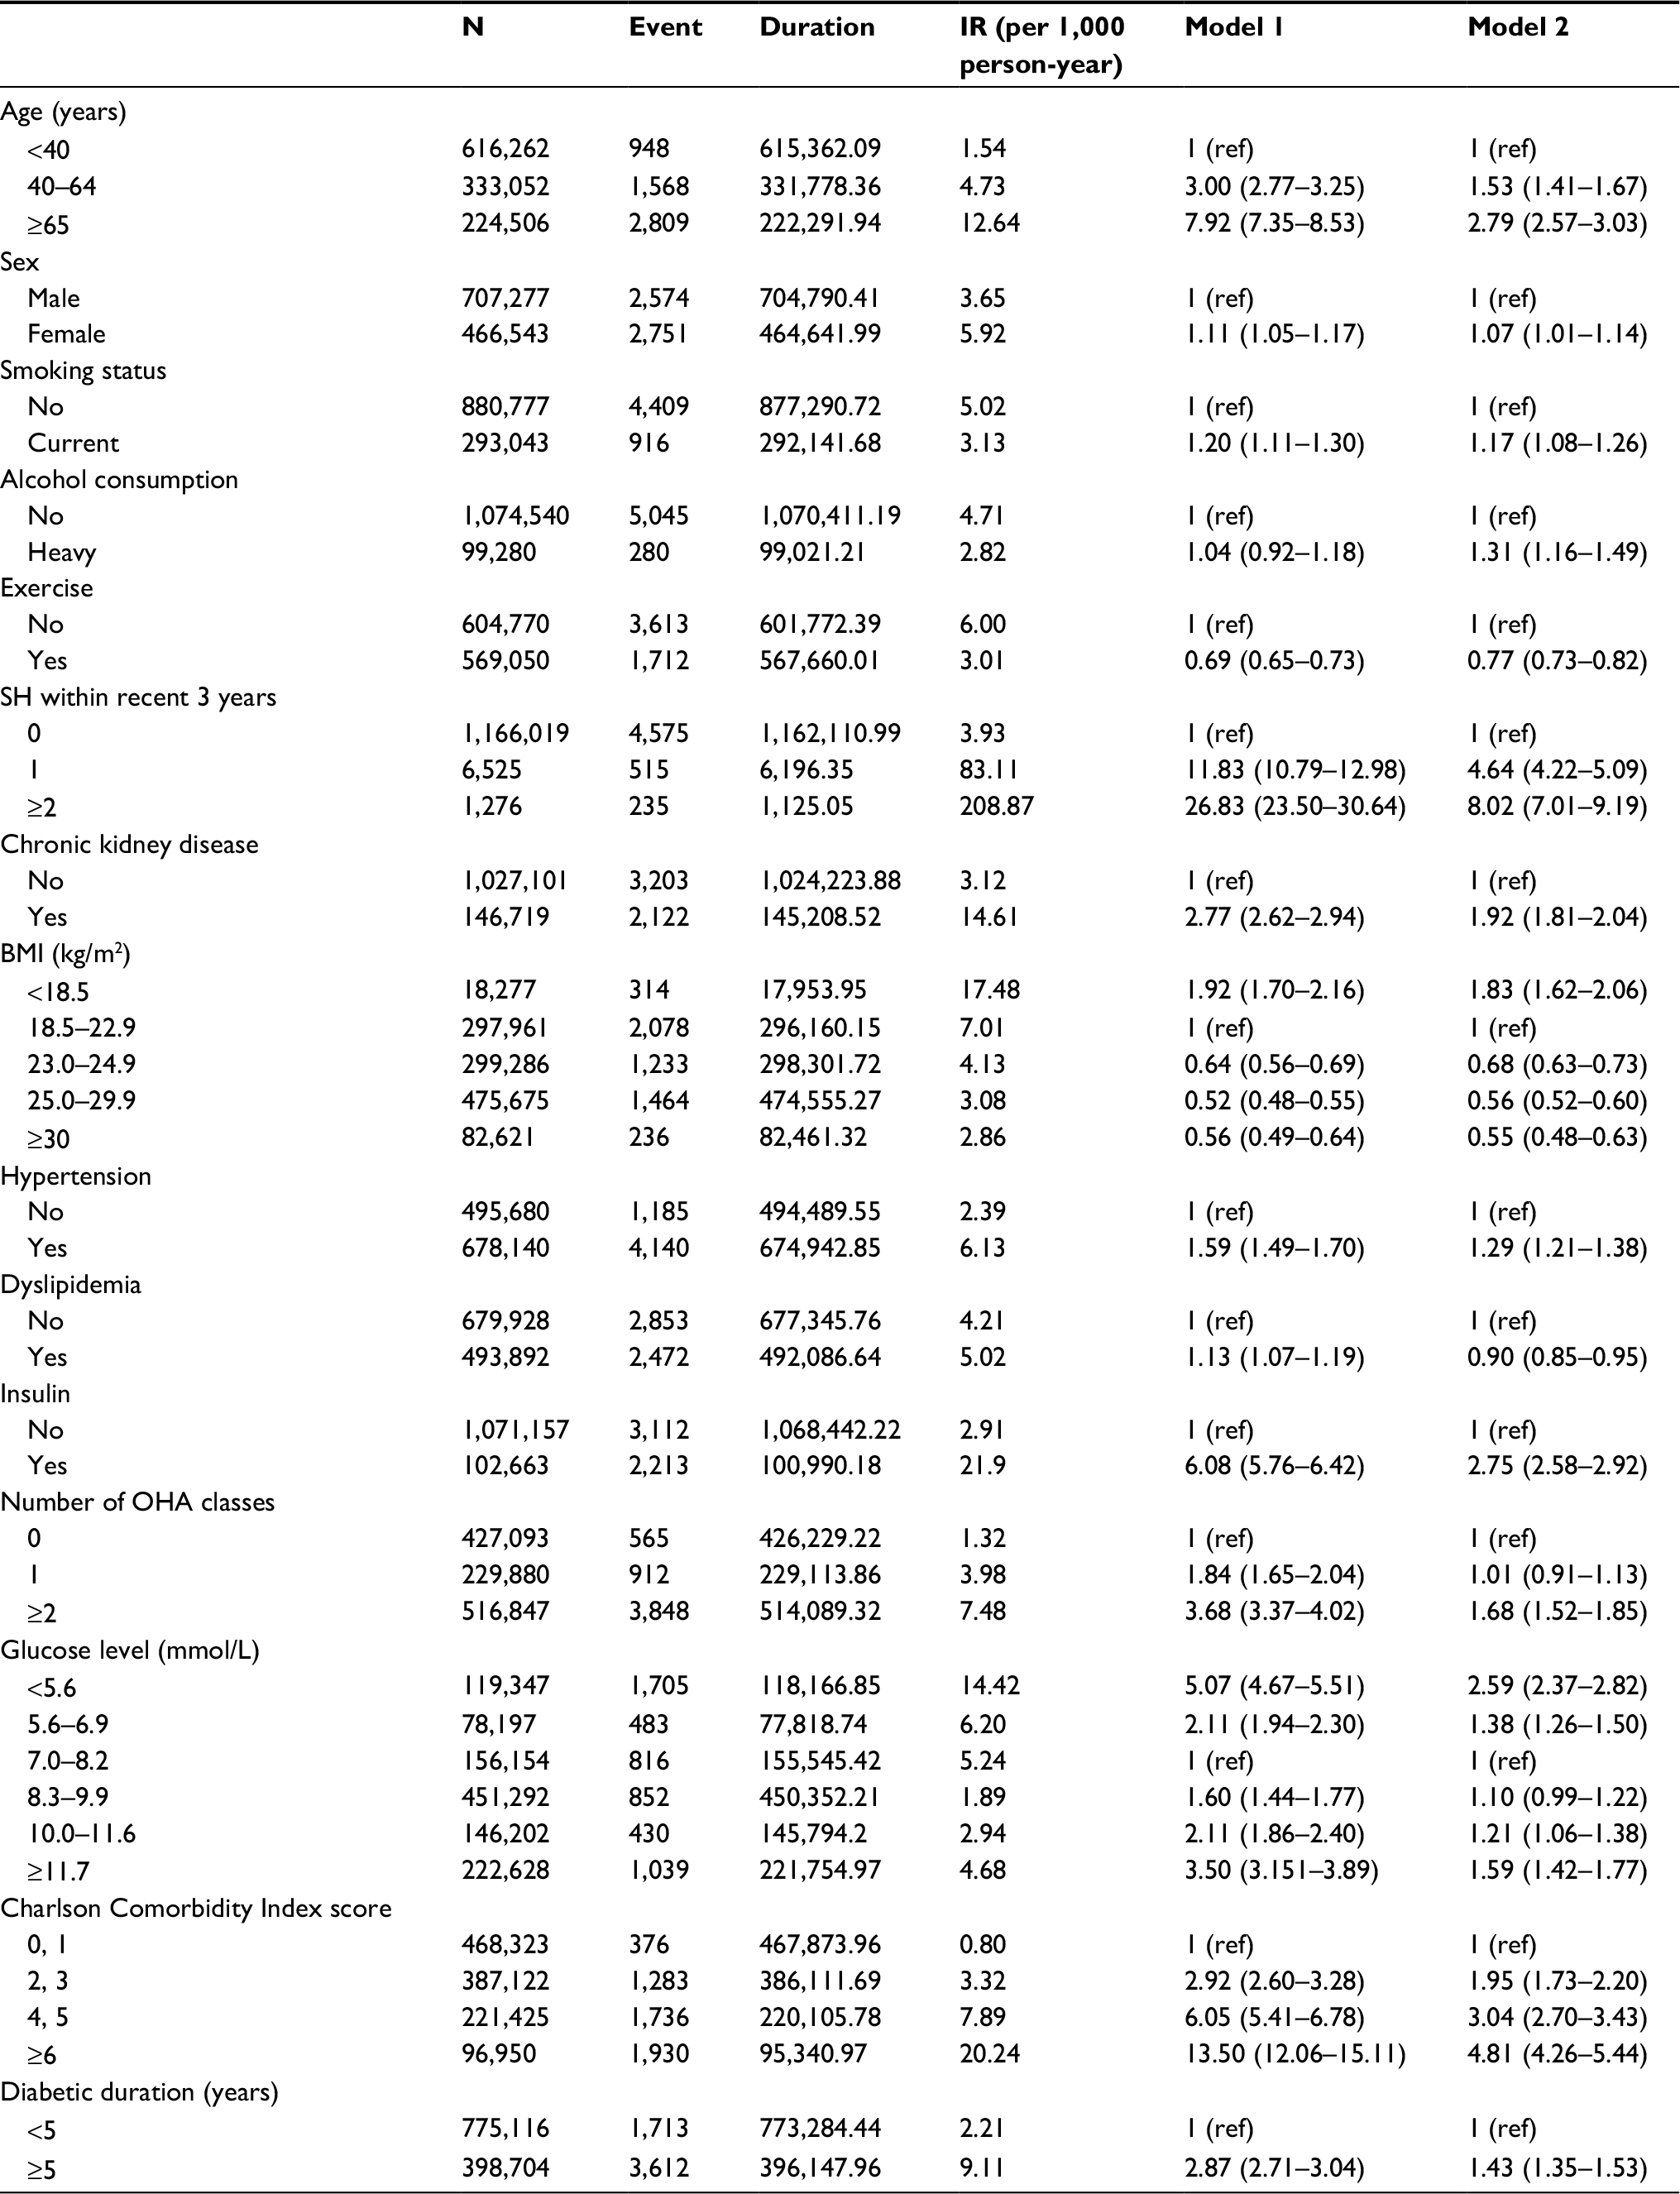 | Table 2 Hazards ratios (95% CIs) for SH events Notes: Data are HRs (95% CI). Model 1: Age category, sex, Model 2: Age category, sex, smoking status, drinking, exercise level, income, CKD, BMI level, hypertension, insulin use, glucose level, diabetic duration, numbers of OHA classes, recent SH events within 3 years. Abbreviations: CKD, chronic kidney disease; IR, incidence rate; OHA, oral hypoglycemic agents; SH, severe hypoglycemia. |
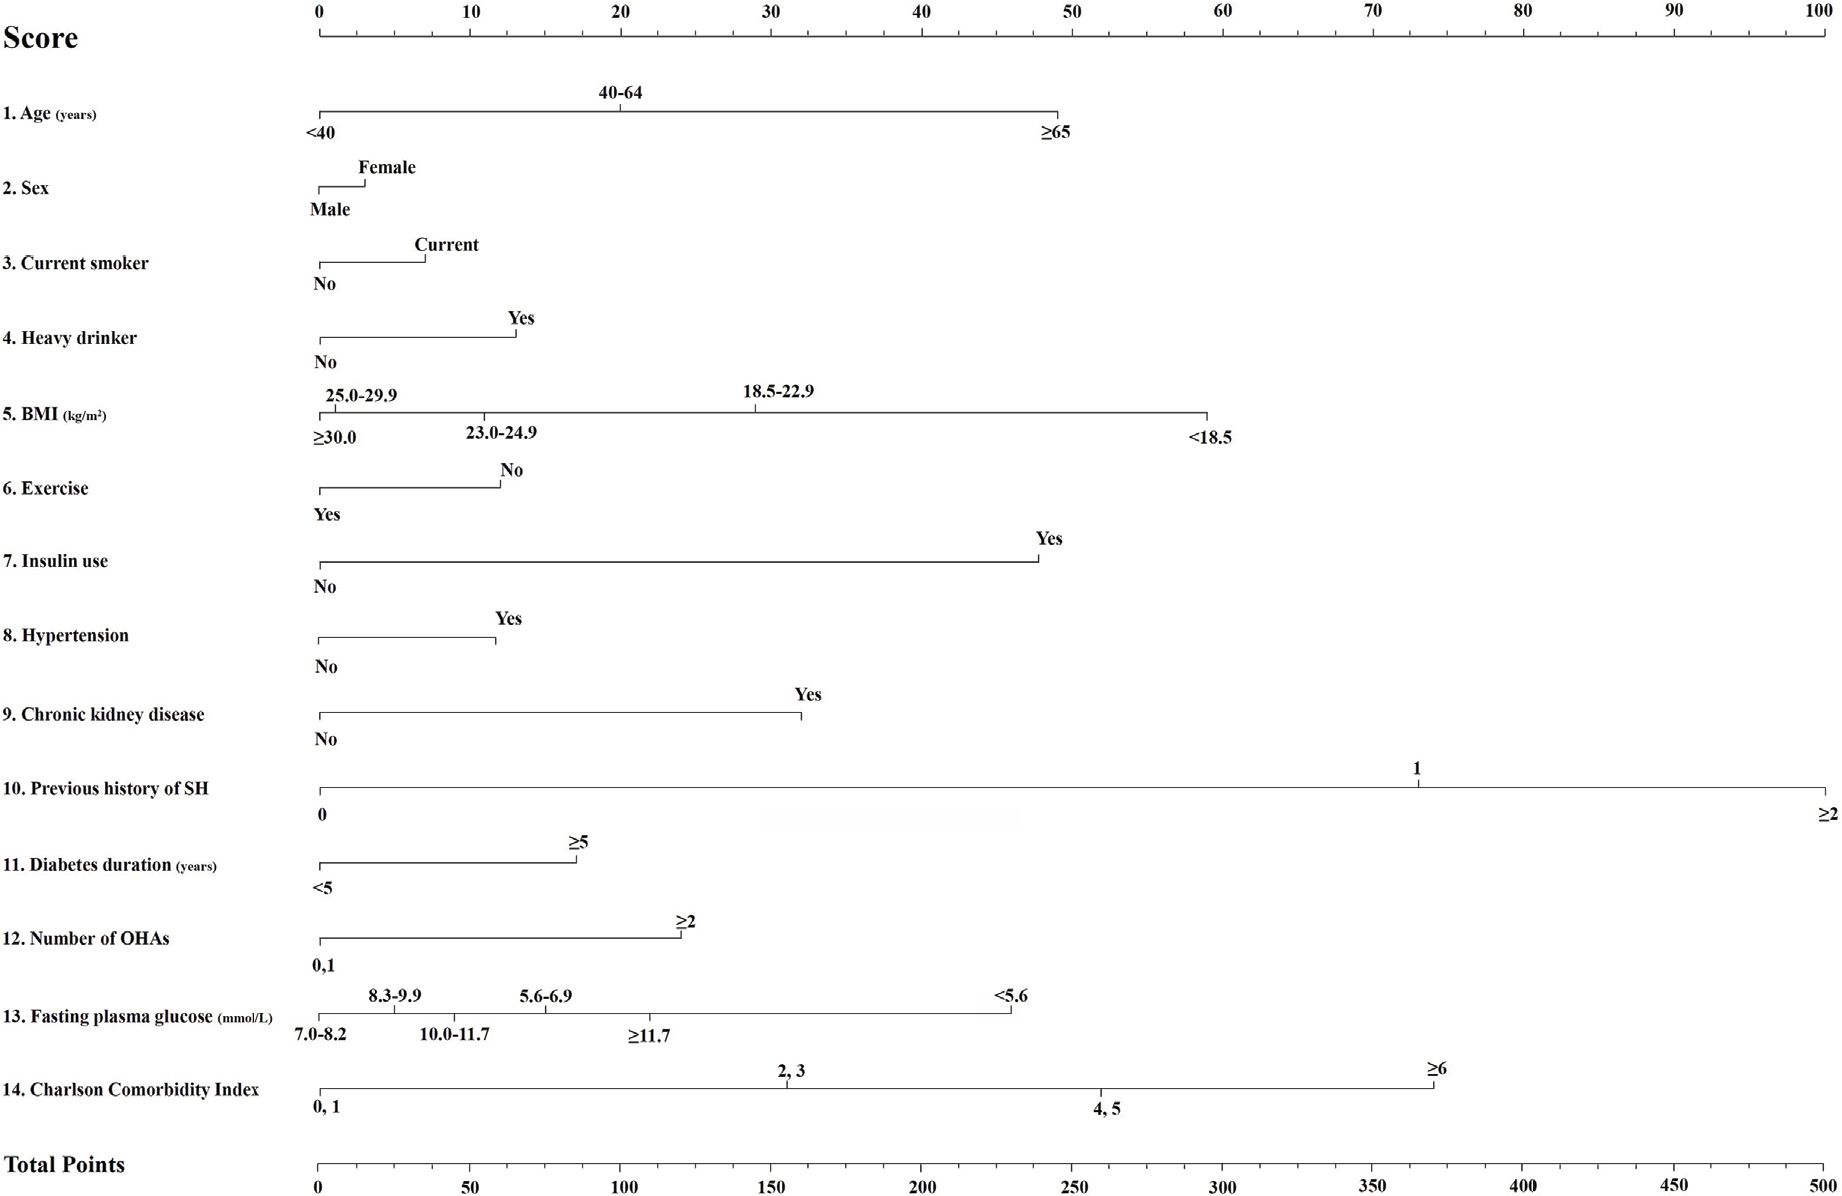 | Figure 1 A nomogram for the prediction of the 1-year probability of severe hypoglycemia (SH). Notes: Each of the 14 variables (age, sex, current smoking, drinking, BMI, exercise status, insulin use, presence of hypertension or chronic kidney disease, previous SH events within the past 3 years, diabetes duration, number of oral hypoglycemic agents, fasting glucose level category, and Charlson Comorbidity Index score) was applied with scores of 0–100. Each variable corresponds to a specific point by drawing a line straight up to the score axis. The total score, which is the sum of the scores for each of the 14 variables at the bottom of the nomogram, ranges from 0 to 495. |
The concordance index for SH prediction was 0.871 (95% CI 0.863–0.881) in the development cohort. The sensitivity and specificity of the model prediction in the development cohort were 0.799 and 0.806, respectively.
Validation cohort of the risk model
The mean age and follow-up period of the validation cohort (n=503,065) were 57.9±12.1 and 1.0 years, respectively. The percentage of female subjects was 39.8%. Among them, 2,244 patients (4.46%) developed SH during the observation period. The clinical characteristics of the validation and development cohorts were similar, including age, BMI, sex ratio, and rate of SH events (Table 1). The concordance index for SH prediction was 0.866 (95% CI 0.856–0.879) in the validation cohort. The sensitivity and specificity of the model prediction in the validation cohort was 0.802 and 0.797. We believe that this prediction model provides accurate risk prediction for SH in patients with T2DM.
Development of scores for SH prediction
The total score, which was the sum of the scores for all 14 variables, ranged from 0 to 495. For example, a woman (3 points) with T2DM aged 60 years (20 points), with no smoking or alcohol habits (0 points each), with a BMI of 22.0 kg/m2 (29 points), with moderate-intensity exercise habits (0 points), with CKD (31 points) and hypertension (12 points), and Charlson Comorbidity Index score of 3 points (31 points), with a duration of diabetes ≥5 years (17 points), with a previous history of one SH event within the past 3 years (73 points) and a fasting glucose level of 122 mg/dL (15 points), and who was treated only with insulin (48 points) would have a total risk score of 279, and her 1-year incidence probability for SH events is estimated to be 5.7% (Figure 2). Interactive web-based platform that calculates the predictions automatically is available (http://md.koobian.com/sh/index.html, Figure S3A and B). If the total score is >400 points, the 1-year SH risk is estimated to be >50%.
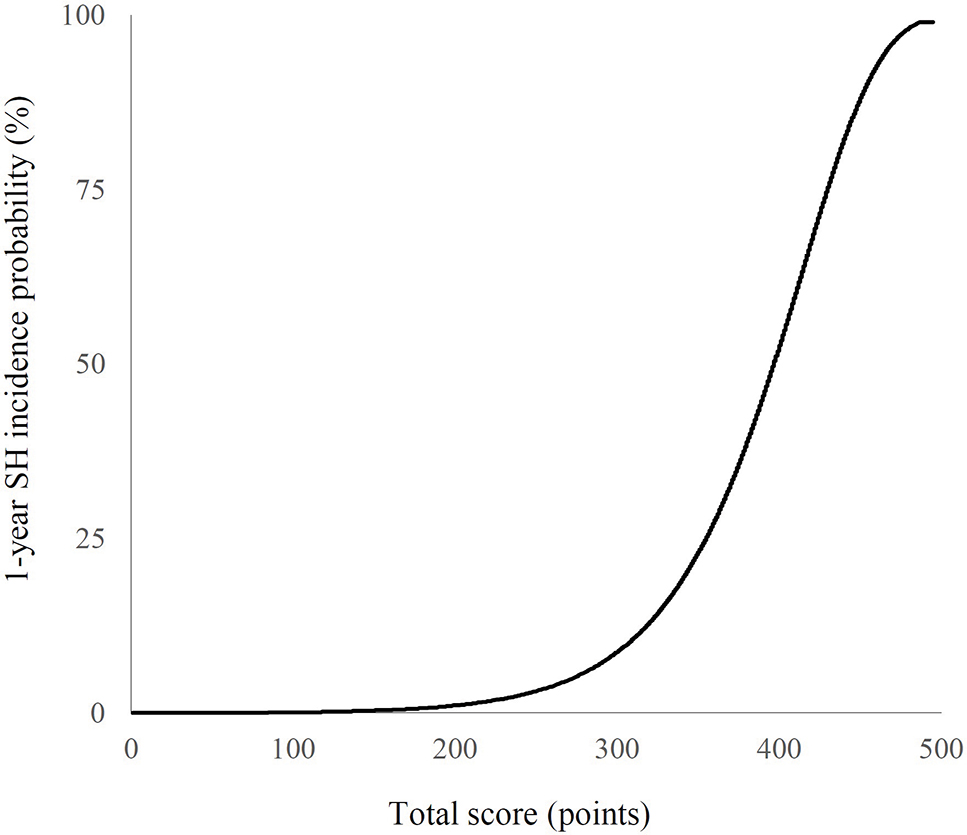 | Figure 2 The 1-year incidence probability of severe hypoglycemia (SH) according to the total score. |
The range of cutoff values according to deciles in the development and validation cohorts is demonstrated in Figure 3. Based on this prediction model, the subjects in the highest decile (total score 192–550) showed an SH incidence rate of 29.38 per 1,000 person-years. To determine how well the tool predicts an absolute outcome, we checked the relationship between the model-derived and actual SH outcome within calibration plots (Figure S4). The dashed line represents the performance of an ideal nomogram, where the predicted outcome would correspond perfectly with the actual outcome. The performance of the created model is plotted as the solid line. The calibration plot showed a nearly 45° line, which indicates that this model predicts an absolute SH event well.
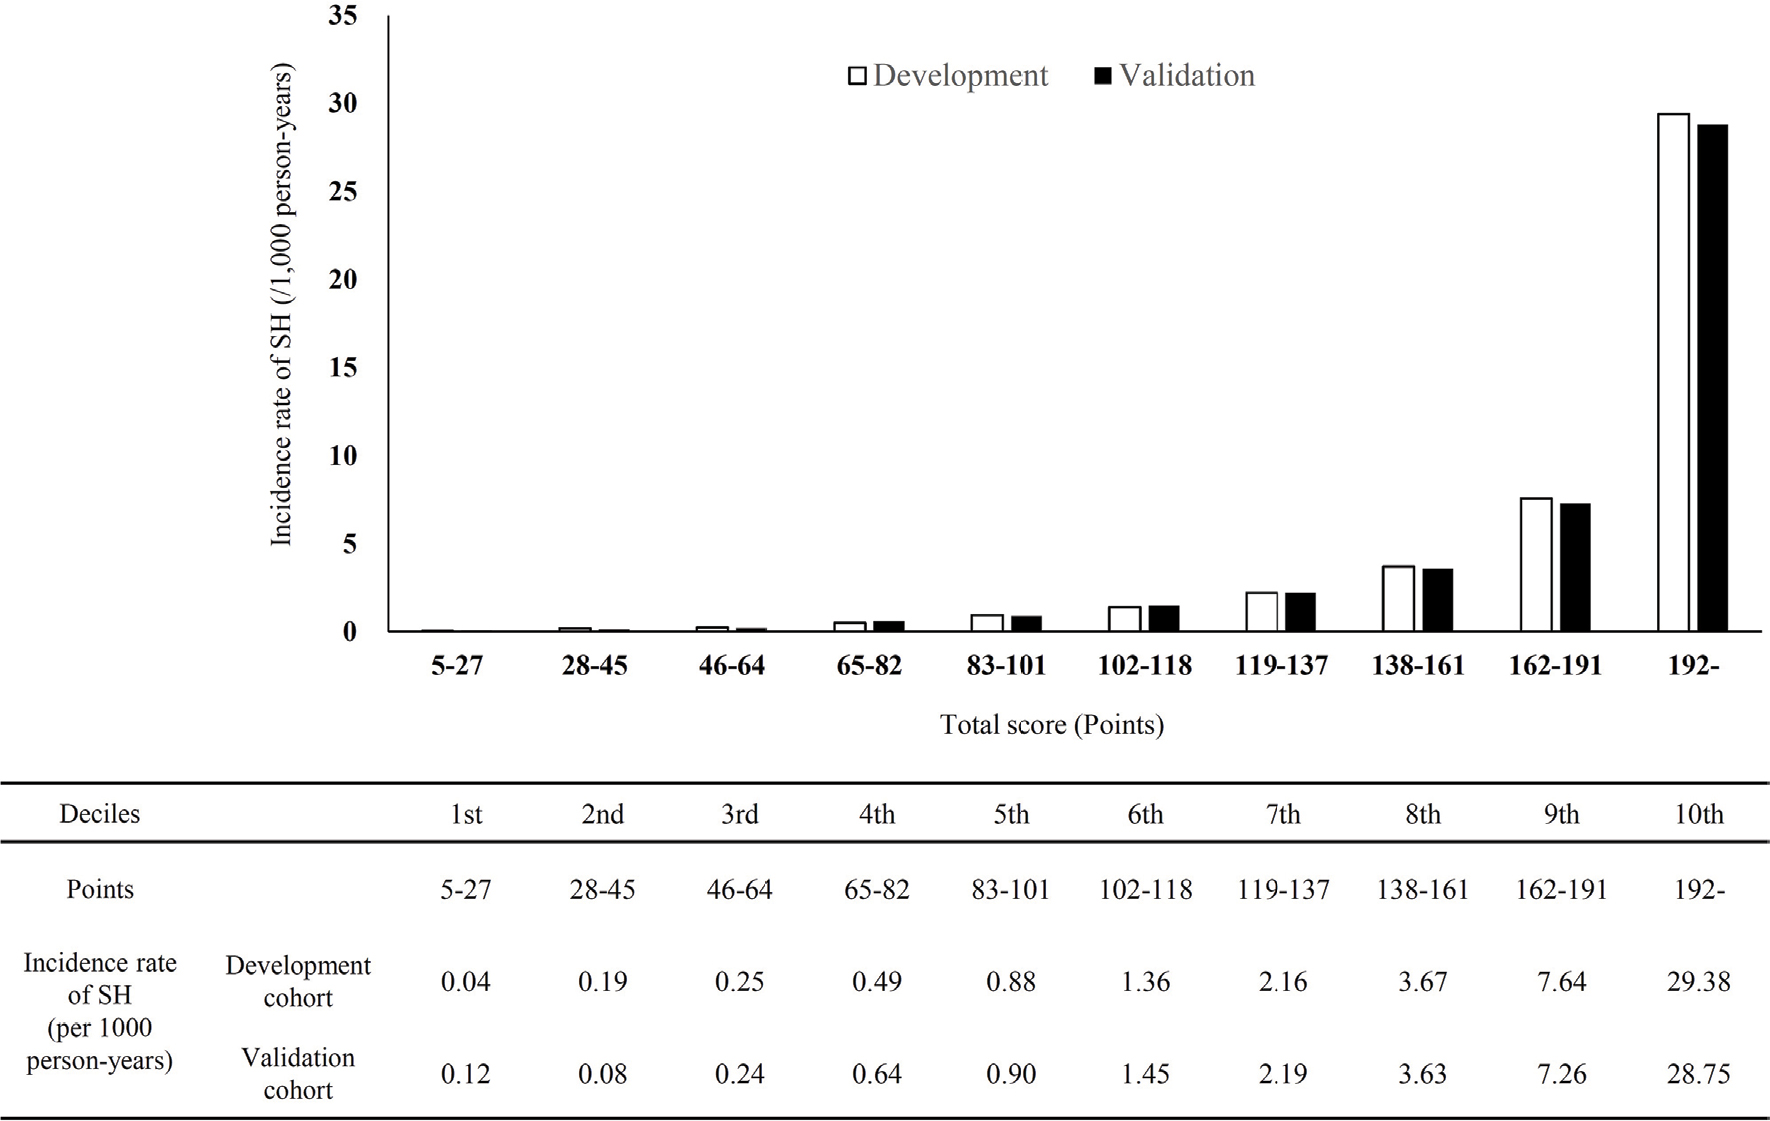 | Figure 3 Predicted incidence rate (per 1,000 person-years) based on the development and validation cohorts. Notes: The x-axis represents the range of scores from the nomogram according to each decile. The y-axis reveals the predicted incidence rate of severe hypoglycemia (SH). |
Among the 14 variables, we found that previous SH events, older age, lower BMI (<18.5 kg/m2), and insulin use mainly contributed significantly to future SH risk. We also created simple prediction model for SH using these four variables (Figure S5; Table S2). The concordance indices of this simple model were 0.827 (95% CI 0.816–0.838) in the development cohort and 0.819 (95% CI 0.810–0.832) in the validation cohort.
Discussion
Using an NHI claims DB in Korea, we developed and validated a simple and useful risk prediction model for SH that can be applied to adult patients with T2DM. To the best of our knowledge, the present study is the first long-term risk prediction tool for identifying high-risk individuals for SH in a large number of patients with T2DM. Our model has good calibration and discrimination, with a C-statistic of 0.871 (95% CI 0.863–0.881). We found that older age, female sex, longer duration of diabetes, low BMI, use of insulin or multiple classes of glucose-lowering medications, current smoker, drinking, lack of exercise, presence of hypertension or CKD, previous SH history, multiple comorbidities, and low or high glucose levels were independently predicted an increased risk of SH in T2DM.
Intensive glycemic control is necessarily accompanied by an increased frequency and severity of hypoglycemic episodes in patients with T2DM. According to the Action in Diabetes and Vascular Disease: Preterax and Diamicron Modified Release Controlled Evaluation (ADVANCE) Collaborative group study, 231 of 11,140 patients with T2DM (2.1%) had at least one SH event during the study period. Moreover, SH was significantly associated with an increased risk of macrovascular complications, adverse clinical outcomes, and all-cause mortality.10,11,27 Therefore, the risks and clinical implications of SH should be considered in the management of T2DM, and accurate prediction and management of the risk factors prior to an SH event are essential for patients with T2DM.
Several risk factors for SH are known from previous studies, such as hypoglycemia unawareness, long duration of diabetes, strict glycemic control, older age, multiple comorbidities, impaired renal function, poor cognitive function, and certain biomarkers (C-peptide and 1,5-anhydroglucitol).20,24,26,28 CKD is also one of the well-known risk factors for SH due to its role in gluconeogenesis and drug clearance.29 Using these meaningful clinical and laboratory variables, a risk prediction model for SH can be built from qualified clinical studies.30
Literature regarding risk prediction models for SH specific to T2DM is extremely rare. Most studies have been performed in a small group of patients with T1DM short-term by self-monitored blood glucose (SMBG) recordings or continuous glucose monitoring system (CGMS).31–33 Prediction of SH using the SMBG recordings in T1DM and T2DM for 4–6 months revealed that a specific blood glucose fluctuation pattern can partially predict imminent SH.31 Some studies have also suggested that long-term prediction of SH in T1DM patients is not possible based on well-known risk factors for SH assessed over 12 years.34 In the Kaiser Permanente Colorado cohort, a 16-variable model to predict the 6-month risk of SH was developed for individuals treated with hypoglycemic agents (4.3% of T1DM patients).23 The Diabetes Control and Complication Trial demonstrated that only 6%–12% of future (within several months) SH episodes could be explained from known variables.35 A short-term (within 24 hours) SH prediction model was suggested using SMBG readings to detect a characteristic pattern of glucose fluctuations in T2DM, which was able to predict ~60% of episodes.31 However, for practical application, frequent SMBG has the problem of long-term adherence, and CGMS is not routinely available due to cost issues.
We developed a long-term risk prediction model for SH in T2DM patients using a national DB. Generally, large, representative, current data sets reflecting the characteristics of the target population are ideal for creating models; therefore, our NHIS DB is valuable.25,36 In addition to anthropometric and clinical information, our model included a single measure of fasting serum glucose and creatinine level at baseline, which helped increase the predictive power of our model compared with clinical information alone.
Our prediction model consisted of 14 variables, each with a score ranging from 0 to 100, with the total score ranging from 0 to 495, and presented 1-year SH risk. A risk scoring system should be simple, contain clinically important variables influencing hazard outcomes, and be convenient to use for physicians or healthcare providers. Based on this 14-item assessment, healthcare professionals are able to easily screen high-risk patients for SH and immediately translate medical advice into actions, such as dosage adjustments of insulin or OHA, patient education, or evaluation of hypoglycemia unawareness.
There were some limitations to this analysis. First, subjects with disease codes E11–14 who were not on anti-diabetic medication were not included. In addition, various comorbidities related to higher SH risk, including retinopathy, CVD, depression, dementia, and heart failure, were not included in this model. We could not obtain clinical information on HbA1c levels, exact duration of diabetes, other medications that can affect the glycemic status of the subjects including beta-blocker or corticosteroid, and glucose levels during the SH event. Patients with SH episodes without claims data who did not present to emergency departments or clinics were not detected in this study. External validation and impact studies are essential in the future. The GLP-1RA was introduced in Korea by the end of 2008. However, health insurance coverage was available in November 2010 with strict conditions. Therefore, the GLP-1RA was not included in this analysis. We defined CKD from only one test of eGFR value. Due to the nature and limitation of our NHIS DB, we could not obtain eGFR value from two separate tests more than 3 months apart. Finally, risk scores may not be applicable to other ethnic groups. According to the Atherosclerosis Risk in Communities study, African ancestry was significantly associated with an increased risk of SH.20 However, other studies have demonstrated similar rates among African Americans and Caucasians.8,37,38
Despite these limitations, the major strength of this study was that the data were based on a nationwide Korean population covering nearly 100% of Korean patients with T2DM. The high prediction accuracy obtained through cross-validation of the model suggests strong internal validity of these results. This risk model also included anthropometric and lifestyle factors. Models based on clinical information in electronic medical records or face-to-face acquisition during visits can be more easily implemented in the clinical setting than complicated computer-based algorithms. Therefore, the web-based calculator derived from this model is an easily accessible format for clinical use. We expect that our SH risk calculator will make this model more user-friendly for clinical use through a mobile application or web-based program. Healthcare professionals should consider prompt intervention in patients with high scores determined by this calculator, including setting a less stringent A1C target, adjusting antidiabetic treatment, obtaining frequent SMBG readings, applying lifestyle modifications with a regular meal schedule, and re-education.2,39
Conclusion
In summary, we presented a multivariable risk model that predicts the development of SH in T2DM patients. For this specific population, an individualized glycemic target, changes to safer drugs, recommendations of behavioral interventions, and intensive reeducation about SH are clearly needed. Our SH screening score may serve as a practical tool for individuals with T2DM who are unaware of their risk and provide clinicians a way to prevent future SH events. Future studies will focus on the external validation of this risk model in a larger cohort with T2DM to strengthen the predictive power. At the same time, tailored intervention programs for T2DM patients in specific score ranges should be developed.
Data sharing statement
The complete data set and statistical code that support the findings of this study are available from NHIS in Korea but restrictions apply to the availability of these data, which were used under license for the current study, and so are not publicly available. Data are, however, available from the corresponding author upon reasonable request and with the permission of NHIS in Korea.
Acknowledgments
This work was performed in coordination with NHIS and the Korean Diabetes Association. The National Health Information Database made by NHIS was used (No. NHIS-2017-1-292). The content is solely the responsibility of the authors and does not necessarily represent the official views of the NHIS. This Investigator-Initiated Sponsored Research is funded by the Takeda Pharmaceuticals Korea and Handok Pharmaceutical. The funders had no role in the study design, collection of data, analysis, interpretation of data, and reporting.
Author contributions
S-HK designed the study protocol and analysis plan, researched data, wrote the first draft of the manuscript, and reviewed and edited the manuscript. Y-MP edited the manuscript. J-SY, S-AC, J-HC, and Y-BA contributed to discussion and reviewed and edited the manuscript. KH completed all statistical analysis. S-HK is the guarantor of this work, takes responsibility for the integrity of the data and the accuracy of the data analysis. All authors contributed toward data analysis, drafting and revising the paper and agree to be accountable for all aspects of the work.
Disclosure
The authors report no conflicts of interest in this work.
References
Kelly TN, Bazzano LA, Fonseca VA, Thethi TK, Reynolds K, He J. Systematic review: glucose control and cardiovascular disease in type 2 diabetes. Ann Intern Med. 2009;151(6):394–403. | ||
American Diabetes Association. 7. Obesity Management for the Treatment of Type 2 Diabetes: Standards of Medical Care in Diabetes-2018. Diabetes Care. 2018;41(Suppl 1):S65–S72. | ||
Ko SH, Hur KY, Rhee SY, et al. Antihyperglycemic agent therapy for adult patients with type 2 diabetes mellitus 2017: a position statement of the Korean Diabetes Association. Korean J Intern Med. 2017;32(6):947–958. | ||
Action to Control Cardiovascular Risk in Diabetes Study Group, Gerstein HC, Miller ME, Byington RP, et al. Effects of intensive glucose lowering in type 2 diabetes. N Engl J Med. 2008;358(24):2545–2559. | ||
ADVANCE Collaborative Group, Patel A, Macmahon S, Chalmers J, et al. Intensive blood glucose control and vascular outcomes in patients with type 2 diabetes. N Engl J Med. 2008;358(24):2560–2572. | ||
Cryer PE. Individualized glycemic goals and an expanded classification of severe hypoglycemia in diabetes. Diabetes Care. 2017;40(12):1641–1643. | ||
Seaquist ER, Anderson J, Childs B, et al. Hypoglycemia and diabetes: a report of a workgroup of the American Diabetes Association and the Endocrine Society. Diabetes Care. 2013;36(5):1384–1395. | ||
Lipska KJ, Ross JS, Wang Y, et al. National trends in US hospital admissions for hyperglycemia and hypoglycemia among Medicare beneficiaries, 1999 to 2011. JAMA Intern Med. 2014;174(7):1116–1124. | ||
Zaccardi F, Davies MJ, Dhalwani NN, et al. Trends in hospital admissions for hypoglycaemia in England: a retrospective, observational study. Lancet Diabetes Endocrinol. 2016;4(8):677–685. | ||
Yun JS, Ko SH. Risk factors and adverse outcomes of severe hypoglycemia in type 2 diabetes mellitus. Diabetes Metab J. 2016;40(6):423–432. | ||
Cha SA, Yun JS, Lim TS, et al. Severe hypoglycemia and cardiovascular or all-cause mortality in patients with type 2 diabetes. Diabetes Metab J. 2016;40(3):202–210. | ||
Goto A, Arah OA, Goto M, Terauchi Y, Noda M. Severe hypoglycaemia and cardiovascular disease: systematic review and meta-analysis with bias analysis. BMJ. 2013;347:f4533. | ||
ORIGIN Trial Investigators, Mellbin LG, Rydén L, Riddle MC, et al. Does hypoglycaemia increase the risk of cardiovascular events? A report from the ORIGIN trial. Eur Heart J. 2013;34(40):3137–3144. | ||
Chow E, Bernjak A, Williams S, et al. Risk of cardiac arrhythmias during hypoglycemia in patients with type 2 diabetes and cardiovascular risk. Diabetes. 2014;63(5):1738–1747. | ||
Reno CM, Daphna-Iken D, Chen YS, Vanderweele J, Jethi K, Fisher SJ. Severe hypoglycemia-induced lethal cardiac arrhythmias are mediated by sympathoadrenal activation. Diabetes. 2013;62(10):3570–3581. | ||
Lee YH, Han K, Ko SH, Ko KS, Lee KU, Taskforce Team of Diabetes Fact Sheet of the Korean Diabetes Association. Data analytic process of a nationwide population-based study using National Health Information Database established by National Health Insurance Service. Diabetes Metab J. 2016;40(1):79–82. | ||
Kang SH, Choi EK, Han KD, et al. Underweight is a risk factor for atrial fibrillation: A nationwide population-based study. Int J Cardiol. 2016;215:449–456. | ||
Ko SH, Kim DJ, Park JH, et al. Trends of antidiabetic drug use in adult type 2 diabetes in Korea in 2002-2013: nationwide population-based cohort study. Medicine. 2016;95(27):e4018. | ||
Ko SH, Park YM, Yun JS, et al. Severe hypoglycemia is a risk factor for atrial fibrillation in type 2 diabetes mellitus: nationwide population-based cohort study. J Diabetes Complications. 2018;32(2):157–163. | ||
Lee AK, Lee CJ, Huang ES, Sharrett AR, Coresh J, Selvin E. Risk factors for severe hypoglycemia in black and white adults with diabetes: the Atherosclerosis Risk in Communities (ARIC) study. Diabetes Care. 2017;40(12):1661–1667. | ||
National Kidney Foundation. K/DOQI clinical practice guidelines for chronic kidney disease: evaluation, classification, and stratification. Am J Kidney Dis. 2002;39(2 Suppl 1):S1–266. | ||
Levey AS, Stevens LA, Schmid CH, et al. A new equation to estimate glomerular filtration rate. Ann Intern Med. 2009;150(9):604–612. | ||
Schroeder EB, Xu S, Goodrich GK, Nichols GA, O’Connor PJ, Steiner JF. Predicting the 6-month risk of severe hypoglycemia among adults with diabetes: development and external validation of a prediction model. J Diabetes Complications. 2017;31(7):1158–1163. | ||
Bloomfield HE, Greer N, Newman D. VA Evidence-Based Synthesis Program Reports. Predictors and Consequences of Severe Hypoglycemia in Adults with Diabetes – A Systematic Review of the Evidence. Washington, DC: Department of Veterans Affairs; 2012. | ||
Lee YH, Bang H, Kim DJ. How to establish clinical prediction models. Endocrinol Metab (Seoul). 2016;31:38–44. | ||
Wells BJ, Jain A, Arrigain S, Yu C, Rosenkrans WA, Kattan MW. Predicting 6-year mortality risk in patients with type 2 diabetes. Diabetes Care. 2008;31(12):2301–2306. | ||
Hsu PF, Sung SH, Cheng HM, et al. Association of clinical symptomatic hypoglycemia with cardiovascular events and total mortality in type 2 diabetes: a nationwide population-based study. Diabetes Care. 2013;36(4):894–900. | ||
UK Hypoglycaemia Study Group. Risk of hypoglycaemia in types 1 and 2 diabetes: effects of treatment modalities and their duration. Diabetologia. 2007;50(6):1140–1147. | ||
Moen MF, Zhan M, Hsu VD, et al. Frequency of hypoglycemia and its significance in chronic kidney disease. Clin J Am Soc Nephrol. 2009;4(6):1121–1127. | ||
American Diabetes Association Consensus Panel. Guidelines for computer modeling of diabetes and its complications. Diabetes Care. 2004;27(9):2262–2265. | ||
Cox DJ, Gonder-Frederick L, Ritterband L, Clarke W, Kovatchev BP. Prediction of severe hypoglycemia. Diabetes Care. 2007;30(6):1370–1373. | ||
Lagani V, Chiarugi F, Thomson S, et al. Development and validation of risk assessment models for diabetes-related complications based on the DCCT/EDIC data. J Diabetes Complications. 2015;29(4):479–487. | ||
Palerm CC, Bequette BW. Hypoglycemia detection and prediction using continuous glucose monitoring-a study on hypoglycemic clamp data. J Diabetes Sci Technol. 2007;1(5):624–629. | ||
Henriksen MM, Færch L, Thorsteinsson B, Pedersen-Bjergaard U. Long-term prediction of severe hypoglycemia in type 1 diabetes: is it really possible? J Diabetes Sci Technol. 2016;10(6):1230–1235. | ||
Hypoglycemia in the Diabetes Control and Complications Trial. The Diabetes Control and Complications Trial Research Group. Diabetes. 1997;46(2):271–286. | ||
Brodovicz KG, Mehta V, Zhang Q, et al. Association between hypoglycemia and inpatient mortality and length of hospital stay in hospitalized, insulin-treated patients. Curr Med Res Opin. 2013;29(2):101–107. | ||
Karter AJ, Lipska KJ, O’Connor PJ, et al. High rates of severe hypoglycemia among African American patients with diabetes: the surveillance, prevention, and Management of Diabetes Mellitus (SUPREME-DM) network. J Diabetes Complications. 2017;31(5):869–873. | ||
Miller ME, Bonds DE, Gerstein HC, et al. The effects of baseline characteristics, glycaemia treatment approach, and glycated haemoglobin concentration on the risk of severe hypoglycaemia: post hoc epidemiological analysis of the ACCORD study. BMJ. 2010;340: b5444. | ||
Lipska KJ, Krumholz H, Soones T, Lee SJ. Polypharmacy in the aging patient: a review of glycemic control in older adults with type 2 diabetes. JAMA. 2016;315(10):1034–1045. |
Supplementary materials
 | Table S1 Scores for each risk factor category Abbreviations: OHA, oral hypoglycemic agents; SH, severe hypoglycemia. |
 | Table S2 Four-variable simple model for predicting SH and the score for each variable Abbreviation: SH, severe hypoglycemia. |
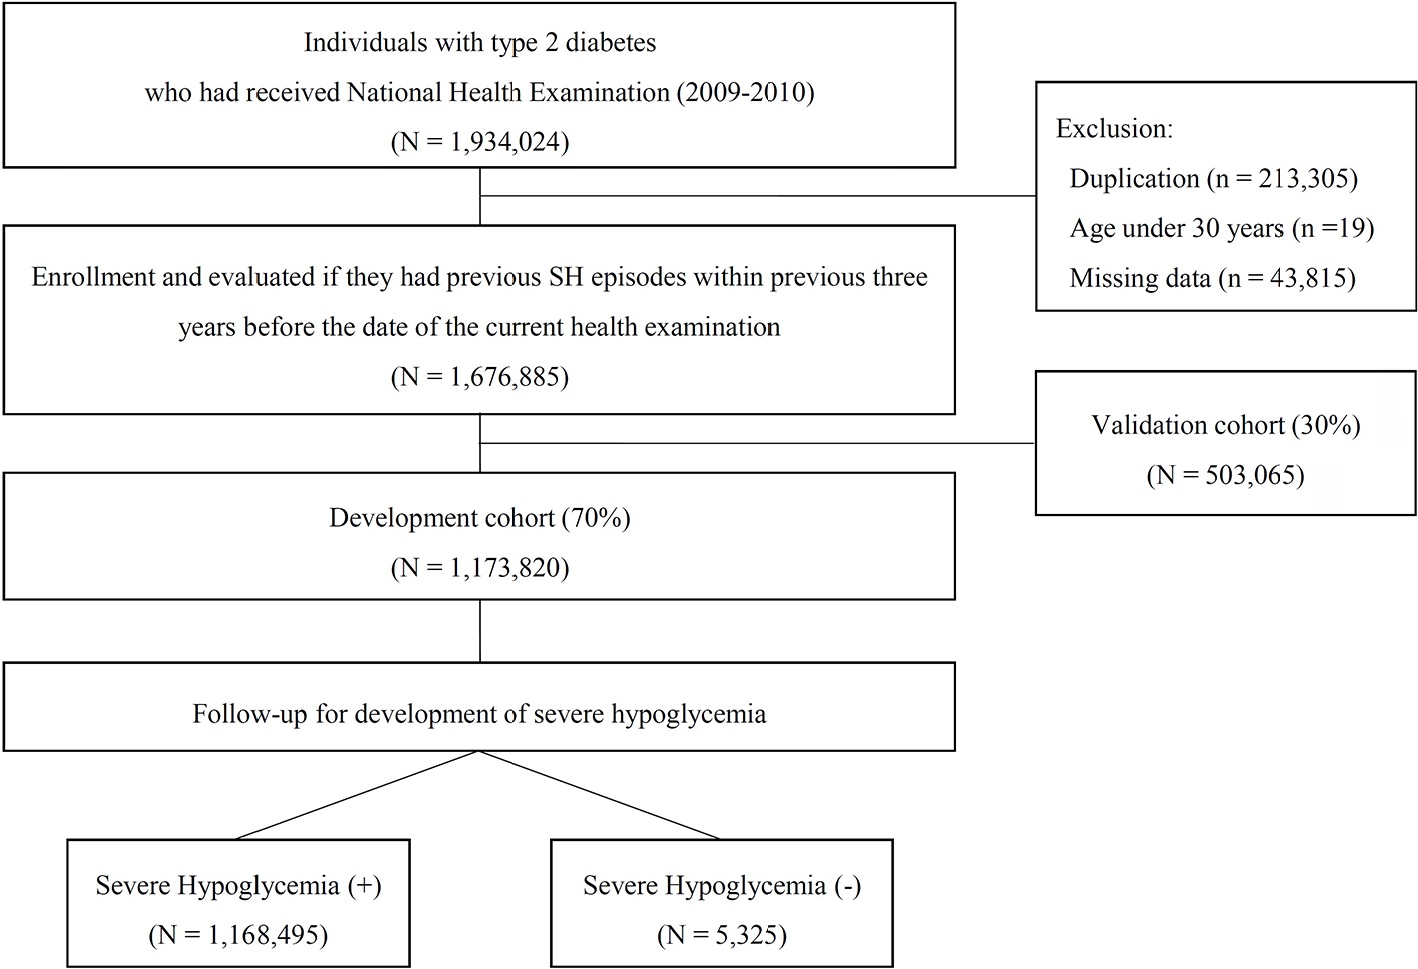 | Figure S1 Study design summary. Abbreviation: SH, severe hypoglycemia. |
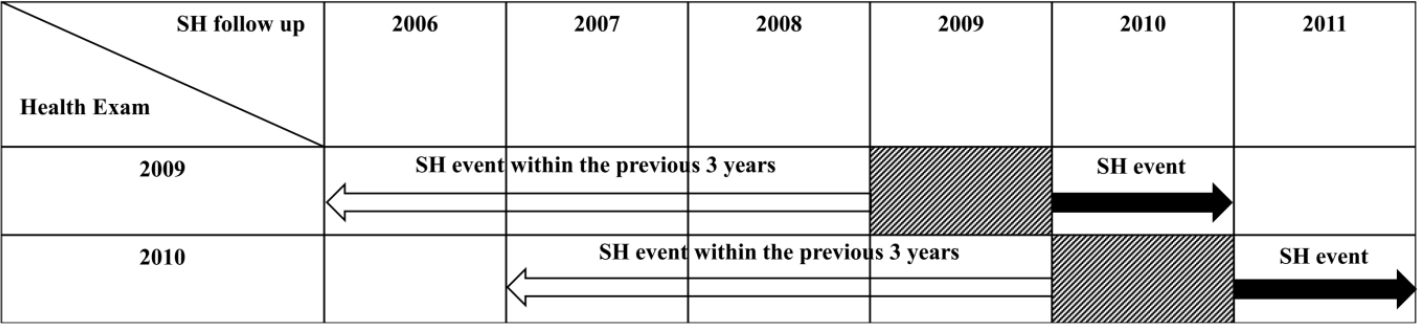 | Figure S2 Study design summarizing sample recruitment and follow-up. Abbreviation: SH, severe hypoglycemia. |
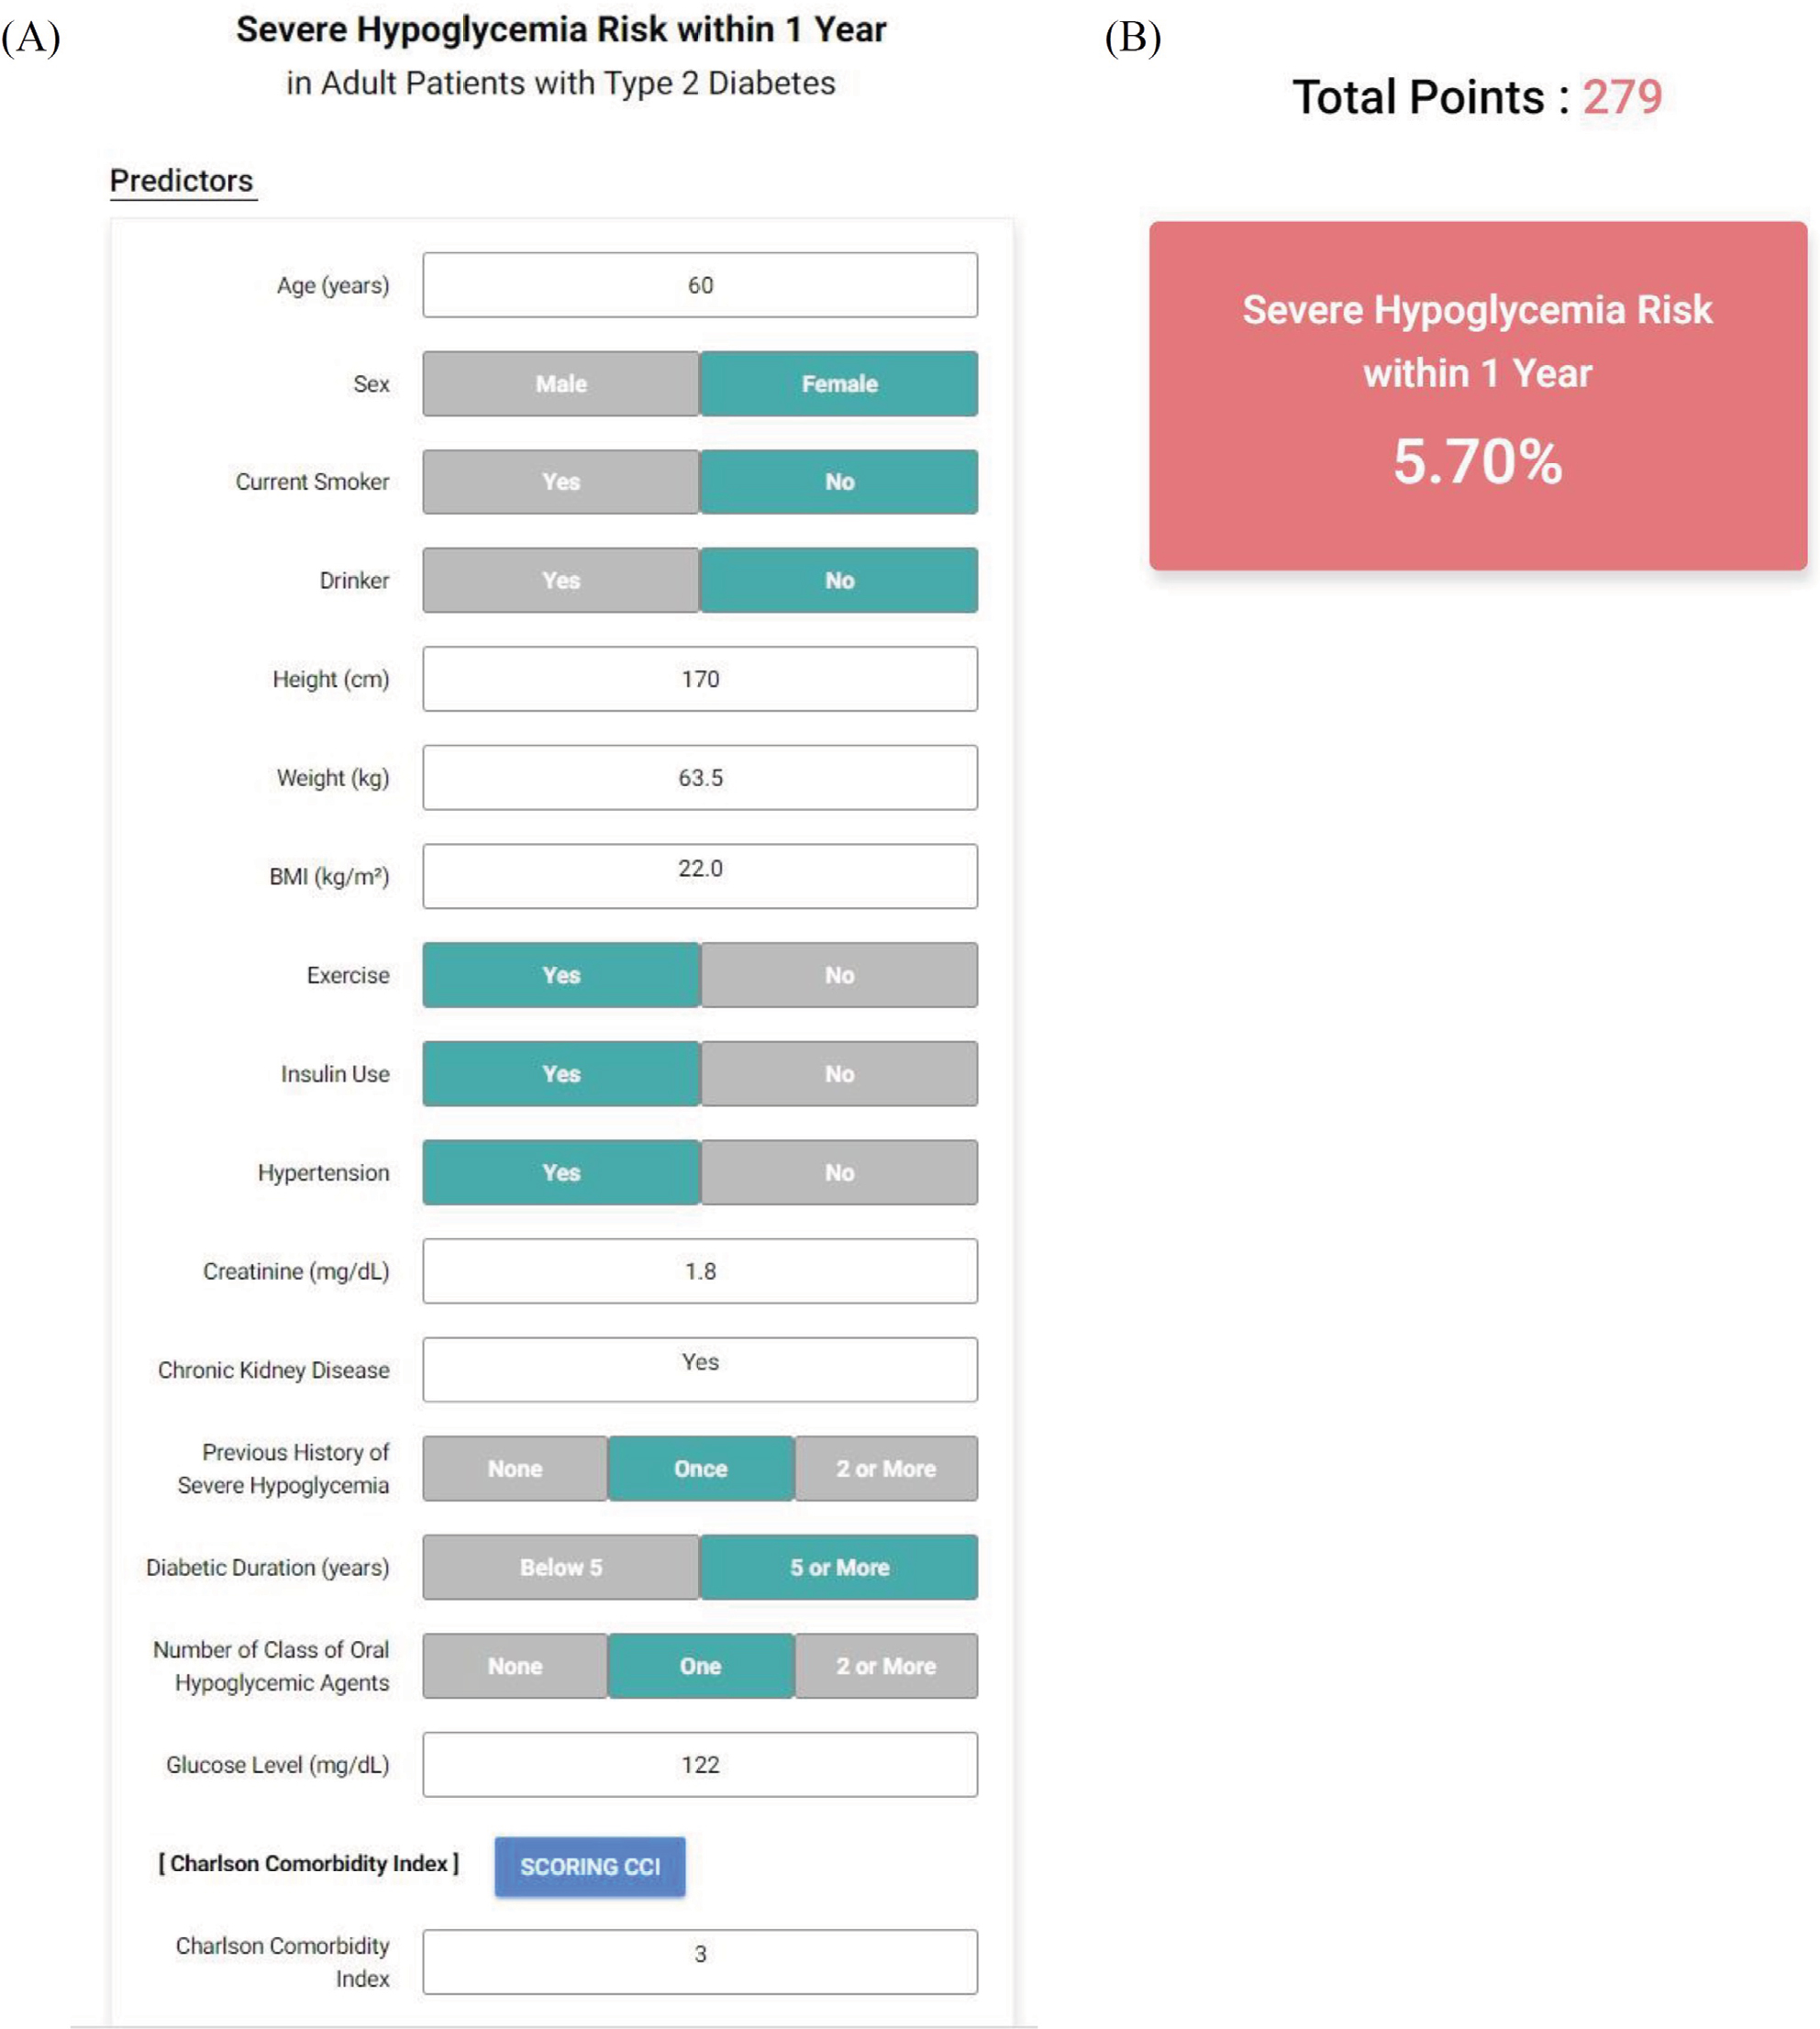 | Figure S3 (A) Web-based application for 1-year severe hypoglycemia (SH) risk model (http://md.koobian.com/sh/index.html). (B) This calculator shows the 1-year SH risk prediction automatically. |
 | Figure S4 Calibration plots depicting the correlation between predicted and actual 1-year severe hypoglycemia event. |
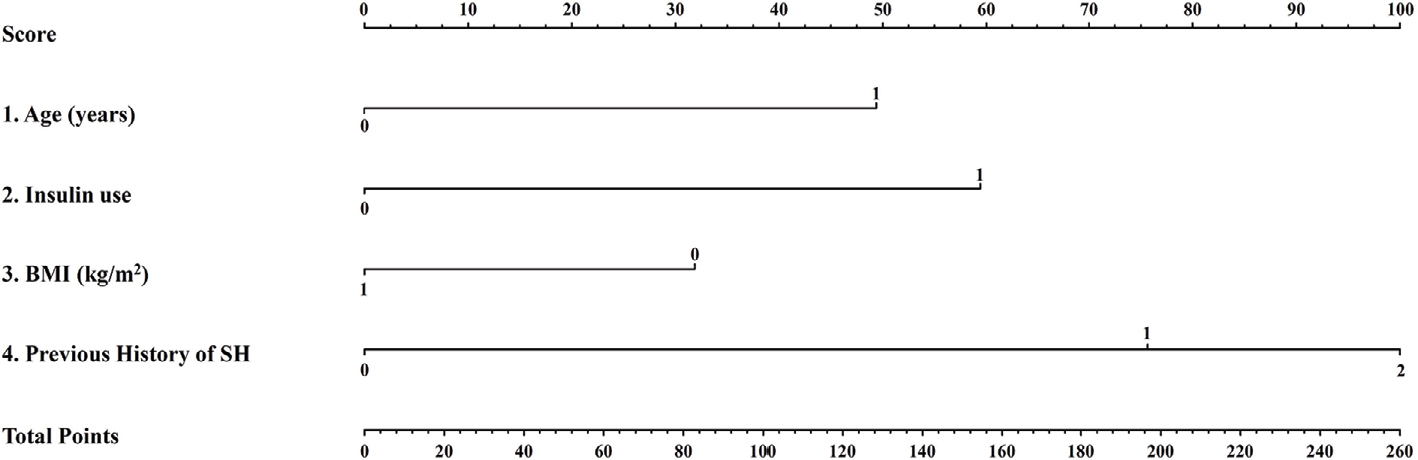 | Figure S5 A nomogram for the four-variable simple prediction model of the 1-year probability of SH. Abbreviations: BMI, body mass index; SH, severe hypoglycemia. |
 © 2018 The Author(s). This work is published and licensed by Dove Medical Press Limited. The
full terms of this license are available at https://www.dovepress.com/terms
and incorporate the Creative Commons Attribution
- Non Commercial (unported, 3.0) License.
By accessing the work you hereby accept the Terms. Non-commercial uses of the work are permitted
without any further permission from Dove Medical Press Limited, provided the work is properly
attributed. For permission for commercial use of this work, please see paragraphs 4.2 and 5 of our Terms.
© 2018 The Author(s). This work is published and licensed by Dove Medical Press Limited. The
full terms of this license are available at https://www.dovepress.com/terms
and incorporate the Creative Commons Attribution
- Non Commercial (unported, 3.0) License.
By accessing the work you hereby accept the Terms. Non-commercial uses of the work are permitted
without any further permission from Dove Medical Press Limited, provided the work is properly
attributed. For permission for commercial use of this work, please see paragraphs 4.2 and 5 of our Terms.