Back to Journals » Cancer Management and Research » Volume 14
Development and Validation of a Preoperative CT-Based Nomogram to Differentiate Invasive from Non-Invasive Pulmonary Adenocarcinoma in Solitary Pulmonary Nodules
Authors Song X ![]() , Zhao Q
, Zhao Q ![]() , Zhang H, Xue W, Xin Z, Xie J, Zhang X
, Zhang H, Xue W, Xin Z, Xie J, Zhang X
Received 20 January 2022
Accepted for publication 8 March 2022
Published 20 March 2022 Volume 2022:14 Pages 1195—1208
DOI https://doi.org/10.2147/CMAR.S357385
Checked for plagiarism Yes
Review by Single anonymous peer review
Peer reviewer comments 2
Editor who approved publication: Dr Sanjeev K. Srivastava
Xin Song,1,2 Qingtao Zhao,1 Hua Zhang,1 Wenfei Xue,1 Zhifei Xin,1 Jianhua Xie,1,2 Xiaopeng Zhang1
1Department of Thoracic Surgery, Hebei General Hospital, Shijiazhuang, People’s Republic of China; 2North China University of Science and Technology, Tangshan, People’s Republic of China
Correspondence: Xiaopeng Zhang, Hebei General Hospital, No. 348, Heping Western Road, Xinhua District, Shijiazhuang, 050000, People’s Republic of China, Tel +8613722865878, Email [email protected]
Purpose: This study aimed to develop and validate a preoperative CT-based nomogram combined with clinical and radiological features for distinguishing invasive from non-invasive pulmonary adenocarcinoma.
Patients and Methods: A total of 167 patients with solitary pulmonary nodules and pathologically confirmed adenocarcinoma treated between January 2020 and December 2020 at Hebei General Hospital were retrospectively assessed. To evaluate the probability of invasive pulmonary adenocarcinoma, we developed three models, the multivariate logistic regression model, the stepwise logistic regression model, and the cross-validation model. The Akaike information criterion (AIC) was used to compare the relative strength of different models, and the area under the curve (AUC) was used to quantify the predictive accuracy. The best performing model was presented as a nomogram, calibrated and evaluated for clinical utility.
Results: The stepwise logistic regression model revealed highest and mean attenuations of non-enhanced CT images, and lobulation and vacuole presence were predictive factors of invasive pulmonary adenocarcinoma. This model (AIC = 67.528) with the lowest AIC value compared with that of the multivariate logistic regression model (AIC = 69.301) or the cross-validation model (AIC = 81.216) was identified as the best model, and its AUC value (0.9967; 95% CI, 0.9887– 1) was higher than those of the other two models. The calibration curve showed optimal agreement in invasive pulmonary adenocarcinoma probability as predicted by the nomogram and the actual value.
Conclusion: We developed and validated a nomogram that could estimate the preoperative probability of invasive pulmonary adenocarcinoma in patients with solitary pulmonary nodules, which may be useful in clinical decision-making associated with personalized surgical intervention and therapeutic regimen selection.
Keywords: solitary pulmonary nodule, nomogram, invasive pulmonary adenocarcinoma, lung cancer
Introduction
With the development of imaging techniques, including high-resolution Computed Tomography (CT) and low-dose CT, as well as increased health awareness, more and more early pulmonary nodules are detected. A solitary pulmonary nodule (SPN) is defined as a single, well-defined radiographic opacity that measures up to 30 mm in diameter and is completely surrounded by the lung parenchyma without atelectasis, mediastinal lymphadenopathy, or pleural effusion.1 Lung adenocarcinoma is the commonest histopathological type of peripheral carcinoma, and its incidence has been increasing in recent years.2–7 According to the International Association for the Study of Lung Cancer/American Thoracic Society/European Respiratory Society classification of lung adenocarcinoma, lung adenocarcinoma can be divided into four groups: (1) preinvasive lesions, including atypical adenomatous hyperplasia (AAH) and adenocarcinoma in situ (AIS); (2) minimally invasive adenocarcinoma (MIA); (3) invasive pulmonary adenocarcinoma (IPA); (4) Variants of invasive adenocarcinoma.8
Benign pulmonary lesions have more typical imaging signs, and radiologists and thoracic surgeons could easily distinguish them. Patients are generally expected to be cured only by internal conservative treatment. Imaging manifestations of advanced and rapidly progressing lung lesions are also typical. Patients are not eligible for surgery, and the progression of lesions can be controlled by chemotherapy, radiotherapy, targeted therapy, immunotherapy and other medical tools. However, early and intermediate pulmonary cancers are not easily distinguishable by high-resolution CT, and there are surgical opportunities for both grades. For adenocarcinoma with the highest incidence, early-stage lesions include AAH, AIS and MIA, and sub-lobectomy is feasible to achieve cure; for intermediate-stage lesions, invasive adenocarcinoma, lobectomy is feasible. At present, the main means for determining the surgical method is to obtain frozen sections of the diseased tissue during the operation. An effective model to differentiate between early and middle lung lesions should (1) have minimal economic burden for patients to obtain the optimal treatment effect, (2) decrease the time of unnecessary follow-up of patients with effective diagnosis and treatment plan, and (3) provide intervention measures for lesions at the appropriate time to avoid further tumor progression and losing the opportunity to operation.
Nomograms are typically used as an easy applied math prognostic model that quantifies the hazard of a clinical event like cancer. Since pneumonic glandular cancer has the highest incidence rate, this study aimed to develop a predictive model that differentiates invasive from non-invasive pulmonary adenocarcinoma in cases with solitary pulmonary nodules, and to establish a nomogram that combines CT and clinical features for the pretreatment identification of IPA risk in patients with SPNs.
Materials and Methods
Patient Selection
This retrospective study was approved by the ethics committee of Hebei General Hospital. All patients provided signed informed consent. The clinical data and CT images of 252 patients administered complete surgical resection and pathologically confirmed with AAH, AIS, MIA, and IPA in Hebei General Hospital (Shijiazhuang, Hebei, China) between January 2020 and December 2020 were reviewed. The flowchart summarizes the study design of each approach and shows in Figure 1. Inclusion criteria were: (1) SPNs on lung window images (level and width of −700 and 1000 Hounsfield unit [HU], respectively); (2) nodules of 5–30 mm in longest diameter on axial images; (3) aged over 18 years; (4) no lung cancer or other malignant tumor in the past five years; (5) asymptomatic at diagnosis; (6) no preoperative treatment; (7) all lesions diagnosed as primary pulmonary adenocarcinoma. Exclusion criteria were: (1) nodules larger than 3 cm in diameter; (2) complications with other pulmonary lesions; (3) a history of lung disease; (4) metastatic tumors; (5) disease histopathologically confirmed to comprise other pathological types such as squamous cell carcinoma and small cell lung cancer. Based on these inclusion and exclusion criteria, 85 patients were excluded. Finally, 167 patients (58 males (60 ± 11 years) and 109 females (58 ± 11 years)) were analyzed.
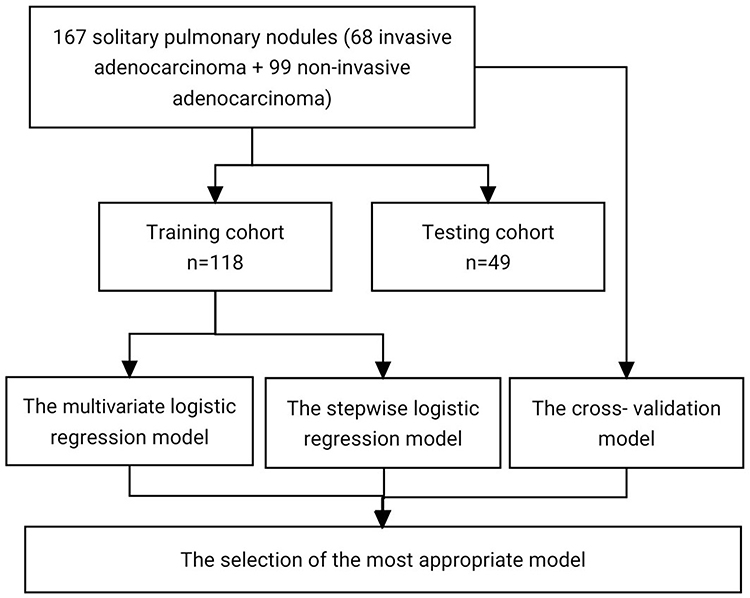 |
Figure 1 Flowchart for building the prediction model. |
Variables
In this study, clinical variables such as gender, age, body mass index (BMI), smoking history, history of cancer, and family history of cancer were collected, as well as radiological chest CT data, including SPN diameter (maximum transverse size), highest attenuation of non-enhanced CT images, mean attenuation of non-enhanced CT images, margin (clear or blurred), spiculation, lobulation, pleural indentation, vacuole, vascular convergence and SPN location (upper or non-upper lobes). Both clinical and pathological data were assessed by 2 senior radiologists blinded to the current study. Laboratory characteristics, including carcinoembryonic antigen (CEA), squamous cell carcinoma antigen (SCC), neuron specific enolase (NSE) and cytokeratin 19 fragment (CYFRA21-1), were also recorded.
Histopathological Analysis
All pathological specimens were formalin fixed, stained with hematoxylin-eosin and evaluated by two experienced pathologists. Histopathological evaluations were conducted by examining hematoxylin-eosin-stained slides by light microscopy. All specimens were classified according to the International Association for the Study of Lung Cancer/American Thoracic Society/European Respiratory Society classification of lung adenocarcinomas.8,9 AAH is a localized, small (usually 0.5 cm or less) proliferation of mildly to moderately atypical type II pneumocytes and/or Clara cells lining the alveolar wall and sometimes, respiratory bronchioles. AIS is a localized small (≤3 cm) adenocarcinoma with growth restricted to neoplastic cells along preexisting alveolar structures (lepidic growth), lacking stromal, vascular, or pleural invasion. MIA is a small, solitary adenocarcinoma (≤3 cm), with a predominantly lepidic pattern and ≤5 mm invasion in greatest dimension for any one focus.10
CT Examination and Imaging Analysis
All chest CT examinations included the entire thorax, and were performed in the supine position. Single scans were obtained during deep inspiration and breath-hold. A SIEMENS SOMATOM Definition Flash system (Siemens Healthineers, Erlangen, Germany) was used for CT, with the following parameters: 120 kV tube voltage; 110 mA tube current; 80 mm (128×0.625 mm) collimation width; 1 mm slice thickness; 1.2 pitch; 280 ms rotation time. The scans were analyzed in lung window setting (1000 HU window width and −700 HU window level) and the mediastinal window (350 HU window width and 40 HU window level).
All SPNs were automatically detected using uAI platform (United Imaging Healthcare, Shanghai, China), an artificial intelligence software. All regions of interest (ROIs) were manually drawn on the CT images on each section as an area that was as large as possible from all sections to cover the target nodule. The representative segmentation results were shown in Figure 2. Radiographic features were assessed independently by two experienced radiologists blinded to pathological results. Discrepancies between observers were resolved by consensus. The radiographic characteristics analyzed for each solitary pulmonary nodule included: (1) SPN diameter; (2) highest attenuation of non-enhanced CT images; (3) mean attenuation of non-enhanced CT images; (4) margin (clear or blurred); (5) spiculation (present or absent); (6) lobulation (present or absent); (7) pleural indentation (present or absent); (8) vacuole (present or absent); (9) vascular convergence; (10) SPN location (upper or non-upper lobes). SPN diameter was defined as the average of the major and vertical short diameters measured on the largest section in lung window.3,11 Attenuations were measured manually for the lesion region. A clear margin was defined as sharply demarcated, with a round or oval smooth shape.3 Spiculation was defined as strands extending from the nodule margin into the lung parenchyma without reaching the pleural surface.9 Lobulation was defined as a part of the nodule surface (except for the portions in contact with the pleura) exhibiting a concave or straightened configuration.3 A pleural indentation was defined as a trumpet-shaped attenuation extending toward the pleura from the nodule.9 A vacuole was defined as a small spot of round or ovoid air attenuation occurring within a solitary pulmonary nodule.12 Vascular convergence was defined with vessels crowding the internal part of the nodule or abnormally angled toward the nodule compared with the normal lung parenchyma.9
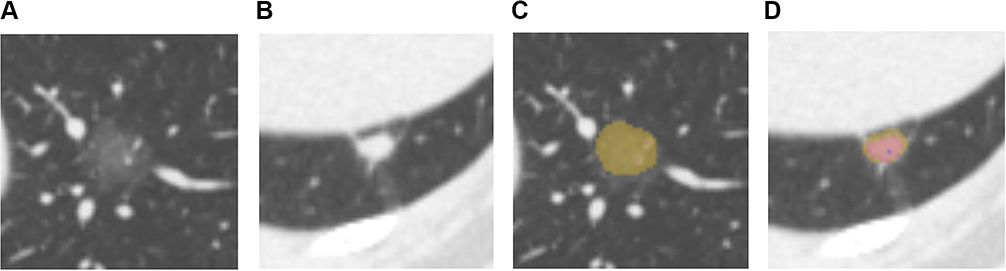 |
Figure 2 Representative segmentation results of SPN. (A and C) A 53-year-old male with SPN. (B and D) A 51-year-old female with SPN. (A and B) Original CT image of SPN. (C and D) Manual segmentation result of SPN. |
Collection of Tumor Markers
The tumor markers assessed included CEA, SCC, NSE and CYFRA21-1. Serum carcinoembryonic antigen is an established tumor marker in non-small cell lung cancer (NSCLC), although modest elevation of CEA is often seen without malignancy.13 CEA also plays a significant role as a regulator of tumor cell proliferation and differentiation. Overexpression of CEA contributes to the progression of many epithelial cancers and to immune dysfunction.14 SCC is a specific marker of squamous cell carcinoma and an independent prognostic factor of cervical squamous cell carcinoma. NSE represents a highly specific marker of neuronal and peripheral neuroendocrine cells, and is elevated in the serum of patients with neuroblastoma, melanoma, and seminoma.15 Cyfra 21-1 is mainly expressed in epithelial-derived cells and can be used for staging and prognostic analysis of nasopharyngeal carcinoma.16
Statistical Analysis
In this study, three statistical methods were used to establish prediction models, and the final screening variables were determined by comparing the area under the curves (AUCs) for the three methods. Nominal categorical variables were compared by Pearson’s Chi square test or Fisher’s exact test. The distribution of ordinal categorical variables was examined by the Shapiro–Wilk test, and Student’s t-test was performed to compare the training and validation cohorts or the invasive and non-invasive pulmonary adenocarcinoma groups for normally distributed features; otherwise, the Mann–Whitney U-test was used. In multivariate logistic regression model, the patients were divided into the training (n=118) and validation (n=49) cohorts at a ratio of 7:3. In the training cohort, univariate logistic regression analysis was used to determine associations of SPN invasion and clinical characteristics with CT imaging variables. In stepwise logistic regression model, the univariate logistic regression analysis described in multivariate logistic regression model was used to evaluate the clinicopathological factors in the training cohort. Factors with a P-value <0.05 were considered in stepwise multivariate logistic regression analysis. Meanwhile, the Akaike information criterion (AIC) was used to determine a stopping rule, and only factors with a P-value below 0.05 were incorporated into the nomogram. The factors were chosen to construct the stepwise logistic regression model. In cross-validation model, all patients were selected for construction by using a 10-fold cross-validation method. The AIC was applied to compare the relative strength of different models and identify the most appropriate model. The AUC was used to quantify the predictive accuracy of the three models. The predictive accuracies of the first two models were assessed by the AUCs for the validation cohort. The predictive accuracy of the last model was assessed by the AUC for the overall cohort. Then, the nomogram of the most appropriate model was established by comparing the three models. In addition, calibration of the nomogram was performed by a visual calibration curve with 200 bootstrap resamples. The R software (version 4.1.0; http://www.R-project.org) was used to perform all statistical analyses. The reported statistical significance was set at a P-value <0.05. The “glmnet” package was used to conduct the least absolute shrinkage and selection operator (LASSO) model. The “rms” package was used to build nomograms and generate calibration curves. The “pROC” package was used to plot receiver operating characteristic (ROC) curves.
Results
The characteristics of the 167 included participants with SPNs are described in Table 1. Overall, 58 (34.7%) male and 109 (65.3%) female participants with a mean age of 58.44±10.95 years were assessed in the current study. The prevalence of IPA was 40.7%. The data of 118 patients were utilized to develop a predictive model, while those of the remaining 49 were used for validation. There were no significant differences between the two cohorts in terms of patient characteristics, image-based features, and tumor biomarkers (P-values ranging between 0.0564 and 0.9619). There was also no significant difference in the prevalence of IPA between the two cohorts (P=0.1614). The rates of IPA in the training and validation cohorts were 37.3% and 49.0%, respectively. The clinical, radiological, and laboratory characteristics of patients in the training cohort are summarized in Table 2. Univariable analysis revealed significant differences between the invasive and non-invasive pulmonary adenocarcinoma cases in terms of age, diameter, highest attenuation of non-enhanced CT images, mean attenuation of non-enhanced CT images, spiculation, lobulation, pleural indentation, vacuole, and vascular convergence in the training cohort. Independent predictors of IPA were determined by multivariate logistic regression analysis, including highest attenuation of non-enhanced CT images (P=0.0013), mean attenuation of non-enhanced CT images (P=0.0459), and lobulation (P=0.0100) (Table 3). Then, the multivariate logistic regression model was reflected by the following formula: probability of IPA in the SPN: P = ex/(1+ex), where x = 1.1344 + (0.0106×highest attenuation of non-enhanced CT images) + (0.0037×mean attenuation of non-enhanced CT images) + (2.1363×lobulation).
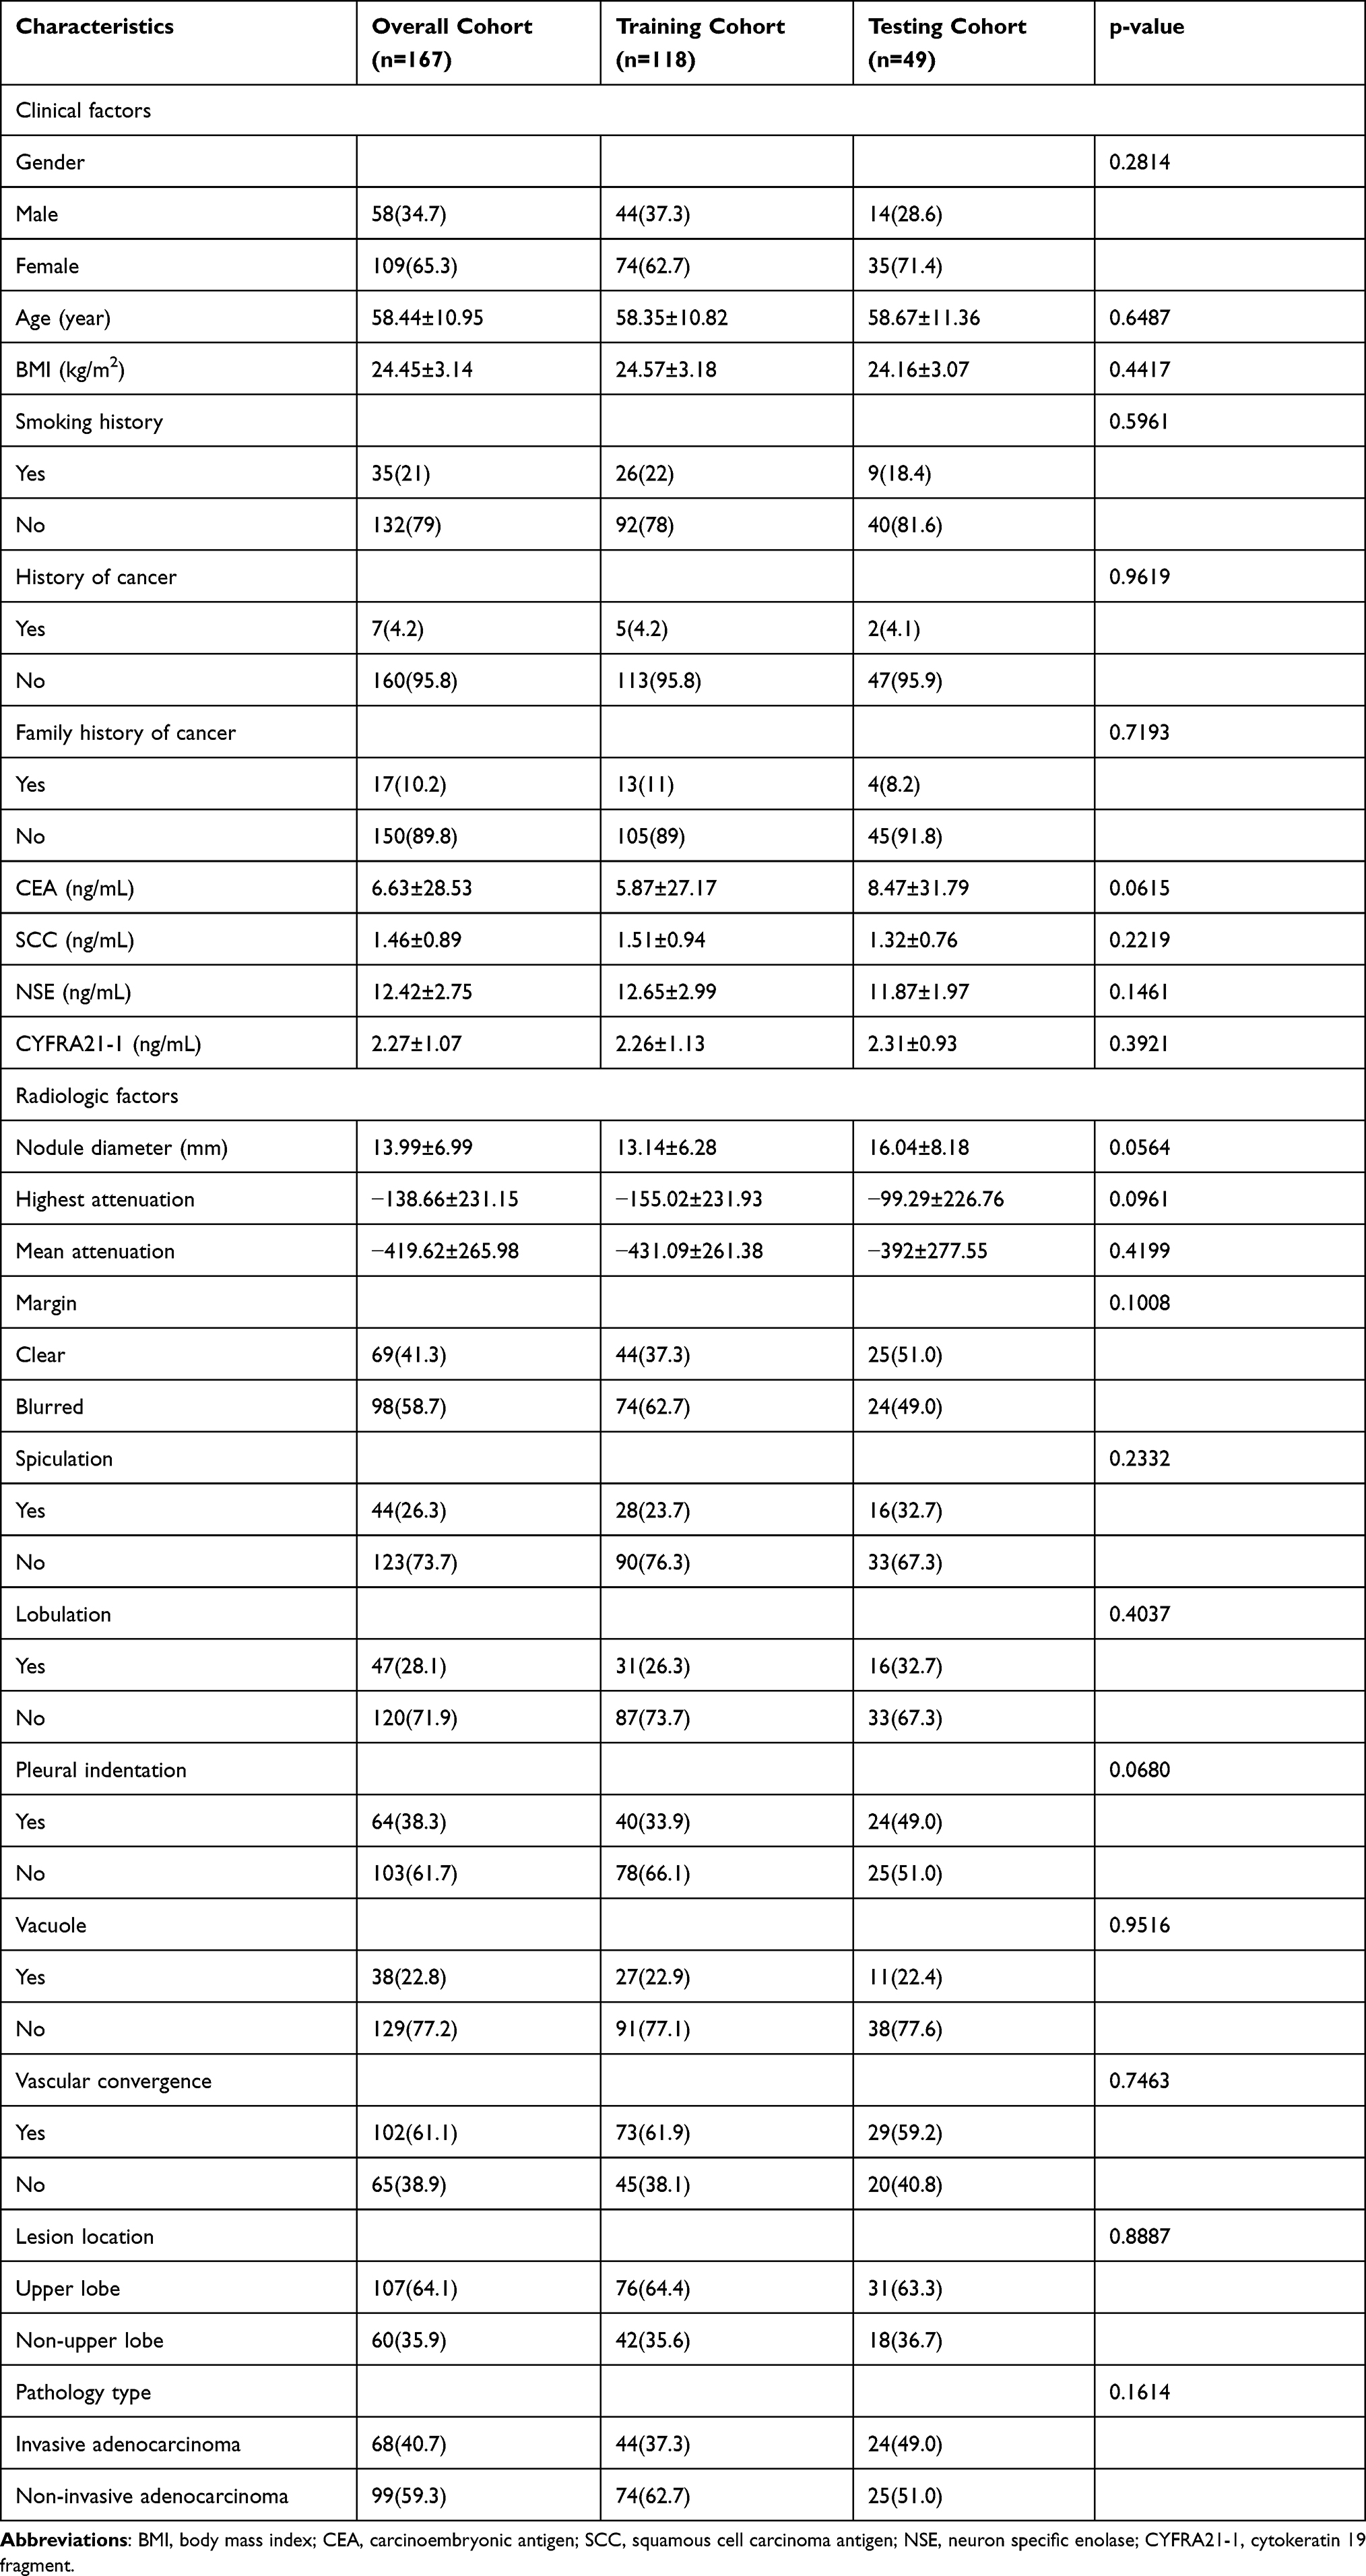 |
Table 1 Clinical and Imaging Characteristics of All Patients with Solitary Pulmonary Nodules |
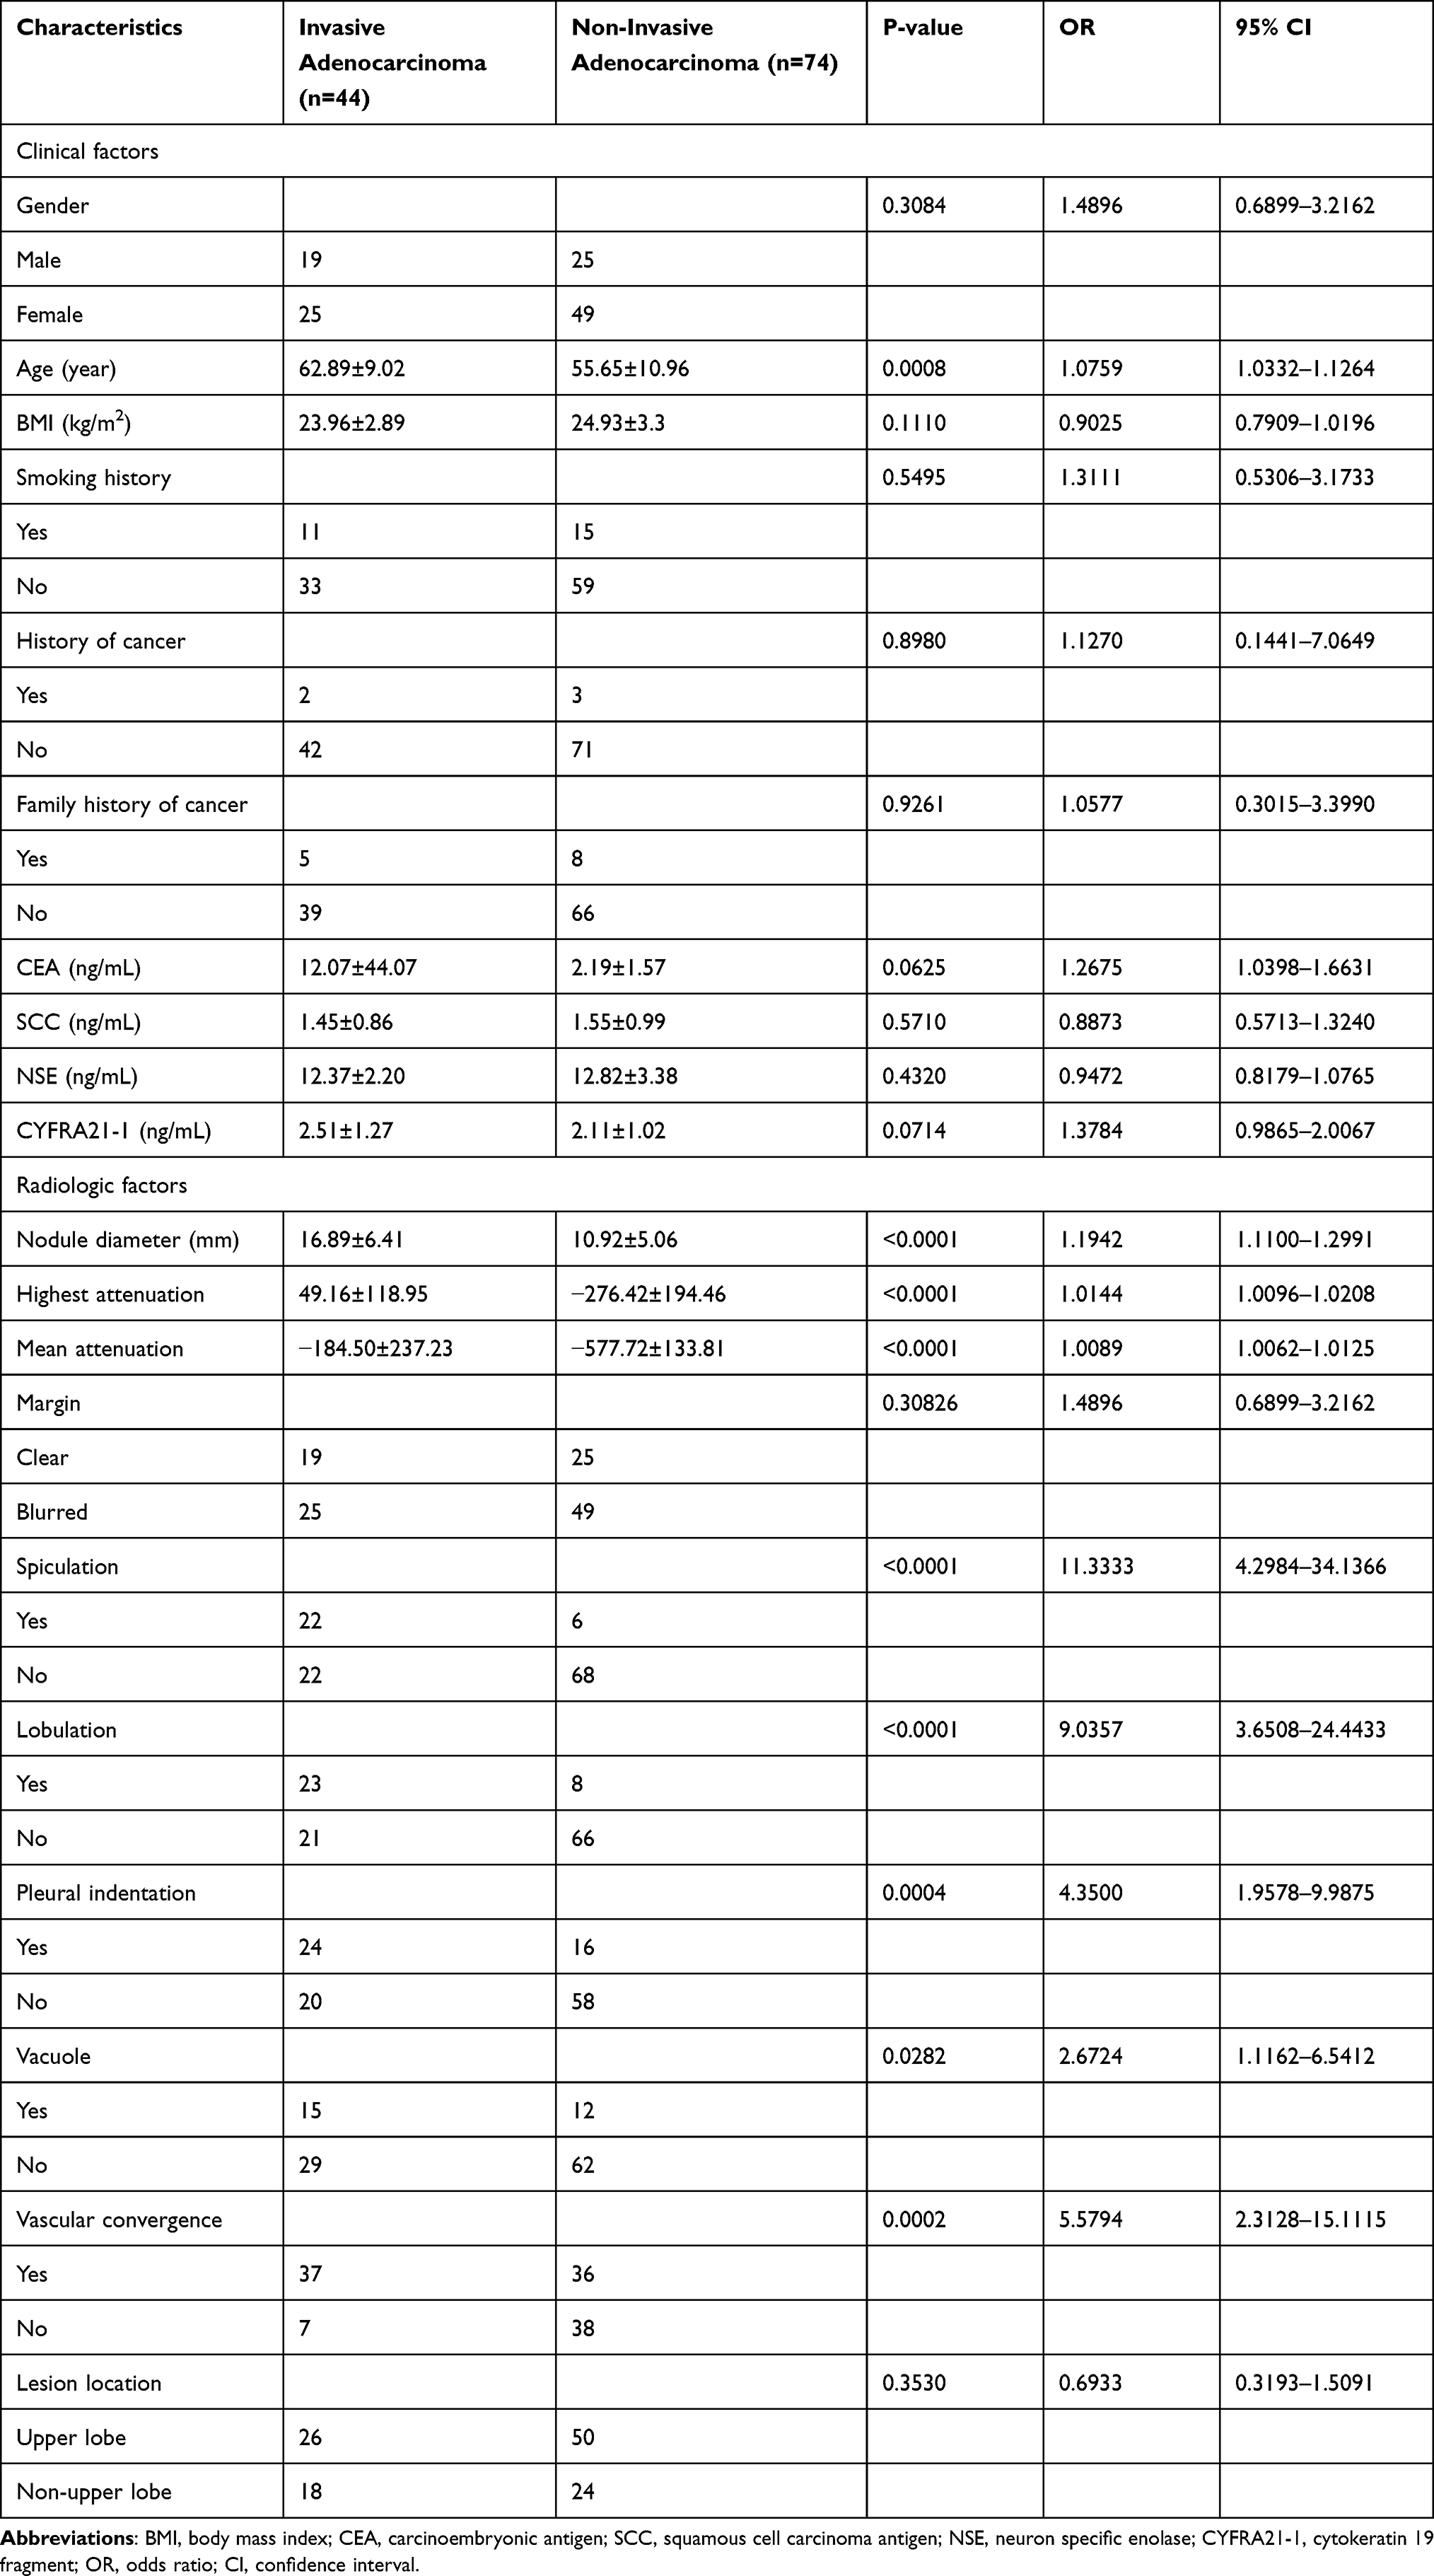 |
Table 2 Univariate Logistic Regression Analysis of the Associations of Clinical and Radiological Factors with Pathological Status in the Training Cohort (n=118) |
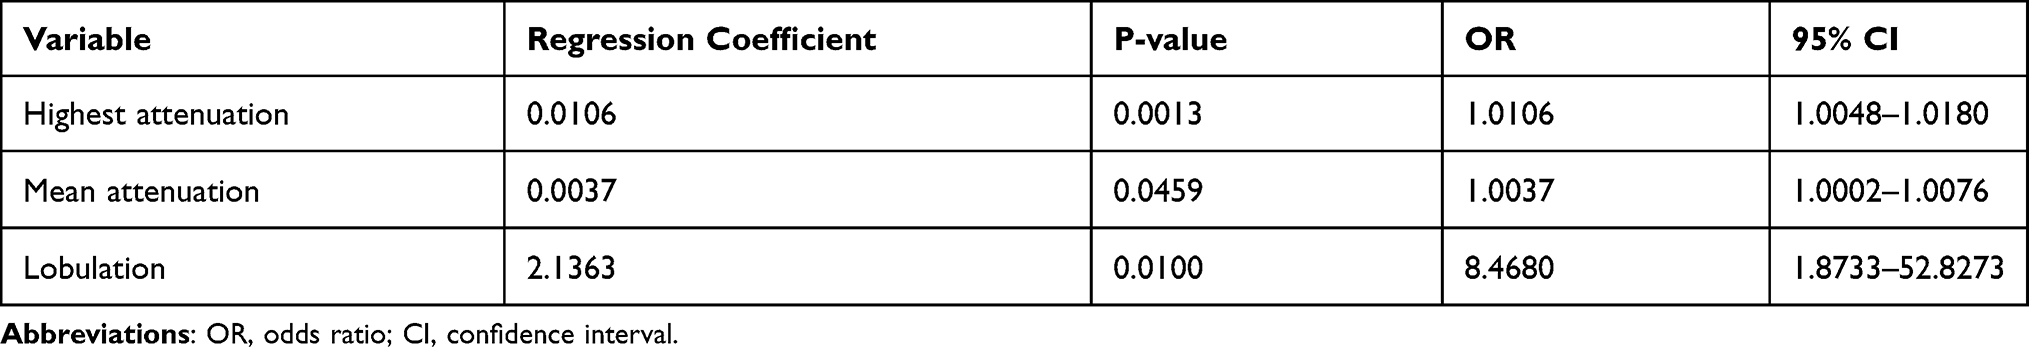 |
Table 3 Multivariate Logistic Regression Analysis in the Training Cohort (n=49) |
Univariate logistic regression analysis demonstrated significant differences between invasive and non-invasive pulmonary adenocarcinoma in terms of age, diameter, highest attenuation of non-enhanced CT images, mean attenuation of non-enhanced CT images, spiculation, lobulation, pleural indentation, vacuole, and vascular convergence in the training cohort. In addition, highest attenuation of non-enhanced CT images, mean attenuation of non-enhanced CT images, lobulation, and vacuole remained viable predictive indicators in the stepwise logistic regression model as shown in Table 4. Then, the stepwise logistic regression model was reflected by the following formula: probability of IPA in the SPN: P = ex/(1+ex), where x = 0.9902 + (0.0099×highest attenuation of non-enhanced CT images) + (0.0046×mean attenuation of non-enhanced CT images) + (2.3892×lobulation) + (1.4948×vacuole).
 |
Table 4 Stepwise Multivariate Logistic Regression Analysis |
After 10-fold cross-validation with the LASSO, the most valuable five features with nonzero coefficients were selected to establish the cross-validation model, including age, diameter, highest attenuation of non-enhanced CT images, mean attenuation of non-enhanced CT images, and lobulation (Figure 3 and 4). Then, the cross- validation model was reflected by the following formula: probability of IPA in the SPN: P = ex/(1+ex), where x = 0.3096 + (0.0027×age) + (0.0270×diameter) + (0.0049×highest attenuation of non-enhanced CT images) + (0.0024×mean attenuation of non-enhanced CT images) + (0.6675×lobulation).
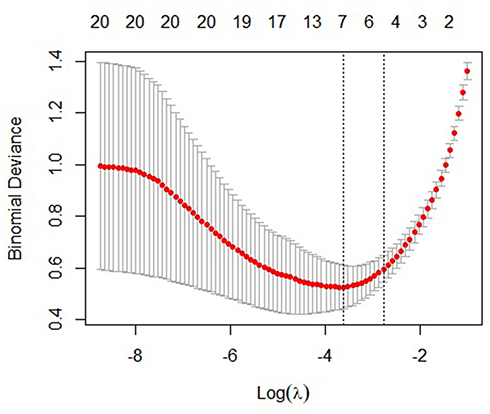 |
Figure 3 Feature selection in LASSO logistic regression. Tuning parameter λ selection by 10-fold cross-validation with minimum criteria. Binomial deviance (y-axis) was plotted versus log (λ) (x-axis). The dotted vertical lines were drawn at the optimal value of λ, where the model provides the best fit to the data. The optimal value of λ was 0.062, and the corresponding value of log(λ) was− 2.778. Abbreviation: LASSO, least absolute shrinkage and selection operator. |
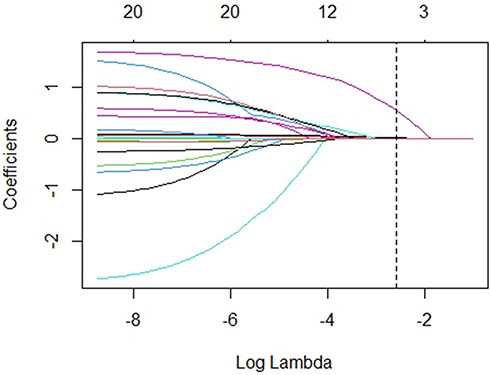 |
Figure 4 Coefficient profiles determined through LASSO logistic regression analysis of features. At log(λ)=−3, a dotted vertical line was drawn, including 14 optimal features with non-zero coefficients. Abbreviation: LASSO, least absolute shrinkage and selection operator. |
The stepwise logistic regression model (AIC = 67.528) with the lowest AIC value compared with the multivariate logistic regression model (AIC = 69.301) or the cross-validation model (AIC = 81.216) was identified as the best model. On the other hand, as shown in Table 5, the AUC of the stepwise logistic regression model (AUC = 0.9967; 95% CI: 0.9887–1) was higher than the multivariate logistic regression model (AUC = 0.9933; 95% CI: 0.9805–1) or the cross-validation model (AUC = 0.9731; 95% CI: 0.9437–1). Therefore, the stepwise logistic regression model showed the best discrimination. The ROC curves of the three models were presented in Figure 5. In this case, four momentous risk factors that predicted IPAs were selected to construct a nomogram based on the stepwise logistic regression model (Figure 6). In the nomogram, the impact of highest attenuation of non-enhanced CT images on the risk of IPA was the highest (100 points), followed by mean attenuation of non-enhanced CT images (25 points), lobulation (18 points) and vacuole (6 points). The following is an example scenario to calculate the total points and predict the possibility of a lesion being an IPA: For a patient with SPN, highest and mean attenuations of non- enhanced CT images are 200 HU (90 points) and −100 HU (20 points) respectively. At the same time, there was not lobulation sign (0 point) or vacuole sign (0 point) on his or her CT images. In total, this patient had approximately 110 points on the nomogram. Theoretically, the possibility of this SPN being an IPA is over 90%.
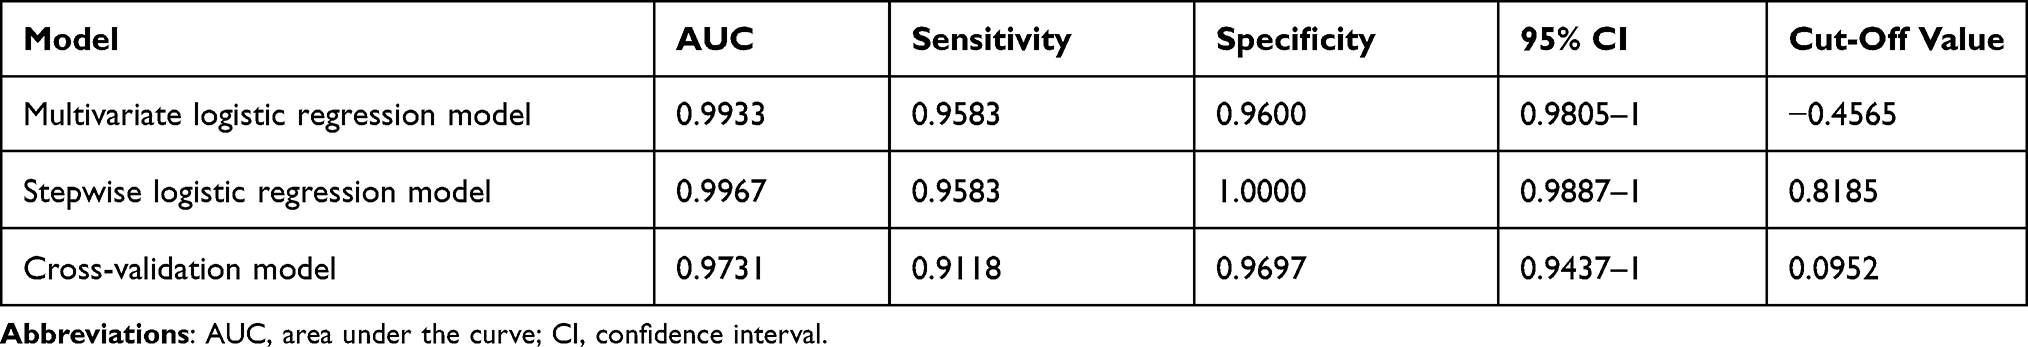 |
Table 5 Comparison and Validation of Different Models |
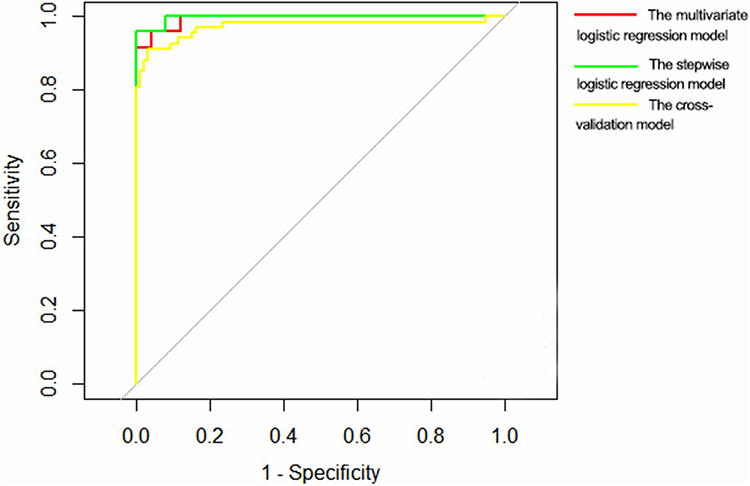 |
Figure 5 Area under the curve (AUC) comparison among different models. The red line represents the multivariate logistic regression model. The green line represents the stepwise logistic regression model. The yellow line represents the cross-validation model. |
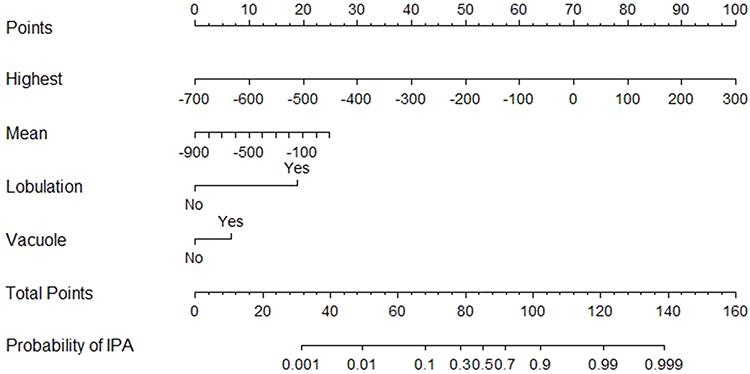 |
Figure 6 Nomogram for predicting IPA. To obtain the nomogram-predicted probability, the patient’s values are located at each axis, and a vertical line is drawn to the “Points” axis to determine the number of points attributed to each variable, obtain the total number of points for all variables, and derive the sum on the “Total Points” line to assess the individual probability of IPA. |
A calibration curve validating the model’s performance is shown in Figure 7, indicating that the probability of IPA in SPNs predicted by the nomogram agreed well with the actual value.
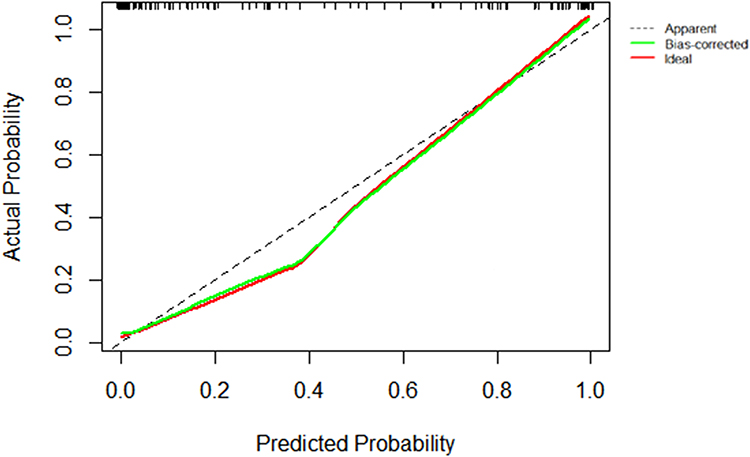 |
Figure 7 Calibration curve reflecting the relationship between predicted and actual probabilities. The x-axis shows the nomogram-predicted probability and the y-axis depicts the actual probability of malignancy. Perfect prediction would correspond to the 45°dashed line. Red line, entire cohort; green line, bias corrected by bootstrapping (B = 200 repetitions), indicating observed nomogram performance. |
Discussion
This study used data from Hebei General Hospital to develop and validate a novel predictive model to assess the risk of IPA in patients who radially presented with SPNs. Patients with high scores need to achieve cure by lobectomy, while those with low scores need sub-lobectomy. Therefore, the model established to distinguish invasive from non-invasive pulmonary adenocarcinoma in SPNs could improve the management and prognosis of patients with lung adenocarcinoma. In the present study, four characteristics, including highest attenuation of non-enhanced CT images, mean attenuation of non-enhanced CT images, lobulation and vacuole, were significant predictors of IPA with SPNs. Importantly, we developed a nomogram to estimate the preoperative patient-specific “risk” of IPA with excellent predictive accuracy.
In lung cancer screening, radiologists usually stratify lung nodules by explaining features such as location, density, diameter, volume, and margins.17 Due to the spread of malignant cells in the lung interstitium, malignant nodules are more likely to have irregular edges and lobulated, sharp or prickly signs.18 Lung adenocarcinoma is the most common histological type of peripheral lung cancer. Once discovered, lung nodules must be evaluated to determine the possibility of malignant transformation and determine treatment recommendations.2–7 The study by Kenji Suzuki et al showed that there was no statistically significant difference in intraoperative and postoperative complications between segmentectomy and lobectomy.19 If patients with surgical indications can predict the pathological type of pulmonary nodules before surgery, then the surgical procedure can be determined before surgery, and intraoperative freezing pathology can be avoided during the operation, thereby reducing the operation time.
On the other hand, this study showed that IPA is more largely related to attenuations, lobulation and vacuole on CT, while less affected by clinical characteristics and tumor markers. This model can help thoracic surgeons choose more reasonable management methods, such as determining the patient’s CT follow-up interval, selecting appropriate surgical method, and developing affordable treatments. According to the National Comprehensive Cancer Network guidelines, high-risk patients should continue undergoing CT scanning in stable condition until they no longer need the final treatment, eg, surgery, chemotherapy and radiotherapy.20 For patients with stage I–II NSCLC, medical history collection, chest CT and physical examination should be conducted every 6 months for 2 to 3 years after surgery, and once a year thereafter. However, a Phase III randomized controlled clinical trial (IFCT-0302) used a different approach. In the first two years, patients were followed up every six months, then yearly until the fifth year. During each follow-up examination, patients underwent clinical examination, chest and abdominal CT scanning and bronchoscopy.21 Therefore, accurate prediction of invasive adenocarcinoma in SPNs could help effectively develop optimal follow-up plans for patients. The nomogram developed in this study can reasonably help clinicians strengthen the hierarchical management of patients.
The present results indicate that attenuation, lobulation and vacuole of the SPN can well predict the severity of lung adenocarcinoma, which reflects tumor transformation from heterogeneous to homogeneous type. As the disease progresses, malignant tumor cells are more likely to diffuse into the lung interstitium and produce irregular lobulation. At the same time, there are vacuoles with more tumor necrotic and mucinous annular cavity structures in the lesion.
Compared with the published studies concentrating on predicting risk factors IPA, our study not only screened variables by using a variety of statistical methods, but we also discussed the effect of predicting the malignant degree of lung cancer on surgical approach.6,7 There are following advantages on this study: Firstly, the predicting model can develop optimal follow-up plans for patients and reduce the effect of radiation to some extent. Secondly, it can make the surgical plan in advance.
This study had several limitations. First, it was a single-center retrospective study, and only lesions that underwent surgery were chosen, indicating selection bias. The accuracy of the developed predictive model should be confirmed in multicenter prospective studies, which could enable the use of the current nomogram as a clinical tool for predicting IPA. Secondly, the imaging data extracted in this study are all manually measured, which is labor-intensive and time-consuming; if an automated method for extracting imaging data can be found, a lot of manpower and time costs can be reduced. Thirdly, the sample was small in the growth nomogram study and needed external validation; more importantly, more follow-up samples are needed to develop a 5-year growth predictive nomogram for SPNs.
Factors such as smoking history, malignancy history and family history were not included. This may be related to the low positive rate in the selected patients. Previous evidence suggests that the likelihood of malignancy increases with nodule diameter.22 This study did not include such factors due to increasing health awareness of the public in recent years with fewer patients with lung cancer developing to the next stage. Most tumor markers had less clinical significance in this study, which in part reflects the early stage of lesions in most patients.
Conclusion
In conclusion, we have established and validated a novel and easy-to-use nomogram for predicting the risk of invasive adenocarcinoma in patients with SPNs. The model can accurately and effectively identify invasive adenocarcinomas and help thoracic surgeons to accurately develop individualized treatment programs for patients.
Abbreviations
CT, Computed Tomography; SPN, solitary pulmonary nodule; AAH, atypical adenomatous hyperplasia; AIS, adenocarcinoma in situ; MIA, minimally invasive adenocarcinoma; IPA, invasive pulmonary adenocarcinoma; HU, Hounsfield unit; BMI, body mass index; CEA, carcinoembryonic antigen; SCC, squamous cell carcinoma antigen; NSE, neuron specific enolase; CYFRA21-1, cytokeratin 19 fragment; ROI, regions of interest; NSCLC, non-small cell lung cancer; AUC, area under the curve; AIC, the Akaike information criterion; LASSO, the least absolute shrinkage and selection operator; ROC, receiver operating characteristic; CI, confidence interval; OR, odds ratio.
Acknowledgments
This work was supported by governmental funding for specialist capacity building and specialist leader training projects of department of finance and health commission of hebei province (No. [2018]34).
Disclosure
The authors report no conflicts of interest in this work.
References
1. She Y, Zhao L, Dai C, et al. Development and validation of a nomogram to estimate the pretest probability of cancer in Chinese patients with solid solitary pulmonary nodules: a multi-institutional study. J Surg Oncol. 2017;116(6):756–762. doi:10.1002/jso.24704
2. Wu YJ, Liu YC, Liao CY, Tang EK, Wu FZ. A comparative study to evaluate CT-based semantic and radiomic features in preoperative diagnosis of invasive pulmonary adenocarcinomas manifesting as subsolid nodules. Sci Rep. 2021;11(1):66. doi:10.1038/s41598-020-79690-4
3. Chen X, Feng B, Chen Y, et al. A CT-based radiomics nomogram for prediction of lung adenocarcinomas and granulomatous lesions in patient with solitary sub-centimeter solid nodules. Cancer Imaging. 2020;20(1):45. doi:10.1186/s40644-020-00320-3
4. Tang EK, Chen CS, Wu CC, et al. Natural history of persistent pulmonary subsolid nodules: long-term observation of different interval growth. Heart Lung Circ. 2019;28(11):1747–1754. doi:10.1016/j.hlc.2018.08.015
5. Hsu HT, Tang EK, Wu MT, et al. Modified lung-RADS improves performance of screening LDCT in a population with high prevalence of non-smoking-related lung cancer. Acad Radiol. 2018;25(10):1240–1251. doi:10.1016/j.acra.2018.01.012
6. Wu FZ, Chen PA, Wu CC, et al. Semiquantative visual assessment of sub-solid pulmonary nodules <==3 cm in differentiation of lung adenocarcinoma spectrum. Sci Rep. 2017;7(1):15790. doi:10.1038/s41598-017-16042-9
7. Wu FZ, Huang YL, Wu CC, et al. Assessment of selection criteria for low-dose lung screening CT among Asian ethnic groups in Taiwan: from mass screening to specific risk-based screening for non-smoker lung cancer. Clin Lung Cancer. 2016;17(5):e45–e56. doi:10.1016/j.cllc.2016.03.004
8. Travis WD, Brambilla E, Noguchi M, et al. International Association for the Study of Lung Cancer/American Thoracic Society/European Respiratory Society: international multidisciplinary classification of lung adenocarcinoma: executive summary. Proc Am Thorac Soc. 2011;8(5):381–385. doi:10.1513/pats.201107-042ST
9. Wang L, Shen W, Xi Y, Liu S, Zheng D, Jin C. Nomogram for predicting the risk of invasive pulmonary adenocarcinoma for pure ground-glass nodules. Ann Thorac Surg. 2018;105(4):1058–1064. doi:10.1016/j.athoracsur.2017.11.012
10. Huang L, Lin W, Xie D, et al. Development and validation of a preoperative CT-based radiomic nomogram to predict pathology invasiveness in patients with a solitary pulmonary nodule: a machine learning approach, multicenter, diagnostic study. Eur Radiol. 2021:32(3):1983–1996.
11. Feng B, Chen X, Chen Y, et al. Differentiating minimally invasive and invasive adenocarcinomas in patients with solitary sub-solid pulmonary nodules with a radiomics nomogram. Clin Radiol. 2019;74(7):570e571–570 e511. doi:10.1016/j.crad.2019.03.018
12. Qiu T, Ru X, Yin K, Yu J, Song Y, Wu J. Two nomograms based on CT features to predict tumor invasiveness of pulmonary adenocarcinoma and growth in pure GGN: a retrospective analysis. Jpn J Radiol. 2020;38(8):761–770. doi:10.1007/s11604-020-00957-x
13. Okamura K, Takayama K, Izumi M, Harada T, Furuyama K, Nakanishi Y. Diagnostic value of CEA and CYFRA 21-1 tumor markers in primary lung cancer. Lung Cancer. 2013;80(1):45–49. doi:10.1016/j.lungcan.2013.01.002
14. Primrose JN, Perera R, Gray A, et al. Effect of 3 to 5 years of scheduled CEA and CT follow-up to detect recurrence of colorectal cancer: the FACS randomized clinical trial. JAMA. 2014;311(3):263–270. doi:10.1001/jama.2013.285718
15. Yang Q, Zhang P, Wu R, Lu K, Zhou H. Identifying the best marker combination in CEA, CA125, CY211, NSE, and SCC for lung cancer screening by combining ROC curve and logistic regression analyses: Is it feasible? Dis Markers. 2018;2018:2082840. doi:10.1155/2018/2082840
16. Song X, Wang S, Wang Z, Cao WJ, Chen FJN. Serum CYFRA21-1 as an effective tumor biomarker for patients with nasopharyngeal carcinoma. Neoplasma. 2015;62(1):124–129. doi:10.4149/neo_2015_016
17. Liu J, Xu H, Qing H, et al. Comparison of radiomic models based on low-dose and standard-dose CT for prediction of adenocarcinomas and benign lesions in solid pulmonary nodules. Front Oncol. 2020;10:634298. doi:10.3389/fonc.2020.634298
18. Feng B, Chen X, Chen Y, et al. Solitary solid pulmonary nodules: a CT-based deep learning nomogram helps differentiate tuberculosis granulomas from lung adenocarcinomas. Eur Radiol. 2020;30(12):6497–6507. doi:10.1007/s00330-020-07024-z
19. Suzuki K, Saji H, Aokage K, et al. Comparison of pulmonary segmentectomy and lobectomy: safety results of a randomized trial. J Thorac Cardiovasc Surg. 2019;158(3):895–907. doi:10.1016/j.jtcvs.2019.03.090
20. Duan XQ, Wang XL, Zhang LF, et al. Establishment and validation of a prediction model for the probability of malignancy in solid solitary pulmonary nodules in northwest China. J Surg Oncol. 2021;123(4):1134–1143. doi:10.1002/jso.26356
21. Liu G, Xu Z, Zhang Y, et al. Machine-learning-derived nomogram based on 3D radiomic features and clinical factors predicts progression-free survival in lung adenocarcinoma. Front Oncol. 2021;11:692329. doi:10.3389/fonc.2021.692329
22. Gurney JW, Lyddon DM, McKay JA. Determining the likelihood of malignancy in solitary pulmonary nodules with bayesian analysis. Part II. Application. Radiology. 1993;186(2):415–422. doi:10.1148/radiology.186.2.8421744
 © 2022 The Author(s). This work is published and licensed by Dove Medical Press Limited. The
full terms of this license are available at https://www.dovepress.com/terms
and incorporate the Creative Commons Attribution
- Non Commercial (unported, 3.0) License.
By accessing the work you hereby accept the Terms. Non-commercial uses of the work are permitted
without any further permission from Dove Medical Press Limited, provided the work is properly
attributed. For permission for commercial use of this work, please see paragraphs 4.2 and 5 of our Terms.
© 2022 The Author(s). This work is published and licensed by Dove Medical Press Limited. The
full terms of this license are available at https://www.dovepress.com/terms
and incorporate the Creative Commons Attribution
- Non Commercial (unported, 3.0) License.
By accessing the work you hereby accept the Terms. Non-commercial uses of the work are permitted
without any further permission from Dove Medical Press Limited, provided the work is properly
attributed. For permission for commercial use of this work, please see paragraphs 4.2 and 5 of our Terms.