Back to Journals » Journal of Blood Medicine » Volume 17
Development and Validation of a Novel Thrombosis Prediction Model for Adult Immune Thrombocytopenia (ITP-THROMBO)
Authors Yan H, Hu X, Zhu L, Jiang Y, Luo C, Lv M, Wang Y, Tong J ![]() , Zheng C
, Zheng C ![]()
Received 1 October 2025
Accepted for publication 10 January 2026
Published 21 January 2026 Volume 2026:17 570135
DOI https://doi.org/10.2147/JBM.S570135
Checked for plagiarism Yes
Review by Single anonymous peer review
Peer reviewer comments 2
Editor who approved publication: Professor Chang Kim
Huiling Yan,1 Xing Hu,1 Lijun Zhu,1 Yuhan Jiang,2 Chen Luo,2 Mengya Lv,1 Yan Wang,3 Juan Tong,1 Changcheng Zheng1
1Department of Hematology, The First Affiliated Hospital of USTC, Division of Life Sciences and Medicine, University of Science and Technology of China, Hefei, People’s Republic of China; 2Department of Hematology, Anhui Provincial Hospital, WanNan Medical College, Wuhu, People’s Republic of China; 3Department of Laboratory Medicine, The First Affiliated Hospital of USTC, Division of Life Sciences and Medicine, University of Science and Technology of China, Hefei, People’s Republic of China
Correspondence: Changcheng Zheng, Department of Hematology, the First Affiliated Hospital of USTC, Division of Life Sciences and Medicine, University of Science and Technology of China, Lujiang Road No. 17, Hefei, 230001, People’s Republic of China, Tel/Fax +86-551-62282990, Email [email protected]
Purpose: Immune thrombocytopenia (ITP) is an autoimmune disorder characterized by bleeding, yet paradoxically, it can also predispose patients to thrombotic events; therefore, investigating high-risk factors for thrombosis in ITP patients and developing a predictive model is essential.
Patients and Methods: A total of 1112 patients were diagnosed with ITP between January 2018 and December 2023. Excluding 216 patients under the age of 18, a total of 896 adult ITP patients were included in this study (of whom 101 developed thrombosis). Patients were randomly allocated to the training set (n=628) and validation set (n=268) in a 7:3 ratio.
Results: Atrial fibrillation, peripheral vascular disease, venous thromboembolism history, pneumonia < 1 month, cerebrovascular events history, and D-dimer levels were identified as predictive factors for thrombosis in ITP patients. The six factors formed 57 unique combinations, providing robust predictive power for thrombosis in ITP under different clinical scenarios. In the training set, the area under the curve (AUC) for the nomogram was 0.656 (95% CI: 0.578– 0.735) to 0.931 (95% CI: 0.902– 0.960) and the AUC in the validation set was 0.539 (95% CI: 0.425– 0.653) to 0.893 (95% CI: 0.828– 0.957). The calibration curve demonstrated good concordance between the model’s predicted probabilities and actual observed probabilities, and the decision curve analysis indicated that the model had significant clinical utility.
Conclusion: This cohort study developed a simple and practical predictive model (ITP-THROMBO) for estimating thrombosis risk in ITP patients; this model facilitates rapid identification of ITP patients at high thrombotic risk, enabling timely decision-making support for personalized treatment planning.
Keywords: immune thrombocytopenia, ITP, thrombosis, prediction model
Introduction
Immune thrombocytopenia (ITP) is an autoimmune hemorrhagic disorder characterized by antiplatelet autoantibodies and T lymphocyte-mediated platelet destruction. ITP has traditionally been regarded as a disease centered on bleeding risk. However, recent large-scale cohort studies have revealed a significant thrombotic predisposition, exemplified by Danish nationwide data1 demonstrating an arterial thrombosis (AT) incidence of 11.37 per 1000 person-years (representing a 32% increase compared to the general population), and a UK study2 confirming a 58% elevated risk of venous thromboembolism (VTE), and cardiovascular events (including thrombosis) constitute one of the common causes of death in ITP patients.3 This paradoxical phenomenon arises from multifactorial interactions involving disease-intrinsic mechanisms, treatment-related factors, and patient-specific determinants. Disease-intrinsic mechanisms include hyperactivation of young platelets (characterized by elevated P-selectin expression), endothelial injury (manifested as von Willebrand factor (vWF) /ADAMTS13 imbalance), a hypercoagulable state (marked by elevated coagulation factor VIII and plasminogen activator inhibitor-1 (PAI-1)-mediated suppression of fibrinolysis), and microparticle-related pathways (involving platelet-derived microparticles that expose phosphatidylserine and promote thrombin generation); treatment-related factors comprise thrombopoietin receptor agonists (TPO-RAs) associated with a 1.73-fold increased thrombosis risk,4 which may be attributed to enhanced platelet activation, increased thrombin generation, and heightened megakaryocyte activity; splenectomy conferring approximately 4-fold higher long-term VTE risk,5 primarily due to platelet count elevation, loss of splenic clearance function, and blood hyperviscosity; and glucocorticoids inducing hypercoagulability via upregulation of factor VIII, vWF, and PAI-1, leading to a prothrombotic and hypofibrinolytic state; patient-specific determinants feature a 6.11-fold surge in thrombosis risk among lupus anticoagulant (LA)-positive individuals with antiphospholipid antibodies (aPL),6 as well as doubled thrombotic risk in patients aged >60 years with comorbid cardiovascular diseases.7 A French cohort study demonstrated that ITP treatments (including glucocorticoids, intravenous immunoglobulin (IVIg), and TPO-RAs) were associated with elevated VTE risk. Additionally, advanced age, prior VTE, and cancer history correlated significantly with VTE, while male sex and history of cardiovascular disease correlated with AT.8
Numerous models have been developed for thrombosis prediction, such as the Kucher, Padua Prediction Score, and International Medical Prevention Registry on Venous Thromboembolism (IMPROVE) for VTE, alongside the CHADS2 score (2001) for AT. However, current guidelines lack dedicated risk assessment tools for ITP, as conventional thrombosis scores fail to incorporate ITP-specific risk factors, resulting in limited sensitivity and specificity for predicting thrombotic events in ITP patients. Although Liang et al recently constructed a thrombotic prediction model integrating elevated D-dimer, low platelet count, and high Padua score, its reliability is diminished by two critical limitations, including the abnormally high thrombosis incidence 33.14% (116/350) in their cohort significantly exceeds the AT and VTE rates reported in prior clinical studies; and the model’s suboptimal discriminative capacity (AUC < 0.7) further compromises its clinical utility.9
This study conducted a retrospective analysis of baseline characteristics and laboratory parameters in 896 ITP patients, analyzing high-risk factors for thrombotic events, with the aim of constructing an ITP-THROMBO prediction model to provide an evidence-based basis for individualized thromboprophylaxis in ITP patients.
Material and Methods
Patients
This study retrospectively collected baseline clinical characteristics, medication histories, and laboratory parameters from ITP patients hospitalized at the First Affiliated Hospital of the University of Science and Technology of China between January 2018 and December 2023. For patients who developed thrombotic events, data from their first hospitalization for thrombosis were extracted; for those without thrombotic events, data from their initial hospitalization during this period were analyzed. The diagnosis of ITP complies with the criteria of the International Working Group (IWG);10 and adult patients aged ≥18 years meeting these criteria were enrolled. Patients aged <18 years or with secondary thrombocytopenia due to non-hematologic malignancies, chemotherapy-induced myelosuppression, hypersplenism, liver cirrhosis, aplastic anemia, myelodysplastic syndromes (MDS), multiple myeloma (MM), lymphoma, or acute leukemia were excluded. Ultimately, 896 adult ITP patients were included in this cohort (Figure 1).
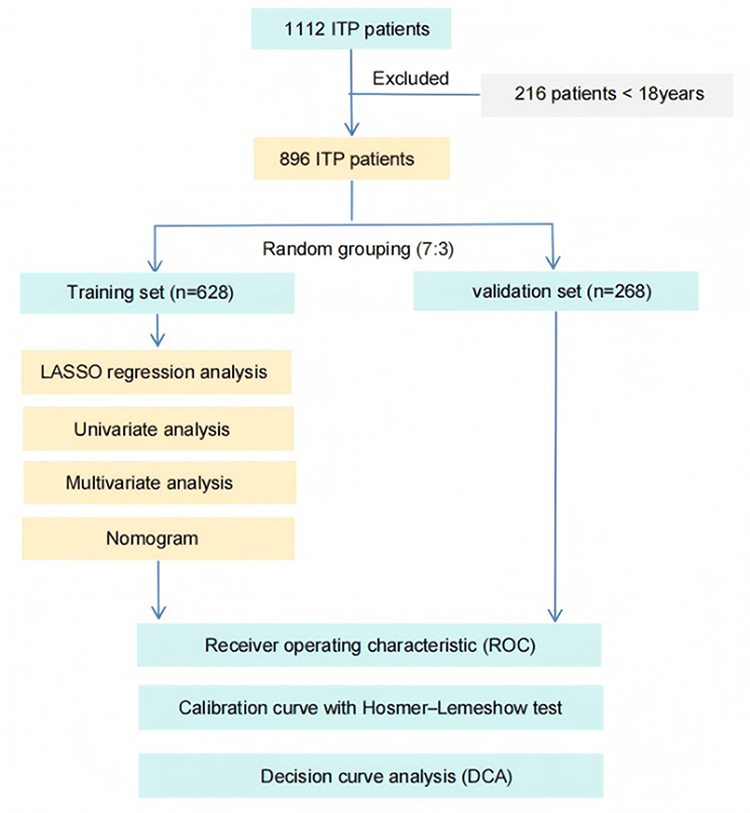 |
Figure 1 Flowchart of this study. |
In this study, venous thrombotic events were primarily confirmed based on imaging evidence (such as ultrasound, Computed Tomography, Magnetic Resonance Imaging, etc)., while arterial thrombotic events, such as cerebral infarction, were diagnosed mainly based on patients’ symptoms, signs, and examinations like cranial Computed Tomography or Magnetic Resonance Imaging. Acute coronary syndrome was comprehensively determined according to electrocardiogram findings and laboratory indicators. The study protocol was approved by the Ethics Committee of the First Affiliated Hospital of University of Science and Technology of China (approval number: 2025-RE-181) and was conducted in accordance with the Declaration of Helsinki; the written informed consent was waived due to the retrospective nature of the review, and all the data was anonymized and maintained with confidentiality.
Clinical Data Collection
Clinical data were comprehensively documented through the hospital’s electronic medical record system, encompassing general patient characteristics (including height, weight, gender, age, and smoking history), comorbidities (such as diabetes mellitus, hypertension, and prior VTE, etc), medication exposures [specifically glucocorticoids, recombinant human thrombopoietin (rhTPO), TPO-RAs, rituximab, IVIg—with medication histories for the thrombosis group captured within one month before thrombotic events occurrence, and for the non-thrombosis group recorded within one month during the initial hospitalization], and laboratory parameters (including red blood cell count (RBC), white blood cell count (WBC), platelet count (PLT), and D-dimer (D-D), etc).
Predictors Screening, Nomogram Construction, and Model Validation
A total of 896 patients were enrolled and randomly allocated to training and validation cohorts in a 7:3 ratio, and stratified by thrombotic events status into thrombosis and non-thrombosis groups. After consolidating clinically correlated variables (including renal insufficiency incorporating dialysis status, liver disease encompassing fatty liver and diffuse Liver Lesions, cardiovascular events comprising history of myocardial infarction, cardiac dysfunction, and coronary artery disease, and cerebrovascular events containing history of cerebral hemorrhage and/ or infarction), forty-one variables were analyzed: age, sex, body mass index (BMI), smoking history, hypertension, diabetes mellitus, renal insufficiency, cardiovascular events, liver disease, atrial fibrillation, cerebrovascular event history, peripheral vascular disease, central venous catheter <1 month, venous thromboembolism history, surgery history <6 months, fracture history <6 months, sepsis <1 month, pneumonia <1 month, Evans syndrome, antiphospholipid syndrome, systemic lupus erythematosus, sjögren’s syndrome, hepatitis b virus/hepatitis c virus (HBV/HCV), human immunodeficiency virus (HIV), RBC, WBC, PLT, hemoglobin (HGB), neutrophil count, lymphocyte count, D-D, fibrinogen (FIB), prothrombin time (PT), activated partial thromboplastin time (APTT), thrombin time (TT), alanine aminotransferase (ALT), total bilirubin (TBIL), direct bilirubin (DBIL), indirect bilirubin (IBIL), creatinine (Cr), albumin (ALB).
For predictor screening, LASSO regression11 was applied to the training cohort and selected 16 variables; and subsequent univariate analysis (P <0.05) refined the set to 14 variables for multivariate modeling, and ultimately identified 6 thrombotic event predictors to construct the nomogram.
Model validations included discrimination assessment via receiver operating characteristic (ROC) curves (area under the curve, AUC=0.5 indicating no discrimination; higher proximity to 1 reflecting superior discrimination12); calibration evaluation using 500 bootstrap resamples and Hosmer-Lemeshow test (P >0.05 indicating adequate calibration between predicted and observed probabilities13); clinical utility analysis via decision curve analysis (DCA), benchmarking the nomogram against default strategies (“Treat All” and “Treat None”14) with the superior net benefit region defining clinical usefulness; and visualization of medication-related predictors through forest plots derived from univariate analysis results.
Overall, the LASSO regression was used for feature selection, a nomogram was developed, and model performance was assessed using metrics like the AUC and DCA.
Statistical Analysis
Categorical variables (including gender, smoking history, hypertension, diabetes mellitus, atrial fibrillation, venous thromboembolism history, and peripheral vascular disease) were expressed as frequencies and percentages, with intergroup comparisons performed using chi-square or Fisher’s exact tests. Continuous variables (such as Age, BMI, WBC, RBC, PLT, HGB, and D-D) underwent normality testing via Kolmogorov–Smirnov tests; those conforming to normal distribution were reported as mean ± standard deviation and compared via independent samples t-test, while non-normally distributed variables were presented as median (interquartile range, IQR) and analyzed using Mann–Whitney U-test. Association strengths were quantified by Cramer’s V15 for categorical variables (V≤0.1 indicating weak association,≥0.3 strong association, and intermediate values moderate association) and Cohen’s d16 for continuous variables (d ≤0.2: small effect size; 0.2 to ≤0.5: moderate; 0.5 to ≤0.8: large; >0.8: very large effect size). Medication-related predictors for ITP patients were screened via univariate logistic regression analysis. In the multivariate analysis, we employed binary logistic regression. Variables exhibiting ≥20% missing data were excluded, and remaining missing values were addressed through multiple imputation methods, specifically utilizing the Predictive Mean Matching (PMM) algorithm. As a non-parametric approach suited for continuous variables, PMM operates by identifying observed data points with the closest predicted means and randomly selecting one of them for imputation. This process is effective in preserving the original distributional characteristics of the data. A two-sided P-value <0.05 was considered statistically significant throughout this study.
Results
ITP Patients Characteristics
A total of 896 ITP patients were enrolled, comprising 470 primary ITP and 426 secondary ITP cases, including 101 patients experiencing thrombotic events. Among the 101 ITP patients who experienced thrombotic events, their initial visits at the time of thrombosis occurred across 20 different clinical departments (Supplemental Table 1); notably, 34 of these patients were found to have thrombocytopenia during their visit for thrombotic symptoms and were subsequently diagnosed with ITP through consultation with hematologists or retrospective analysis by our research team. In the training set, there were 340 patients with primary ITP and 288 with secondary ITP. According to the disease course, the cohort included 446 newly diagnosed patients, 35 with persistent ITP, and 147 with chronic ITP. In the validation set, there were 130 patients with primary ITP and 138 with secondary ITP. The validation set comprised 187 newly diagnosed patients, 17 with persistent ITP, and 64 with chronic ITP.
Baseline characteristic comparisons between thrombosis and non-thrombosis groups revealed higher proportions of the thrombosis group for male sex, advanced age, smoking history, hypertension, diabetes mellitus, renal insufficiency (including dialysis), atrial fibrillation, venous thromboembolism history, myocardial infarction history, cardiac dysfunction, coronary artery disease, cerebral hemorrhage, cerebral infarction history, peripheral vascular disease, central venous catheter < 1 month, surgery history < 6 months, sepsis < 1 month, and pneumonia < 1 month, whereas Sjögren’s syndrome prevalence was lower compared to the non-thrombosis group (Supplemental Table 2). Laboratory parameter comparisons demonstrated more elevated WBC, PLT, D-D, FIB, PT, APTT, ALT, TBIL, DBIL, IBIL, and Cr, alongside more reduced ALB levels in the thrombosis group (Supplemental Table 3). Significant differences were also observed in systemic lupus erythematosus (SLE) activity markers, anticardiolipin antibody profiles, and antinuclear antibody profiles between groups (Supplemental Table 3). Continuous variables with <20% missing data exhibited no statistically significant differences after multiple imputation compared to original data (P>0.05) (Supplemental Table 4).
Clinical Characteristics Between Training and Validation Sets
All 896 patients were randomly allocated to training (n=628) and validation sets (n=268) in a 7:3 ratio, with 71 and 30 thrombotic cases identified in each set respectively. In the training set, we observed 34 venous thrombotic events, 24 arterial thrombotic events, and 13 combined arterial-venous thrombotic events. The validation set contained 18 venous, 10 arterial, and 2 combined events. Baseline characteristics in the thrombosis subgroup of the training set demonstrated significantly higher proportions of male sex, advanced age, smoking history, hypertension, diabetes mellitus, renal insufficiency, atrial fibrillation, venous thromboembolism history, cardiovascular events, cerebrovascular events, peripheral vascular disease, central venous catheter < 1 month, surgery history < 6 months, and sepsis or pneumonia < 1 month compared to the non-thrombosis subgroup (Table 1); laboratory parameter comparisons revealed elevated PLT, D-D, FIB, PT, APTT, TBIL, DBIL, and Cr, alongside reduced ALB in the thrombosis subgroup (Table 2). Except for diabetes (Cramer’s V=0.114), central venous catheter < 1 month (Cramer’s V=0.072), dialysis (Cramer’s V=0.069), and FIB (Cohen’s d=0.12) (Supplemental Table 5), no statistically significant differences (P >0.05) were observed between the training and validation sets for all other variables, confirming comparability between the two cohorts.
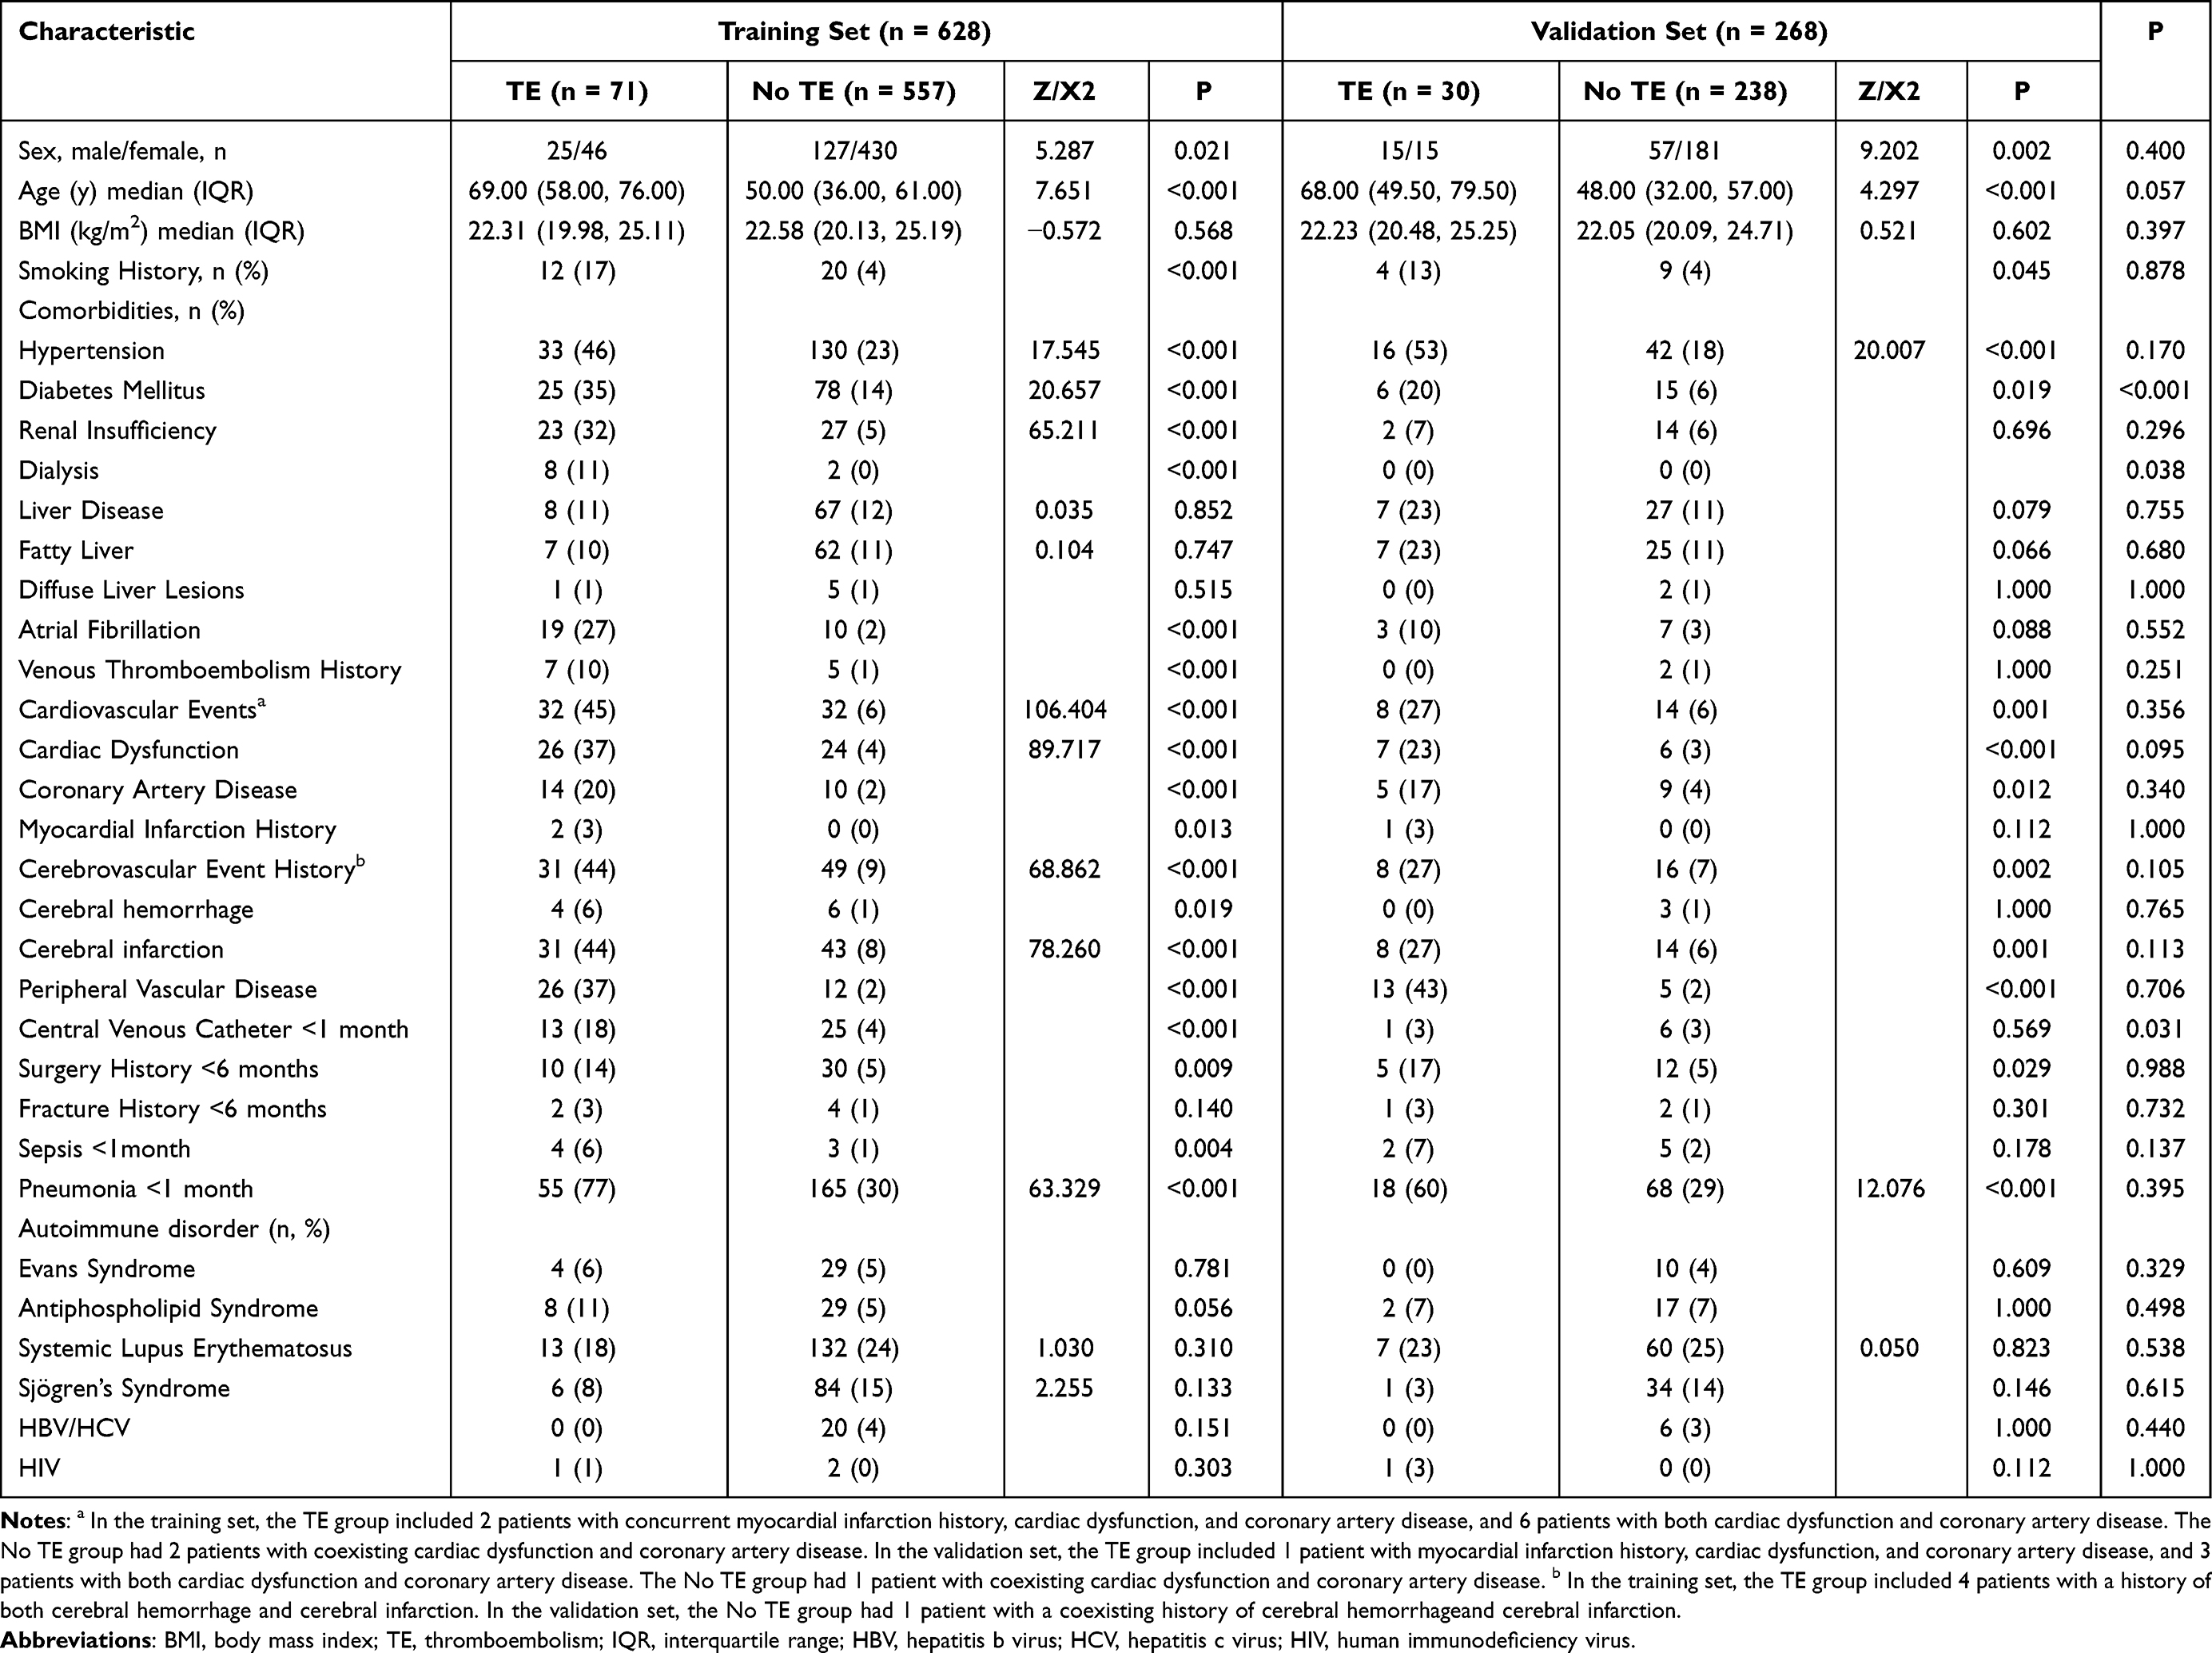 |
Table 1 Baseline Characteristics of Participants in Training and Validation Set |
 |
Table 2 Laboratory Parameters of Participants in Training and Validation Set |
Selection of Patient-Specific Predictors
After exclusion of variables with ≥20% missing values, 41 variables were ultimately selected for preliminary screening. Initial variable selection was performed using LASSO regression in the training set, which identified 16 non-zero coefficient variables at the optimal λ value: age, diabetes mellitus, renal insufficiency, atrial fibrillation, cardiovascular events, peripheral vascular disease, cerebrovascular event history, central venous catheter < 1 month, venous thromboembolism history, surgery history < 6 months, pneumonia < 1 month, antiphospholipid syndrome, D-D, PT, ALT, and Cr (Supplemental Figure 1). Integrating results from LASSO and univariable analyses of the training set, 14 candidate variables were retained for multivariable analysis, with exclusion of antiphospholipid syndrome and ALT due to non-significance in univariable testing. Following multivariable regression, six independent predictors were ultimately confirmed: atrial fibrillation, peripheral vascular disease, venous thromboembolism history, pneumonia <1 month, cerebrovascular event history, and D-D) (Table 3).
 |
Table 3 Multivariate Logistic Regression Analysis |
Selection of Medication Predictive Factors
Among 770 ITP patients receiving corticosteroid-based treatment, 53 developed thrombosis; of these, 110 patients treated with corticosteroid-monotherapy had 19 thrombotic events. A total of 391 patients received thrombopoietic agent-based treatment (rhTPO/TPO-RAs), with thrombosis occurring in 14 cases; specifically, among 35 patients receiving thrombopoietic agents-monotherapy (including switches between rhTPO and TPO-RAs), 5 developed thrombosis (including 13 on rhTPO monotherapy with 1 thrombosis and 10 on TPO-RA monotherapy with 4 thrombosis). Rituximab-based treatment was administered to 34 patients, with only 1 thrombosis occurring. Among 401 patients receiving other immunosuppressant-based therapies (including hydroxychloroquine, cyclosporine, mycophenolate mofetil, cyclophosphamide, etc), 27 developed thrombosis. All patients were randomly allocated to training and validation sets in a 7:3 ratio, and no statistically significant differences in thrombosis incidence were observed among treatment groups within the training set (P≥ 0.05 for all comparisons) (Supplemental Figure 2).
Construction of Predictive Models
Based on the six key variables identified through multivariable analysis, a nomogram model for thrombosis risk prediction in ITP patients (ITP-THROMBO model) was constructed. This nomogram visually demonstrates the individual contribution of each variable to the predicted thrombosis risk. According to the model, D-D was identified as the strongest predictor, followed by venous thromboembolism history, peripheral vascular disease, atrial fibrillation, pneumonia < 1 month, and cerebrovascular event history (Figure 2a).
 |
Figure 2 The nomogram and the receiver operating characteristic (ROC) curves. A nomogram incorporating atrial fibrillation, peripheral vascular disease, venous thromboembolism history, cerebrovascular event history, pneumonia within the past month and D-D (D-dimer) predicts the probability of thrombosis formation (a). The ITP-THROMBO prediction model, which integrates six high-risk factors, achieved an AUC of 0.931 (95% CI: 0.902–0.960) in the training set (b) and 0.893 (95% CI: 0.828–0.957) in the validation set (c). |
Evaluation of Predictive Models
The discriminative ability of the nomogram was evaluated using ROC curves.The ITP-THROMBO prediction model, incorporating six high-risk factors, demonstrated an AUC value of 0.931 (95% CI: 0.902–0.960) in the training set and 0.893 (95% CI: 0.828–0.957) in the validation set (Figure 2b and c). And the ROC curves for each variable are sequentially presented in Supplemental Figure 3. The AUC values for both the nomogram model and individual variables combinations in the training and validation sets are summarized in Table 4; the six factors formed 57 unique combinations, providing robust predictive power for thrombosis in ITP under different clinical scenarios. Calibration curves in both sets showed no significant deviation between predicted and observed thrombosis probabilities, as evidenced by Hosmer-Lemeshow test results (training set: χ2= 6.68, P = 0.57; validation set: χ2= 7.70, P = 0.46; Figure 3a and b). DCA curves further confirmed the clinical utility of the model, with the nomogram’s net benefit curve substantially exceeding the “treat-all” and “treat-none” reference lines across most threshold probabilities in both training and validation sets, indicating enhanced clinical net benefit (Figure 3c and d).
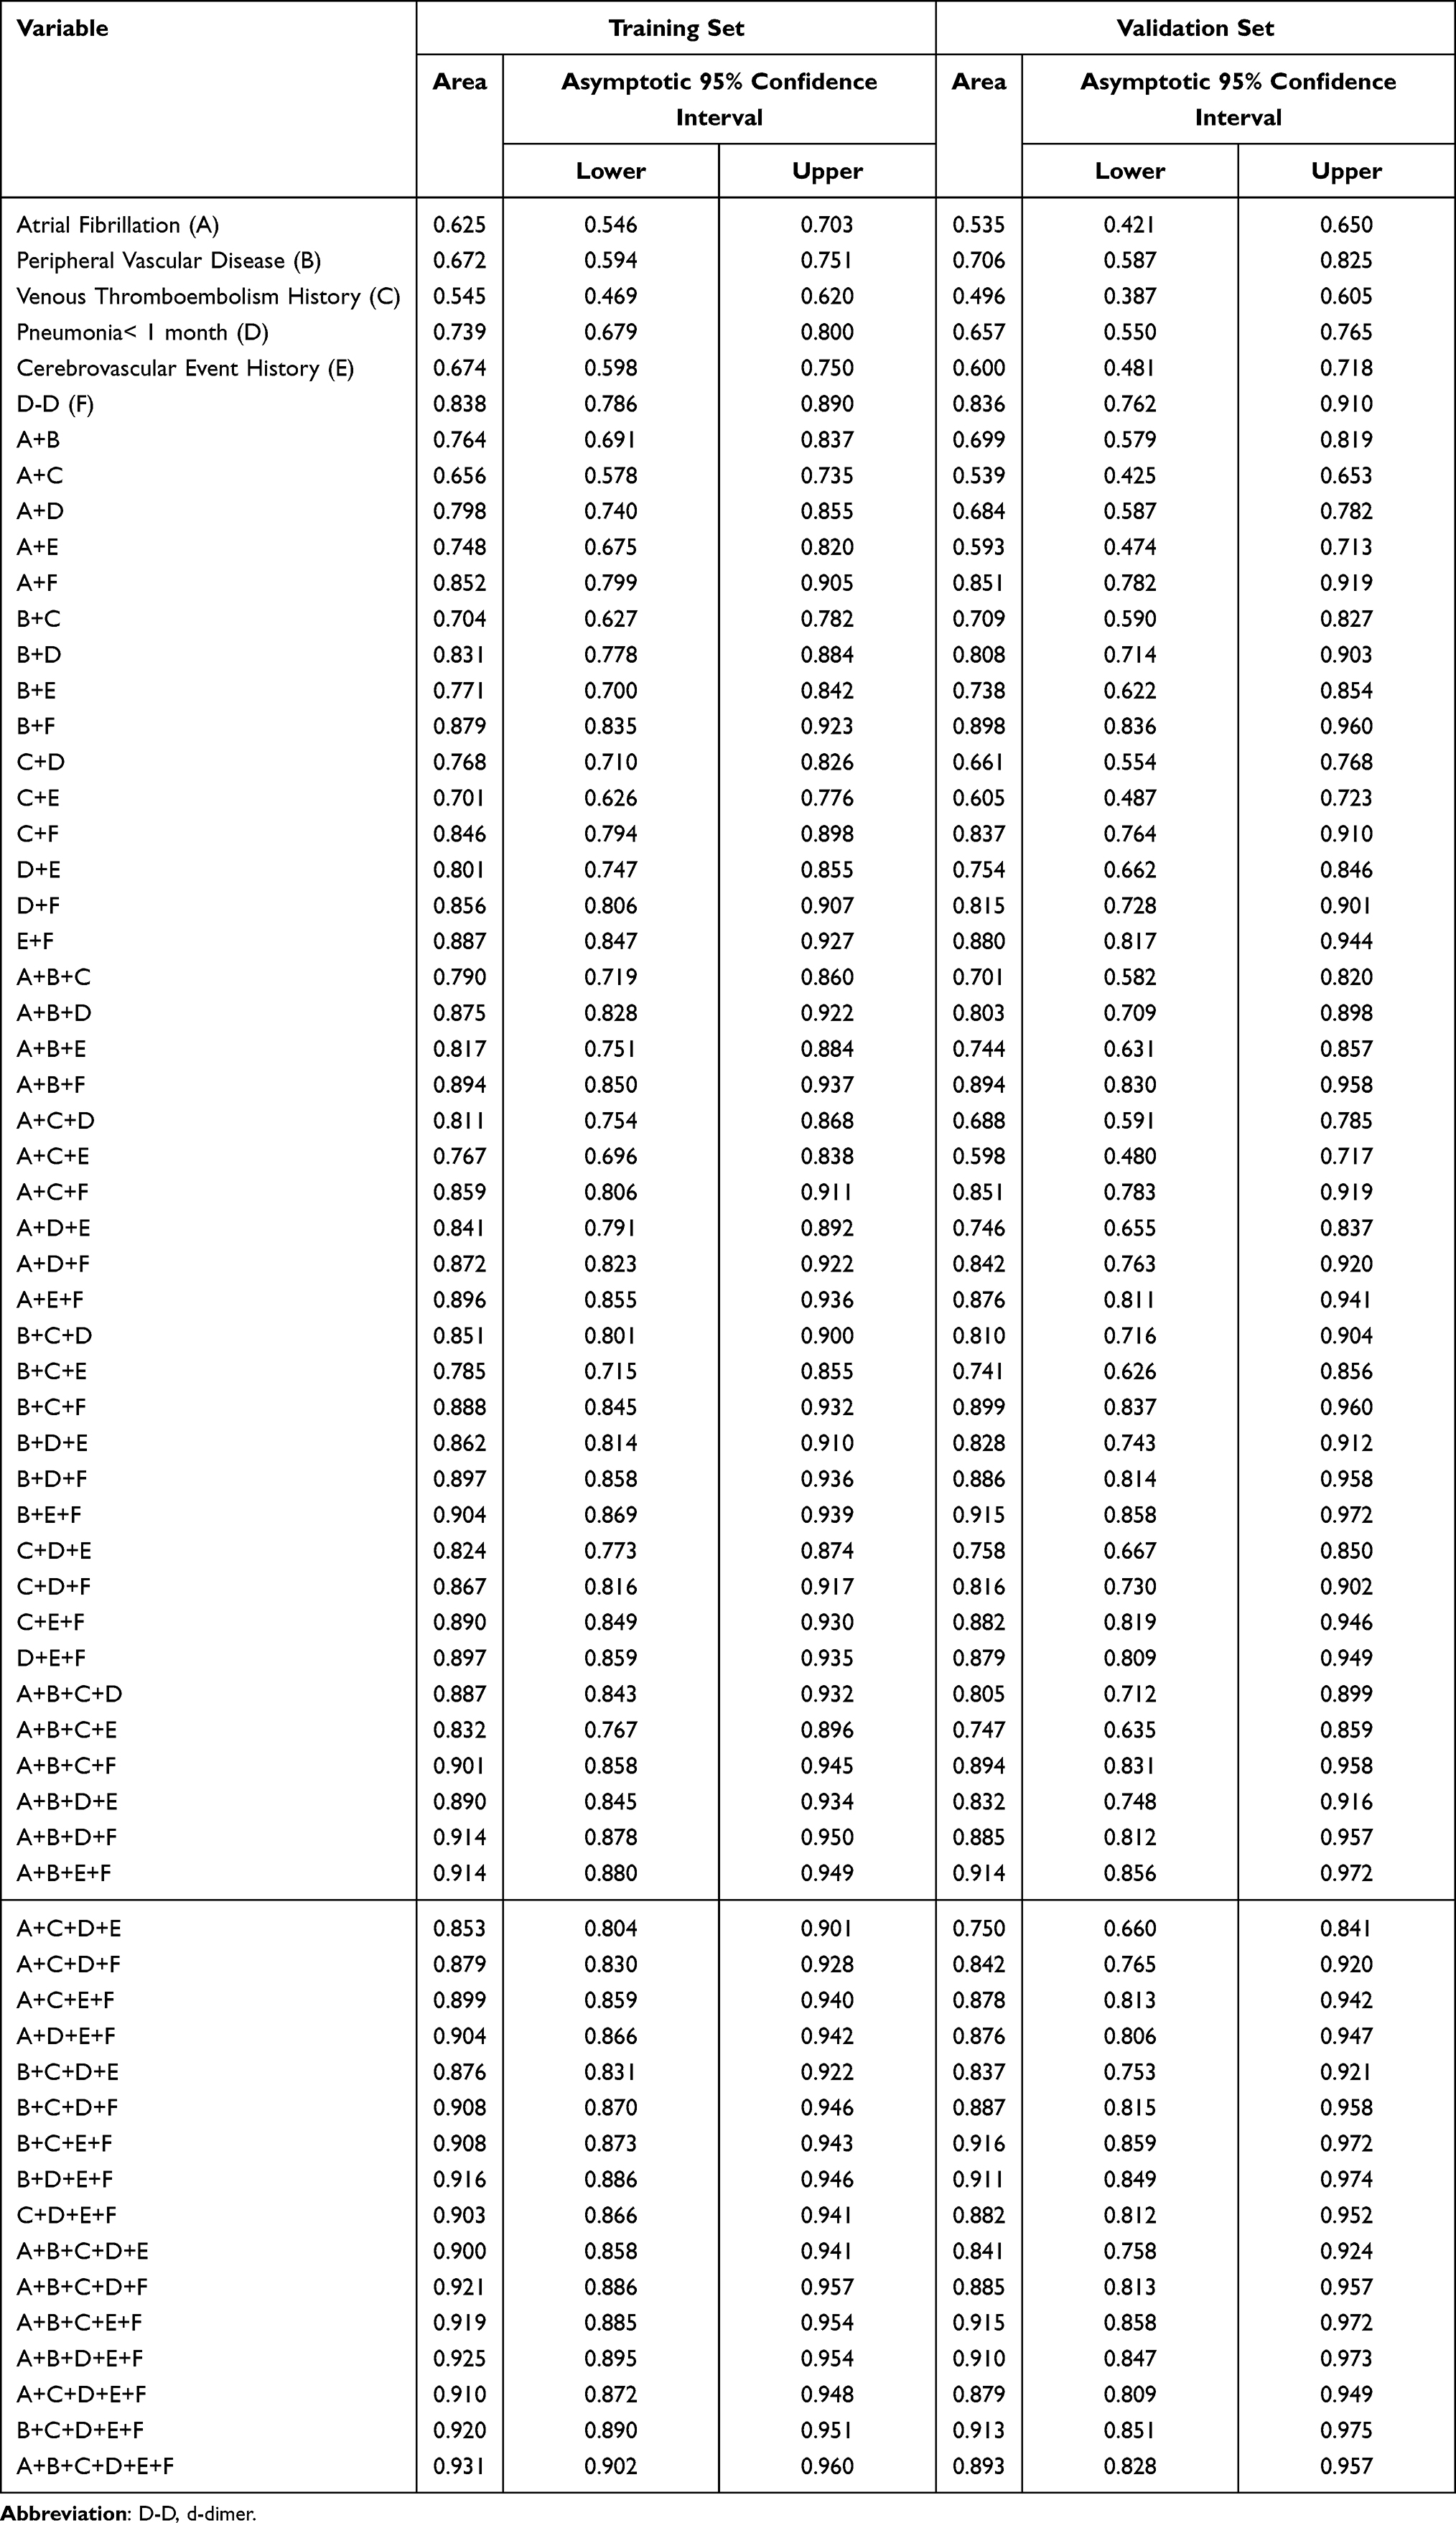 |
Table 4 The AUC Values for Six Combinations of Variables in the Training and Validation Sets |
 |
Figure 3 Calibration curves and Decision curve analysis. Calibration curves of predicted thrombosis probabilities in ITP patients for the training set (a) and validation set (b). In the Hosmer–Lemeshow test, all P-values were > 0.05, indicating good agreement between predicted probabilities and observed outcomes. In the decision curve analysis (DCA) of the thrombosis prediction nomogram, the green line represents the “Treat None” strategy (assuming no thrombosis in any patient), the red line denotes the “Treat All” strategy (assuming thrombosis in all patients), and the blue line corresponds to the nomogram model. The analysis was performed for both the training set (c) and validation set (d). |
In addition, based on the type of thrombosis, patients were categorized into three subgroups for analysis: venous thrombosis (Supplemental Table 6), arterial thrombosis (Supplemental Table 7), and combined venous and arterial thrombosis (Supplemental Table 8). The subgroup analysis included 52 patients with venous thrombosis only, 34 patients with arterial thrombosis only, and 15 patients with both venous and arterial thrombosis. And for subgroup analysis, the ITP cohort was stratified into primary and secondary ITP groups. The clinical characteristics and laboratory parameters of these subgroups are detailed in Supplementary Table 9 (primary ITP) and Supplementary Table 10 (secondary ITP).
Discussion
Previous studies have demonstrated that patients with chronic ITP face a significantly elevated risk of developing both arterial and venous thrombosis compared to the general population, and recent studies increasingly identified common thrombotic risk factors in ITP patients.1,2,17,18 Saldanha et al comprehensively reviewed the multifactorial nature of thrombosis in ITP, categorizing risk factors into patient-specific determinants (age >60 years, preexisting cardiovascular risk factors, prior thrombosis history, and surgical history), treatment-related contributors (glucocorticoids, TPO-RAs, IVIg, and splenectomy) and disease-intrinsic elements (elevated factor VIII levels and endothelial activation), while highlighting the benefits of antithrombotic prophylaxis in high-risk ITP patients.19 Another retrospective analysis revealed an overall thrombosis incidence of 4.66% (15/322) in ITP patients, identifying coronary artery disease, TPO-RA treatment, and dyslipidemia as significant thrombotic risk factors.20
This study analyzed 896 ITP patients to identify high-risk factors for thrombosis and develop a predictive model. Results demonstrated significantly higher thrombosis incidence in patients with atrial fibrillation, peripheral vascular disease, venous thromboembolism history, cerebrovascular events (including cerebral infarction and hemorrhage), or pneumonia < 1 month compared to non-thrombotic controls, with concurrently elevated D-dimer levels in the thrombosis cohort. Prior studies confirm atrial fibrillation as a prothrombotic state due to atrial structural remodeling, hemodynamic stasis, and dysregulation of coagulation pathways and platelet activation.21,22 Peripheral vascular disease is frequently associated with risk factors including smoking, hypertension, and diabetes; its pathogenesis typically involves the development of peripheral atherosclerosis leading to partial or complete luminal occlusion.23 Furthermore, current guidelines emphasize the critical importance of antithrombotic therapy in the management of peripheral vascular disease.24 Multiple cohort studies have demonstrated that a prior history of thrombosis is strongly associated with recurrent venous thromboembolism.25,26 A multinational study evaluating risk factors for arterial and venous thrombosis in primary ITP patients from France and Sweden further confirmed that pre-existing thrombotic events significantly correlated with recurrent thrombotic episodes.7 Acute respiratory infections are linked to increased venous thrombosis risk.27 Furthermore, a study demonstrated that severe pneumonia induces systemic inflammation and blood stasis, collectively contributing to thrombogenesis.28 Critically, D-dimer emerged as the strongest independent predictor of thrombosis in ITP patients in this study. As a soluble fibrin degradation product, D-dimer serves as a specific biomarker for intravascular thrombogenesis and is clinically validated for diagnosing both arterial and venous thrombosis.29
Some clinical studies have reported oral TPO-RAs as high-risk factors for thrombosis;19,30,31 however, a meta-analysis4 conducting pooled analysis of 2105 patients from 17 RCTs and 3227 patients from 29 single-arm trials found that ITP patients receiving thrombopoietic agents (TAs) exhibited no significant increase in arterial thrombosis or venous thromboembolism risk. In this study, an analysis of medications administered within one month prior to thrombotic events revealed that glucocorticoids, rhTPO/TPO-RAs, rituximab, and other immunosuppressants (including hydroxychloroquine, cyclosporine, mycophenolate mofetil and cyclophosphamide) were not the independent high-risk factors for thrombosis. Clinical practice and prior studies indicate that ITP patients developing thrombosis during TPO-RA therapy often present with coexisting high-risk conditions such as advanced age, atrial fibrillation, peripheral vascular disease, history of venous thromboembolism, or cerebral infarction. We recommend heightened vigilance for arterial and venous thrombosis when administering TPO-RAs to ITP patients with these high-risk factors particularly those concurrently exhibiting the six high-risk factors identified in this study.
A predictive model for thrombosis in ITP patients was developed through retrospective analysis of baseline characteristics and laboratory parameters from 350 ITP cases,9 identifying elevated D-dimer levels, low platelet counts, and high Padua scores as independent predictors, with an area under the curve (AUC) of 0.673 (95% CI: 0.615–0.730). Notably, this cohort exhibited a male predominance of only 4% (14/350) and an exceptionally high thrombosis incidence of 33.14% (116/350), while the model’s AUC < 0.7 and absence of internal/external validation substantially diminished its reliability.9 In contrast, our study employed LASSO regression analysis in conjunction with conventional univariate and multivariate methods to screen for independent thrombotic risk factors, ultimately identifying six high-risk predictors: atrial fibrillation, peripheral vascular disease, venous thromboembolism history, cerebrovascular events, pneumonia < 1 month, and D-dimer levels. The individual AUC values for these predictors in the validation set were 0.535, 0.706, 0.496, 0.600, 0.657, and 0.836, respectively. The nomogram model integrating these parameters achieved a significantly higher AUC of 0.893 (95% CI: 0.828–0.957), indicating robust predictive performance. Furthermore, the Hosmer-Lemeshow goodness-of-fit test (P>0.05) confirmed alignment between predicted and observed thrombosis probabilities. DCA demonstrated superior clinical utility of the nomogram, with its net benefit curve substantially exceeding the “treat-all” and “treat-none” reference lines across most threshold probabilities, thereby validating its practical value in clinical decision-making. Consequently, this model represents a reliable assessment tool for predicting thrombotic risk in ITP patients.
This study developed a predictive model for thrombosis in ITP patients; however, several limitations warrant consideration. First, among hospitalized patients in healthcare institutions, a subset of patients first present with thrombosis and are subsequently found to have thrombocytopenia during their medical evaluation; following diagnostic investigations, these individuals are diagnosed with ITP complicated by thrombosis, and this diagnostic pathway may lead to an artificially elevated proportion of thrombosis among hospitalized ITP patients compared to the overall ITP population with thrombotic complications. Consequently, certain biomarkers that are specifically expressed in thrombosis patients (such as D-dimer) might be assigned excessive weight in our model. The predictive value of these factors could be overestimated in the general ITP population, potentially limiting the model’s applicability to a broader range of ITP patients. Meanwhile, as a single-center retrospective investigation, the model’s reliability was strengthened through internal validation but requires further evaluation via external validation or prospective studies to confirm generalizability. Furthermore, this model exclusively incorporated baseline characteristics and laboratory parameters; however, given the heterogeneity in treatment duration among ITP patients, variations in TPO-RAs subtypes administered, and the ongoing debate regarding whether TPO-RAs elevate thrombosis risk in this population, further refinement of the model is warranted to evaluate the impact of ITP-related pharmacotherapies on thrombosis.
Importantly, by restricting medication records to the one-month period preceding the thrombotic event, this study may not fully capture the contribution of medications whose prothrombotic effects are mediated through long-term, cumulative mechanisms. And, in the current study, treatment interventions were primarily analyzed as baseline covariates, without fully accounting for the timing of treatment initiation relative to outcome occurrence, which may have introduced immortal time bias. Additionally, distinct mechanistic pathways between arterial and venous thrombosis as well as etiological differences between primary and secondary ITP were not evaluated; consequently, expanding sample sizes for subtype-specific analyses remains imperative. Finally, as this study exclusively involved Chinese participants, future investigations must evaluate the model’s applicability in non-Asian populations due to racial/ethnic variability in thrombotic risk profiles.
Conclusion
In conclusion, this study identified reliable predictors through LASSO regression-enhanced variable selection, and developed the concise and clinically applicable ITP-THROMBO prediction model. This tool facilitates rapid identification of ITP patients at high thrombotic risk, enabling timely decision-making support for personalized treatment planning.
Data Sharing Statement
Data are available upon reasonable request from the corresponding author, Changcheng Zheng ([email protected]).
Ethics Approval and Informed Consent
The study protocol was approved by the Ethics Committee of the First Affiliated Hospital of University of Science and Technology of China (approval number: 2025-RE-181) and was conducted in accordance with the Declaration of Helsinki.
Funding
This work was supported by Anhui Provincial Clinical Medical Research Transformation Special Project (202527c10020100), Anhui Provincial Health Commission Scientific Research Project (Co-construction Project between the National Health Commission and Anhui Province/ Major Project) (grant number: AHWJ2024Aa40018).
Disclosure
The authors report no conflicts of interest in this work.
References
1. Nørgaard M, Severinsen MT, Lund Maegbaek M, Jensen AØ, Cha S, Sørensen HT. Risk of arterial thrombosis in patients with primary chronic immune thrombocytopenia: a Danish population-based cohort study. Br J Haematol. 2012;159(1):109–15. doi:10.1111/j.1365-2141.2012.09231.x
2. Sarpatwari A, Bennett D, Logie JW, et al. Thromboembolic events among adult patients with primary immune thrombocytopenia in the United Kingdom General Practice Research Database. Haematologica. 2010;95(7):1167–1175. doi:10.3324/haematol.2009.018390
3. Frederiksen H, Maegbaek ML, Nørgaard M. Twenty-year mortality of adult patients with primary immune thrombocytopenia: a Danish population-based cohort study. Br J Haematol. 2014;166(2):260–267. doi:10.1111/bjh.12869
4. Dong Y, Xia Z, Zhou J, et al. Risk of thrombotic events in immune thrombocytopenia patients treated with thrombopoietic agents: a systematic review and meta-analysis. Thromb J. 2023;21(1):69. doi:10.1186/s12959-023-00509-z
5. Thai LH, Mahévas M, Roudot-Thoraval F, et al. Long-term complications of splenectomy in adult immune thrombocytopenia. Medicine. 2016;95(48):e5098. doi:10.1097/MD.0000000000005098
6. Moulis G, Audemard-Verger A, Arnaud L, et al. Risk of thrombosis in patients with primary immune thrombocytopenia and antiphospholipid antibodies: a systematic review and meta-analysis. Autoimmun Rev. 2016;15(3):203–209. doi:10.1016/j.autrev.2015.11.001
7. Ekstrand C, Linder M, Baricault B, et al. Impact of risk factors on the occurrence of arterial thrombosis and venous thromboembolism in adults with primary immune thrombocytopenia - Results from two nationwide cohorts. Thromb Res. 2019;178:124–131. doi:10.1016/j.thromres.2019.04.016
8. Lafaurie M, Maquet J, Baricault B, et al. Risk factors of hospitalisation for thrombosis in adults with primary immune thrombocytopenia, including disease-specific treatments: a French nationwide cohort study. Br J Haematol. 2021;195(3):456–465. doi:10.1111/bjh.17709
9. Liang H, Duan L, Long M, et al. Analysis of Risk Factors and the Establishment of a Predictive Model for Thrombosis in Patients with Immune Thrombocytopenia. Clin Appl Thromb Hemost. 2025;31:10760296241301398. doi:10.1177/10760296241301398
10. Rodeghiero F, Stasi R, Gernsheimer T, et al. Standardization of terminology, definitions and outcome criteria in immune thrombocytopenic purpura of adults and children: report from an international working group. Blood. 2009;113(11):2386–2393. doi:10.1182/blood-2008-07-162503
11. Kang J, Choi YJ, Kim IK, et al. LASSO-Based Machine Learning Algorithm for Prediction of Lymph Node Metastasis in T1 Colorectal Cancer. Cancer Res Treat. 2021;53(3):773–783. doi:10.4143/crt.2020.974
12. Hoo ZH, Candlish J, Teare D. What is an ROC curve? Emerg Med J. 2017;34(6):357–359. doi:10.1136/emermed-2017-206735
13. Révész D, van Kuijk SMJ, Mols F, et al. External validation and updating of prediction models for estimating the 1-year risk of low health-related quality of life in colorectal cancer survivors. J Clin Epidemiol. 2022;152:127–139. doi:10.1016/j.jclinepi.2022.09.019
14. Van Calster B, Wynants L, Verbeek JFM, et al. Reporting and Interpreting Decision Curve Analysis: a Guide for Investigators. Eur Urol. 2018;74(6):796–804. doi:10.1016/j.eururo.2018.08.038
15. Natarajan P, Madanian S, Marshall S. Investigating the link between oral health conditions and systemic diseases: a cross-sectional analysis. Sci Rep. 2025;15(1):10476. doi:10.1038/s41598-025-92523-6
16. Rogliani P, Laitano R, Ora J, Beasley R, Calzetta L. Strength of association between comorbidities and asthma: a meta-analysis. Eur Respir Rev. 2023;32(167):220202. doi:10.1183/16000617.0202-2022. Erratum in: Eur Respir Rev. 2023;32(168):225202
17. Severinsen MT, Engebjerg MC, Farkas DK, et al. Risk of venous thromboembolism in patients with primary chronic immune thrombocytopenia: a Danish population-based cohort study. Br J Haematol. 2011;152(3):360–362. doi:10.1111/j.1365-2141.2010.08418.x
18. Nørgaard M, Cetin K, Maegbaek ML, et al. Risk of arterial thrombotic and venous thromboembolic events in patients with primary chronic immune thrombocytopenia: a Scandinavian population-based cohort study. Br J Haematol. 2016;174(4):639–642. doi:10.1111/bjh.13787
19. Saldanha A, Colella MP, Villaça PR, Thachil J, Orsi FA. The immune thrombocytopenia paradox: should we be concerned about thrombosis in ITP? Thromb Res. 2024;241:109109. doi:10.1016/j.thromres.2024.109109
20. Zhou F, Zhang S, Li R, et al. A retrospective study of risk factors for thrombosis in patients with ITP. Hematology. 2025;30(1):2472461. doi:10.1080/16078454.2025.2472461
21. Staerk L, Sherer JA, Ko D, Benjamin EJ, Helm RH. Atrial Fibrillation: epidemiology, Pathophysiology, and Clinical Outcomes. Circ Res. 2017;120(9):1501–1517. doi:10.1161/CIRCRESAHA.117.309732
22. Khan AA, Lip GYH. The prothrombotic state in atrial fibrillation: pathophysiological and management implications. Cardiovasc Res. 2019;115(1):31–45. doi:10.1093/cvr/cvy272
23. Fowkes FG, Aboyans V, Fowkes FJ, McDermott MM, Sampson UK, Criqui MH. Peripheral artery disease: epidemiology and global perspectives. Nat Rev Cardiol. 2017;14(3):156–170. doi:10.1038/nrcardio.2016.179
24. Aboyans V, Bauersachs R, Mazzolai L, et al. Antithrombotic therapies in aortic and peripheral arterial diseases in 2021: a consensus document from the ESC working group on aorta and peripheral vascular diseases, the ESC working group on thrombosis, and the ESC working group on cardiovascular pharmacotherapy. Eur Heart J. 2021;42(39):4013–4024. doi:10.1093/eurheartj/ehab390
25. Mulatu A, Melaku T, Chelkeba L. Deep Venous Thrombosis Recurrence and Its Predictors at Selected Tertiary Hospitals in Ethiopia: a Prospective Cohort Study. Clin Appl Thromb Hemost. 2020;26:1076029620941077. doi:10.1177/1076029620941077
26. Timp JF, Braekkan SK, Lijfering WM, et al. Prediction of recurrent venous thrombosis in all patients with a first venous thrombotic event: the Leiden Thrombosis Recurrence Risk Prediction model (L-TRRiP). PLoS Med. 2019;16(10):e1002883. doi:10.1371/journal.pmed.1002883. Erratum in: PLoS Med. 2021 Apr 23;18(4):e1003612
27. Smeeth L, Cook C, Thomas S, Hall AJ, Hubbard R, Vallance P. Risk of deep vein thrombosis and pulmonary embolism after acute infection in a community setting. Lancet. 2006;367(9516):1075–1079. doi:10.1016/S0140-6736(06)68474-2
28. Cui N, Wang J, Feng X, Zhang L, Yang Y. Deep vein thrombosis in severe community-acquired pneumonia patients undergoing thromboprophylaxis: prevalence, risk factors, and outcome. Thromb J. 2025;23(1):23. doi:10.1186/s12959-025-00706-y
29. Johnson ED, Schell JC, Rodgers GM. The D-dimer assay. Am J Hematol. 2019;94(7):833–839. doi:10.1002/ajh.25482
30. Crickx E, Mahévas M, Michel M, Godeau B. Older Adults and Immune Thrombocytopenia: considerations for the Clinician. Clin Interv Aging. 2023;18:115–130. doi:10.2147/CIA.S369574
31. Nguyen TT, Palmaro A, Montastruc F, Lapeyre-Mestre M, Moulis G. Signal for Thrombosis with Eltrombopag and Romiplostim: a Disproportionality Analysis of Spontaneous Reports Within VigiBase®. Drug Saf. 2015;38(12):1179–1186. doi:10.1007/s40264-015-0337-1
 © 2026 The Author(s). This work is published and licensed by Dove Medical Press Limited. The
full terms of this license are available at https://www.dovepress.com/terms
and incorporate the Creative Commons Attribution
- Non Commercial (unported, 4.0) License.
By accessing the work you hereby accept the Terms. Non-commercial uses of the work are permitted
without any further permission from Dove Medical Press Limited, provided the work is properly
attributed. For permission for commercial use of this work, please see paragraphs 4.2 and 5 of our Terms.
© 2026 The Author(s). This work is published and licensed by Dove Medical Press Limited. The
full terms of this license are available at https://www.dovepress.com/terms
and incorporate the Creative Commons Attribution
- Non Commercial (unported, 4.0) License.
By accessing the work you hereby accept the Terms. Non-commercial uses of the work are permitted
without any further permission from Dove Medical Press Limited, provided the work is properly
attributed. For permission for commercial use of this work, please see paragraphs 4.2 and 5 of our Terms.
Recommended articles
Can COVID-19 Increase Platelet in Adult Immune Thrombocytopenia During the TPO-RA Administration? A Real-World Observational Study
Wang X, Zhu Y, Liu D, Zhu L, Tong J, Zheng C
Journal of Blood Medicine 2024, 15:217-225
Published Date: 7 May 2024