Back to Journals » Cancer Management and Research » Volume 17

Development and Validation of a Nomogram Incorporating Nutritional and Lipid Metabolism Indices to Predict Survival in Non-Small Cell Lung Cancer Patients with Malignant Pleural Effusion
Authors Chen B, Yang L, Shen K, Gao W
Received 7 June 2025
Accepted for publication 8 October 2025
Published 29 October 2025 Volume 2025:17 Pages 2523—2536
DOI https://doi.org/10.2147/CMAR.S536389
Checked for plagiarism Yes
Review by Single anonymous peer review
Peer reviewer comments 2
Editor who approved publication: Professor Bilikere Dwarakanath
Binyu Chen,1,* Liu Yang,2,* Kaiyu Shen,2 Wencang Gao3
1Department of Ultrasound, The First Affiliated Hospital of Zhejiang Chinese Medical University (Zhejiang Provincial Hospital of Chinese Medicine), Hangzhou, 310000, People’s Republic of China; 2Department of Oncology, The Second Clinical Medical College, Zhejiang Chinese Medical University, Hangzhou, 310000, People’s Republic of China; 3Department of Oncology, The Second Afliated Hospital, Zhejiang Chinese Medical University, Hangzhou, 310000, People’s Republic of China
*These authors contributed equally to this work
Correspondence: Wencang Gao, Department of Oncology, The Second Afliated Hospital, Zhejiang Chinese Medical University, Chaowang Road, Gongshu District, Hangzhou, 310000, People’s Republic of China, Tel +86 13616864326, Email [email protected]
Purpose: Patients with non-small cell lung cancer (NSCLC) complicated by malignant pleural effusion (MPE) face a dismal prognosis. Existing biomarkers (eg, VEGF, CEA) show limited sensitivity, while nutritional indices (eg, PNI) are emerging as prognostic factors. This study aimed to develop a novel nomogram integrating lipid metabolism and nutritional indices to predict survival in NSCLC-MPE patients.
Methods: Multicenter retrospective cohort study enrolling patients with confirmed NSCLC combined with MPE who underwent thoracentesis from 2018 to 2024 from each of two centers. Univariate, multifactorial Cox regression analysis was used to identify five key clinical variables, and a nomogram model was developed. The predictive accuracy of the model was evaluated by calculating the area under the curve of the work characteristics of the recipients.
Results: A total of 250 patients with NSCLC combined with MPE were analyzed in this study, 195 in the training group and 55 in the validation group. The multifactorial COX test showed an interaction between ECOG PS, pleural lactate dehydrogenase (LDH), T stage, low/high-density lipoprotein cholesterol concentration ratio (LHR), and prognostic nutritional index (PNI). At 1, 2, and 3 years, the area under the curve (AUC) values were 0.899, 0.808, and 0.748 for the training set and 0.899, 0.798, and 0.669 for the validation set, respectively.
Conclusion: MPE carries a poor prognosis for NSCLC patients, and the clinical prediction model we constructed shows good promise in predicting OS in this patient, which can assist direct the selection of optimal treatment strategies.
Keywords: non-small cell lung cancer, malignant pleural effusions, prediction model, survival analysis, prognostic nutritional index
Introduction
MPE is mainly seen in malignant pleural mesothelioma (MPM) originating in the pleura and secondary to metastatic tumors elsewhere, mainly including lung cancer and breast cancer.1 Studies have shown that the presence of MPE in lung cancer patients implies a inadequate prognosis, and the average duration of survival after diagnosis ranges from 3 to 12 months depending on the cell type, while NSCLC makes up approximately 85% of all lung cancers, so accurate prediction of the prognosis of patients with NSCLC in combination with MPE is particularly important for the development of personalized treatment strategies for patients with NSCLC.2,3
Current treatments for NSCLC patients with combined MPE include expectant therapy, pleural cavity puncture drainage, pleural fixation, pleurodesis, and other local treatments in addition to antitumor therapy.4 A good prognostic assessment of patients with NSCLC combined with MPE can lead to different treatment options, such as therapeutic thoracentesis drainage to alleviate symptoms such as dyspnea for patients with a shorter life expectancy. For patients with a longer life expectancy, tunneled chest drain implantation or pleural fixation can be used to improve quality of life. To predict the survival time of MPE patients, many researchers have long developed several prediction models, such as the LENT score and the PROMISE score. Among them, the LENT score, which categorizes patients into low-risk, intermediate-risk, and high-risk groups through risk stratification (with median survival times of 319, 130, and 44 days, respectively), is a simple and effective tool for predicting the survival of patients with MPE.5 The PROMISE score, a prospectively validated prognostic model for MPE, accurately estimates 3-month mortality and is specifically designed for patients with a confirmed diagnosis of MPE who are scheduled to undergo pleural surgery.6 The LENT and PROMISE scoring systems exhibit limitations when evaluating patients across different cancer types, as they overlook the biological specificity of distinct tumors, primarily predict short-term survival, offer limited prognostic value for long-term survival in NSCLC patients, and lack universal molecular biomarkers, consequently providing only generalized information.
Nevertheless, molecular biomarkers have fundamentally reshaped the entire diagnostic and therapeutic workflow for NSCLC, serving as the core engine of precision medicine.7 In diagnosis, the tertiary lymphoid structure that predicts immune efficacy transcends tissue and staging limitations, enabling new possibilities for early screening and treatment response prediction.8 For treatment decisions, molecular subtyping directly guides individualized plans, matching driver genes such as EGFR, ALK, and ROS1 with targeted therapies.9,10 In prognosis and management, liquid biopsy technology dynamically monitors ctDNA, allowing real-time assessment of treatment efficacy and resistance development, thereby propelling NSCLC precision medicine to a higher level.11–14
Therefore, to provide a more accurate estimate of individualized survival probability, the objective of this study is to create a novel prognostic model utilizing clinical data and laboratory indicators, with the goal of assisting clinicians in formulating more informed and effective treatment plans.
Methods
Study Population
This is a multicenter retrospective cohort study with a study population consisting of two datasets: a training set and an external validation set. The training set was selected from Zhejiang Provincial People’s Hospital, and the validation set was selected from the Second Hospital Affiliated to Zhejiang University of Traditional Chinese Medicine. We included patients hospitalized between January 2016 and May 2023 for NSCLC combined with MPE. Inclusion criteria: (1) patients with confirmed NSCLC confirmed by biopsy or pathology; (2) first presentation of pleural effusion; and (3) cytologic confirmation of the presence of MPE, pleural biopsy findings, or histologically confirmed metastatic disease. Exclusion criteria: (1) patients with NSCLC without histological confirmation; (2) failure of follow-up immediately after thoracic drainage; (3) presence of a second primary tumor; and (4) A comprehensive medical history was not available.
The study protocol followed local guidelines and was approved by the Ethics Committee of Zhejiang Provincial People’s Hospital and the Second Hospital Affiliated to Zhejiang University of Traditional Chinese Medicine. We confirmed that all methods were performed in accordance with relevant regulations and that each patient signed an informed consent form. The study was in accordance with the Declaration of Helsinki.
Statistical Analysis
We described and compared the clinical characteristics of the training and validation sets. Normally distributed data were expressed as means (SD) and compared using the independent samples test; non-normally distributed data were expressed as medians (P25, P75) and compared using the chi-square test; categorical variables were expressed as percentages and frequencies. Subsequently, univariate Cox regression analysis was conducted on clinical variables within the training set using SPSS statistical software. Variables with a significance level of P≤0.05 were incorporated into multivariate Cox regression analysis, which utilized a stepwise selection method for model construction. To safeguard against multicollinearity affecting model stability, variance inflation factors (VIFs) were computed for all continuous variables; all recorded VIF values were below 5. For categorical variables, Cramér’s V coefficients were calculated and complemented with chi-square tests, confirming the absence of significant multicollinearity. Based on the variables screened by the above methods, we constructed a nomogram to predict the 1-, 2-, and 3-year survival of each MPE patient using R software, and externally validated the model performance using the validation set. The sensitivity and specificity of the prognostic scoring system were tested by calculating the AUC using the receiver operating characteristic (ROC) curve. To evaluate the model performance, internal validation was conducted, and the Bootstrap method with 1000 resamplings was used for the internal validation. The models were evaluated using Decision Curve Analysis (DCA) to assess whether they could improve the net prediction benefit. Patients were stratified into high-risk, intermediate-risk, and low-risk groups based on their risk scores. Survival differences among these groups were analyzed using Kaplan–Meier curves and the Log rank test. Furthermore, missing data across all cases were addressed as follows: for categorical variables, missing values were assigned to a dedicated “missing” category; for continuous variables, missing data were imputed using multiple imputation methods.
Results
Demographic and Clinicopathological Characteristics
We initially included 285 patients with confirmed NSCLC combined with MPE who underwent thoracentesis at two hospitals from 2018 to 2023. After data collection, 5 patients with dual primary tumors, 20 patients who were lost immediately after thoracentesis, and 10 patients without a complete history were finally excluded, and Figure 1 shows the flow chart of case screening. A total of 250 patients were finally enrolled in this study, including 195 patients in the training group and 55 patients in the validation group, in which the median age of the training group was 69 years (quartile, 52–78), and patients with lung adenocarcinoma, squamous carcinoma, and adenosquamous carcinoma accounted for 80%, 19%, and 2%, respectively, and that of the validation group was 68 years (quartile, 62–76), and patients with adenocarcinoma, squamous carcinoma, and adenosquamous carcinoma accounted for 85.3% and 85.2%, respectively. adenocarcinoma, lung squamous carcinoma, and lung adenosquamous carcinoma patients accounted for 85.5%, 12.7%, and 1.8%, respectively. Except for CA125 (P < 0.05), the differences between the two groups were not statistically significant (other P > 0.05). Table 1 summarizes the clinical characteristics of the training and external validation groups.
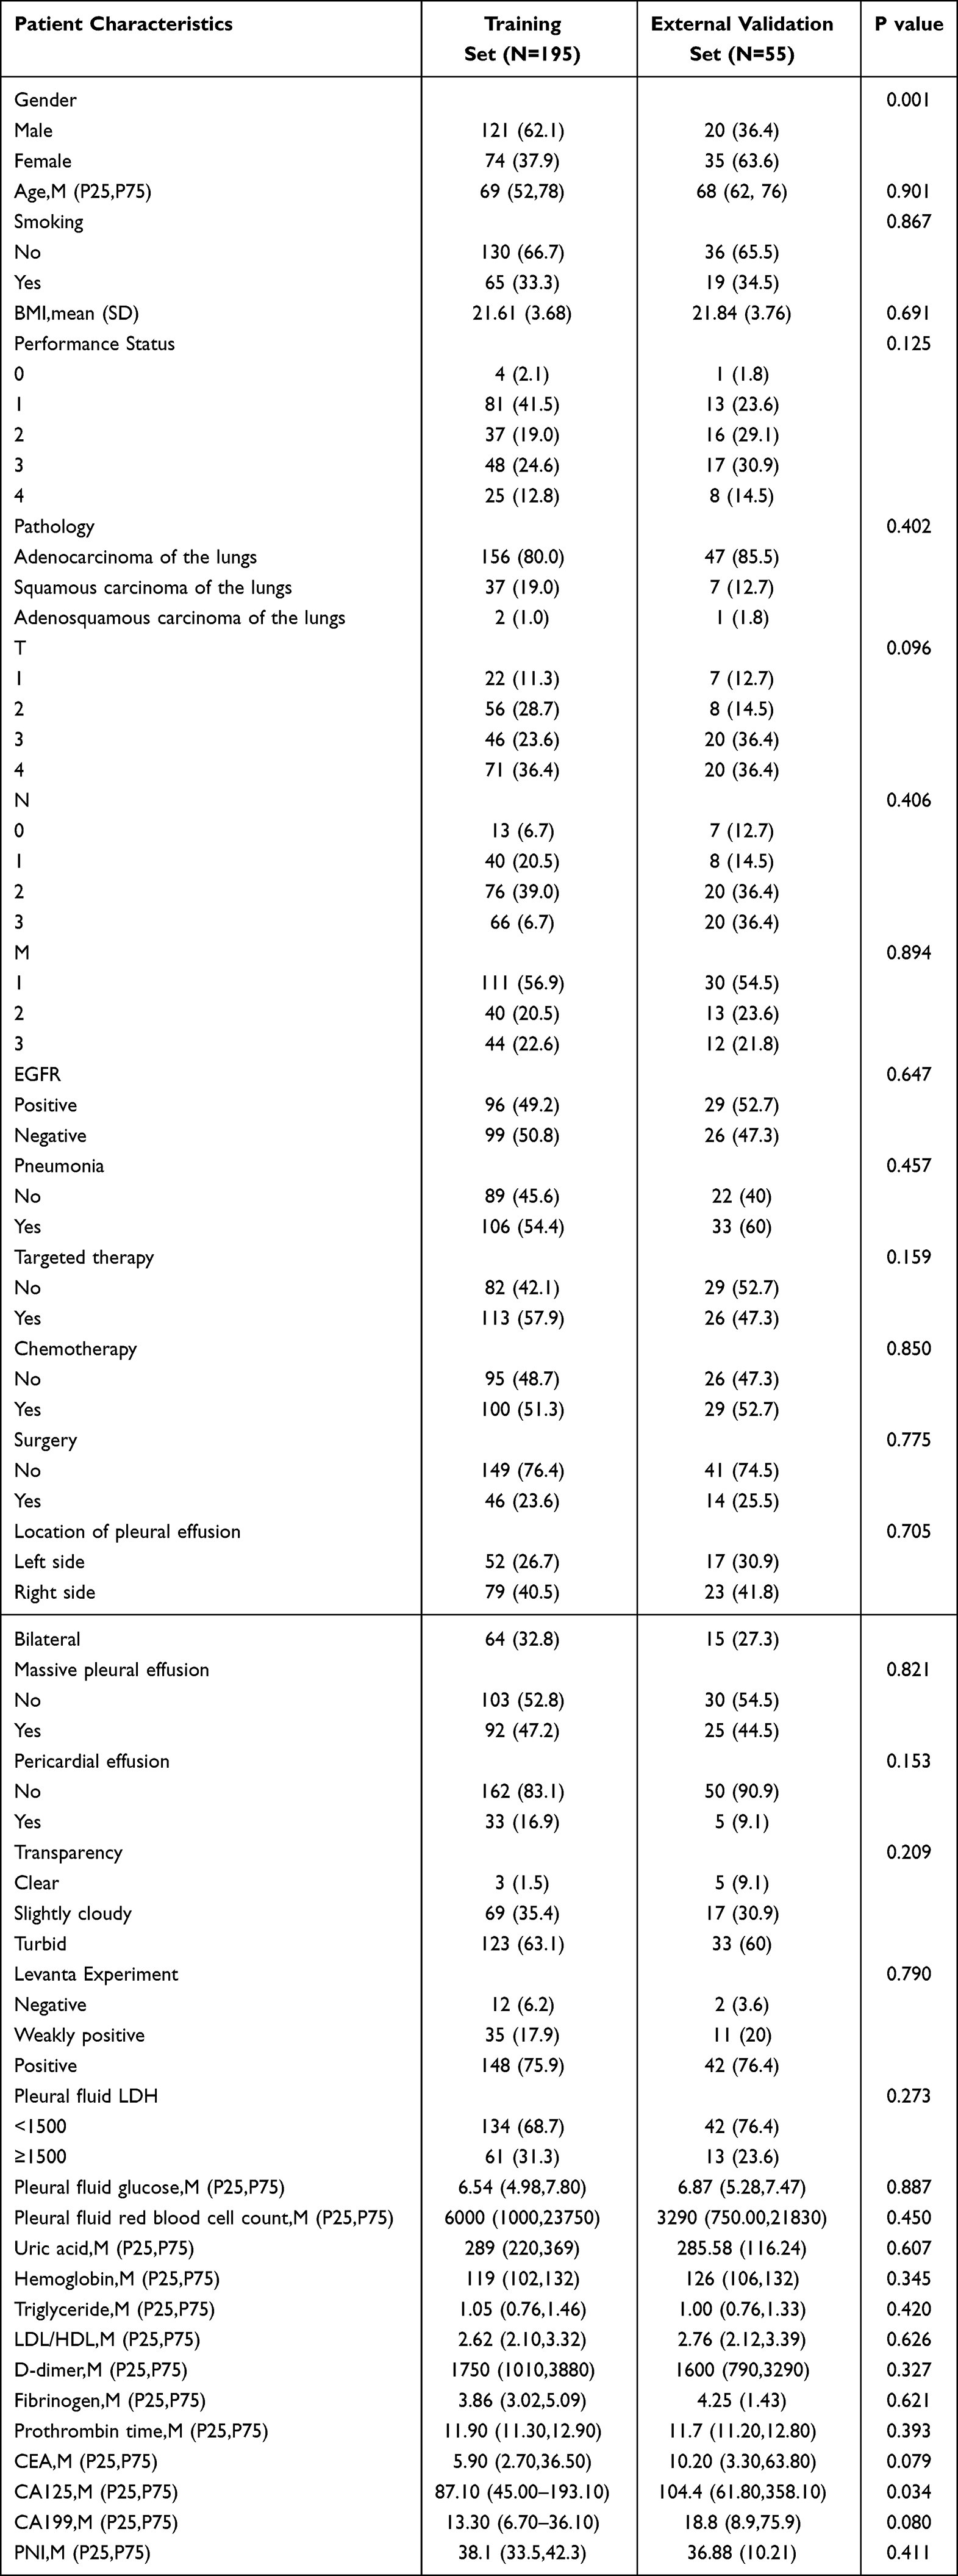 |
Table 1 Patient Characteristics in the Training and Validation Cohorts |
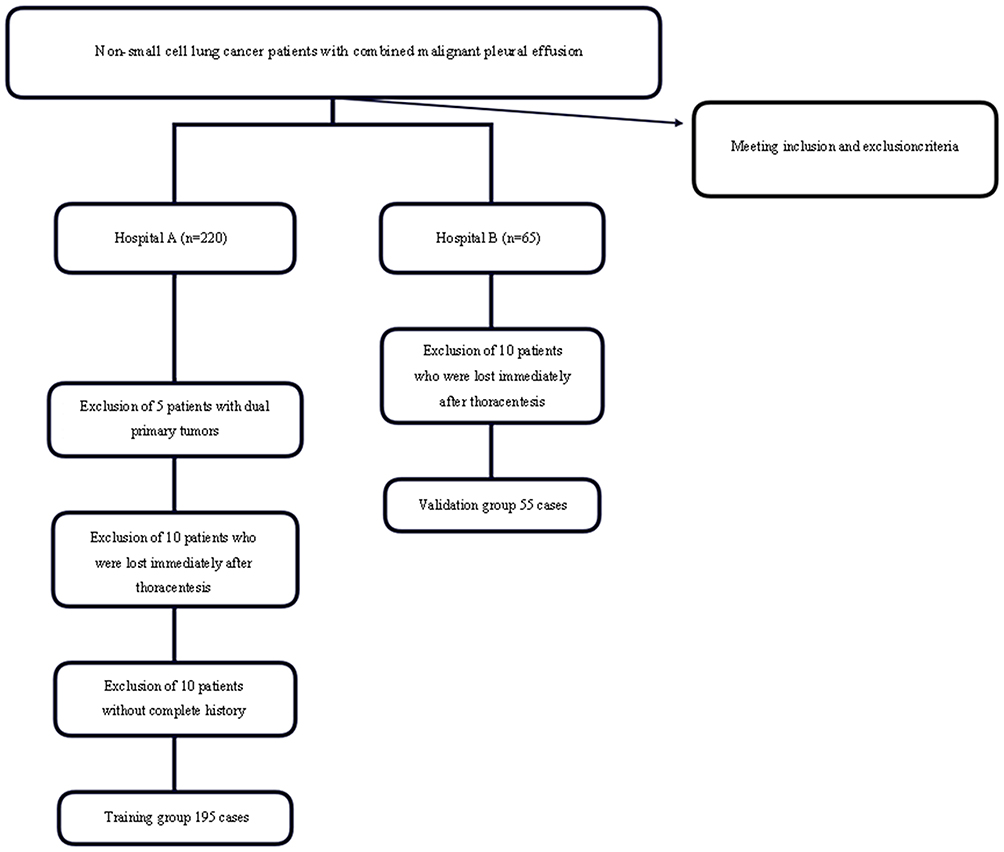 |
Figure 1 Flow chart of patients screening and recruitment. |
Development of Prediction Model
Based on clinically known risk factors and an extensive review of the literature, a total of 34 candidate variables were included in this study, as detailed in Table 1. We identified 14 variables using one-way Cox regression analysis (P<0.05), and then included them in a multifactorial Cox regression analysis with a test level of 0.05, which identified 5 candidate variables with the strongest correlation with patients’ OS: PS (OR=3.08; 95% CI: (2.36–4.02)), pleural LDH (OR= 2.13; 95% CI: (1.39–3.26)), T staging (OR=1.52; 95% CI: (1.21–1.91)), and low/high density lipoprotein cholesterol (OR=1.46; 95% CI: (1.21–1.76)), PNI (OR=0.95; 95% CI: (0.92–0.98)), as shown in Table 2, Figures 2 and 3. The rms package (version 4.0.1) for R was used to plot the column-linear tables for the training and validation sets, where 1-, 2- and 3-year risk estimates were selected, and predictive models were built based on the magnitude of the regression coefficients of the individual influencing factors. The pROC package is used to draw ROC curves for calibration, and the ROC curves for the training and validation sets are shown in Figure 4. We can see that the calibration curves of the training set show that the prediction results of each model are in good agreement with the actual observations.
 |
Table 2 Chart of Univariate Cox Regression Analysis |
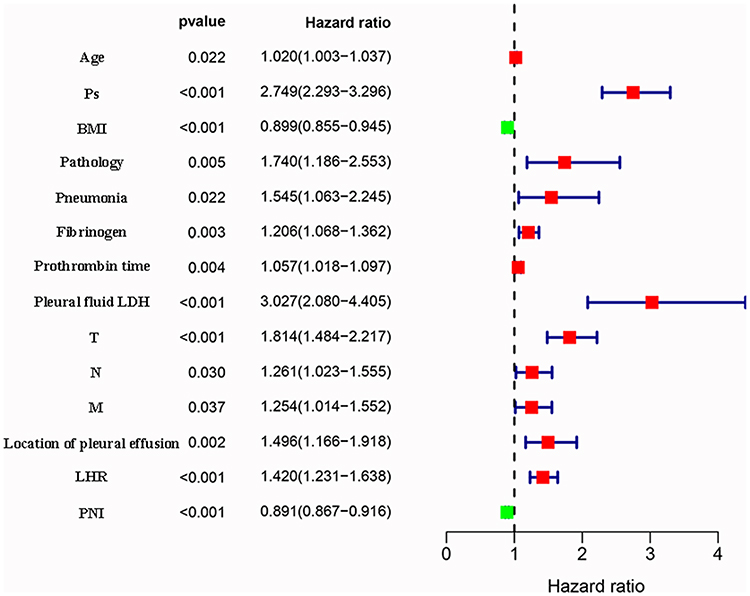 |
Figure 2 Forest plot of the significant parameters in the univariate cox regression analysis. |
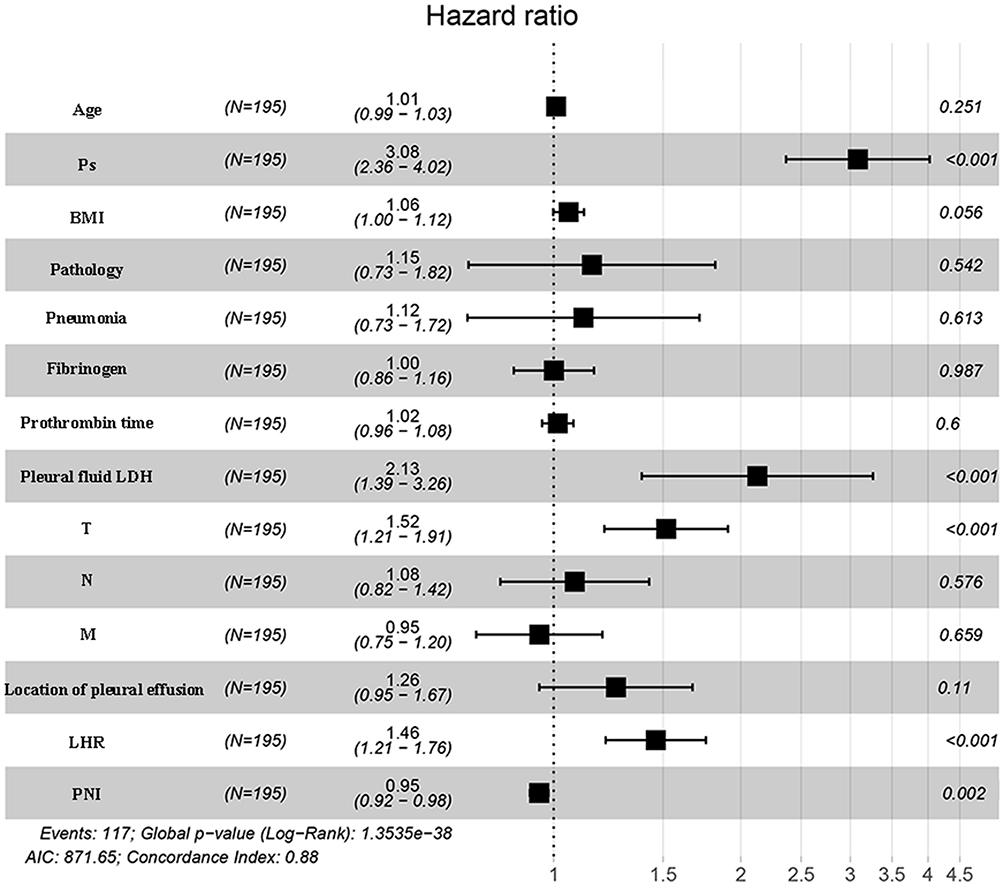 |
Figure 3 Forest plot of the significant parameters in the multivariate cox regression analysis. |
 |
Figure 4 Performance of the proposed nomogram model. Notes: The model predicted the ROC curves for 1-year (A), 2-year (B), and 3-year (C) OS in the training cohort, as well as for 1-year (D), 2-year (E), and 3-year (F) OS in the validation cohort, along with the AUC values at each time point. |
Validation of Prediction Model
Multifactorial Cox regression showed that PS score, pleural LDH, T stage, low/high-density lipoprotein cholesterol, and PNI were independent prognostic factors in patients with NSCLC combined with MPE (Figure 3). Based on these five independent risk factors, a nomogram was developed to predict individual probabilities of 1‑, 2‑, and 3‑year overall survival (Figure 5). The PS score emerged as the strongest prognostic factor, followed by PNI and the low/high-density lipoprotein cholesterol ratio. By summing the scores assigned to each variable, an overall risk score can be calculated for each patient. This score provides clinicians with a practical tool for convenient and individualized survival prediction. The ROC curves for the training and validation sets were shown in Figure 4, and the AUC was0.899, 0.808 and 0.748 in the training set, and 0.899, 0.798, and 0.669 in the validation set. We performed predictions for 1-year, 2-year, and 3-year survival rates in the training set and validation set, respectively. Calibration curves were used to visually assess the accuracy of the predicted 1-year, 2-year, and 3-year overall survival rates. As shown in Figure 6, at all three time points, the calibration curves of both the training set and the validation set were relatively close to the diagonal line. Although a slight downward deviation was observed in the validation set curve at the 3-year mark, overall, it still demonstrated good agreement.
 |
Figure 5 Nomogram for predicting 1-, 2-, and 3-year OS in NSCLC patients with MPE. |
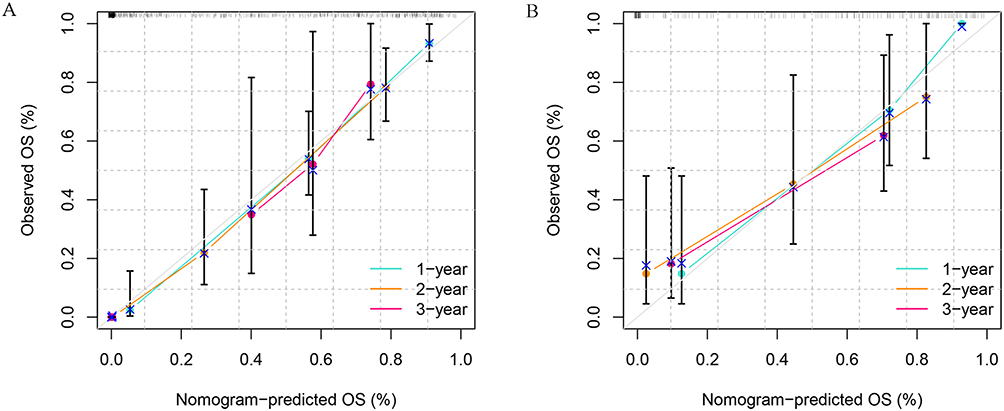 |
Figure 6 The calibration curves comparing predicted and actual survival proportions at 1, 2 and 3 years in the training (A) and validation cohorts (B). Notes: In this figure, the y-axis represents actual survival, and the x-axis represents predicted survival. Survival probabilities are distributed at the top. |
DCA demonstrated that the model provided superior net benefit compared to the “treat all” or “treat none” strategies across most threshold probabilities in both the training and validation sets (Figure 7). Using cut-off values derived from the risk scores in the training set (low-risk: ≤ –0.4749; intermediate-risk: –0.4749 to 0.3430; high-risk: ≥ 0.3430), patients were categorized into low-, intermediate-, and high-risk groups. Kaplan–Meier analysis and Log rank tests confirmed significant survival differences among the groups. The Log rank test results indicated that the survival differences among the three patient groups were highly statistically significant (P <0.0001, P <0.0001) in both the training and validation sets (Figures 8). The pairwise comparisons demonstrated that in the training cohort, significant differences were observed between the low- and intermediate-risk groups (p = 0.0335), the low- and high-risk groups (p = 1.26×10⁻¹²), and the intermediate- and high-risk groups (p = 1.05×10⁻⁸). In the validation cohort, the overall Log rank test also indicated a significant difference in survival curves among the three groups (p = 6.92×10⁻⁵). However, pairwise comparisons revealed no significant difference in survival between the low- and intermediate-risk groups (p = 0.9933).
 |
Figure 7 Decision Curve Analysis Plots of the Training Cohort (A) and Validation Cohort (B). |
 |
Figure 8 Kaplan-Meier analysis of 1-, 2-, and 3-year survival based on risk scores in the training and validation sets. Notes: (A) Training cohort, P <0.0001. (B) Validation cohort, P <0.0001. |
Sensitivity Analysis
In the training set of this study, we conducted a sensitivity analysis based on histological subtypes. DCA performed for the three histological subtypes (lung adenocarcinoma (LUAD), lung squamous cell carcinoma (SCC), and pulmonary adenosquamous carcinoma (ASC)) consistently demonstrated that, across a wide range of threshold probabilities, the model provided higher clinical net benefit compared to the strategies of “intervene for all” or “intervene for none”. (Figures 9) Calibration plots further indicated good agreement between predicted probabilities and actual observations (Figure 10).
 |
Figure 9 Decision Curve Analysis for LUAD, SCC, and ASC in the Training Cohort. Notes: (A) LUAD. (B) SCC.(C) ASC. |
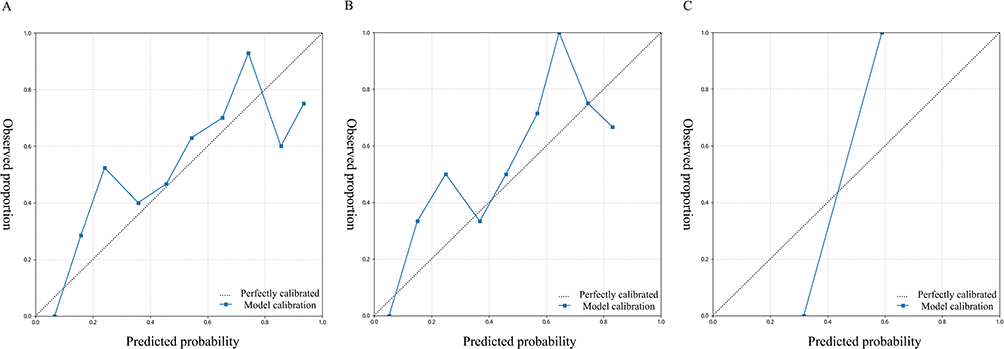 |
Figure 10 Calibration curve for LUAD, SCC, and ASC in the Training Cohort. Notes: (A) LUAD. (B) SCC.(C) ASC. |
However, the performance of the model varied somewhat across different histological subgroups, with the most notable differences observed in the adenosquamous carcinoma subgroup. These variations may be attributed to the imbalanced sample size distribution or the heterogeneity in pathological features. In this study, LUAD accounted for 80% of the patients, LUSC for 19%, and ASC for only 1%. Future studies should aim to include more cases of adenosquamous carcinoma to validate the model’s applicability in this rare subtype and enhance its generalizability across more diverse patient populations.
Discussion
Lung cancer is the second most common cancer and the leading cause of cancer-related deaths in developed countries.15 Considering the poor prognosis of patients with NSCLC combined with pleural effusion, we need to find out the prognostic factors specific to these patients and individualize the diagnosis and treatment, which can help doctors and patients to understand the prognosis of the disease and evaluate the effectiveness of treatment. This study developed and validated a clinical nomogram that integrates five conventional parameters—pleural effusion LDH, LHR, PNI, T stage, and PS score (Figure 2)—for predicting personalized survival in patients with NSCLC and MPE. Multivariate Cox analysis (Figure 3) confirmed that all five variables are independent predictors of overall survival. The model’s strength lies in its innovative integration of multidimensional indicators representing “tumor burden” (T stage, LDH), “metabolic state” (LHR), and “host condition” (PNI, PS score), offering a practical prognostic tool that outperforms any single parameter.
Beyond the established prognostic factors of TNM staging16–18 and PS scoring,19–23 LDH,24–26 the PNI,27–29 and the lymphocyte-to-high-density lipoprotein ratio (LHR) (33–40) also demonstrate independent prognostic value and potential clinical utility. These biomarkers reflect key physiological dimensions: tumor metabolic activity, systemic nutritional and immunological status, and lipid metabolic balance, respectively. As a key glycolytic enzyme, elevated levels of LDH are frequently associated with the Warburg effect—a metabolic adaptation in which tumor cells rely predominantly on glycolysis for energy even under aerobic conditions, facilitating rapid proliferation.30,31 This study confirms that an LDH level >1500 U/L serves as an independent risk factor for reduced overall survival in NSCLC-MPE patients (OR = 2.13). In addition to indicating tumor burden and aggressiveness, elevated LDH has recently been implicated in resistance to immune checkpoint inhibitors, providing a rationale for its use in guiding personalized therapeutic strategies for advanced NSCLC.32 The PNI, calculated from serum albumin and lymphocyte count, offers an integrated assessment of a patient’s nutritional and immune status. This study identifies PNI as an independent protective factor in NSCLC-MPE patients (OR = 0.95), with lower values correlating significantly with poorer outcomes. Adequate nutrition and a robust immune microenvironment are essential for tolerating anti-tumor therapies, reducing complications, and potentially enhancing responses to immunotherapy. PNI has proven valuable in predicting surgical risk, treatment response, and long-term survival, supporting its integration into clinical practice for comprehensive patient assessment and personalized treatment planning.33–36
Most notably, the model exhibits high predictive accuracy for short-term survival: the AUC for 1-year survival reached 0.899 in both the training and validation sets, while for 2-year survival, the AUC values were 0.808 (training set) and 0.798 (validation set). These results indicate that the model reliably discriminates between high- and low-risk patients at clinically critical near-term intervals (1–2 years). As such, it holds potential for guiding treatment strategies—such as decisions regarding intensive chemotherapy, early palliative care, or enrollment in clinical trials. Furthermore, the calibration curves (Figure 6) show excellent agreement between predicted probabilities and observed outcomes, further affirming the model’s reliability.
Notably, in the external validation cohort, although the survival difference between the high-risk group and the low- and intermediate-risk groups remained significant, the difference between the low- and intermediate-risk groups did not reach statistical significance. We speculate that this may be related to the relatively small sample size of the validation cohort, which limited the statistical power, while also suggesting that the model’s discriminative ability may be more subtle in patients with a favorable prognosis. The primary objective of this study was to identify high-risk patients with extremely poor prognosis for intervention, and the model demonstrated excellent and robust performance in this core aim. Future studies will further optimize the risk stratification cutoff values in larger cohorts.
The limitations of this study are that it was a retrospective study that collected NSCLC patients who underwent thoracentesis from 2018 to 2023; however, many of the patients had already passed away, making it impossible to determine with certainty each patient’s physical condition, and the data could only be collected based on the clinical case system. Second, even though this was a multicenter study, there was some screening and information bias in the small sample size, which calls for additional clinical case data. Third, we used dichotomous variables, which may reduce the accuracy of continuous variables. Our study has several strengths; first, it is a multimedia center-based retrospective study on patients with NSCLC combined with MPE. Second, we selected only case data from patients with laboratory-confirmed NSCLC, which may circumvent the heterogeneity caused by different pathologic types of lung cancer. Future prospective, multicenter studies are warranted to validate this model. Furthermore, incorporating its predictive scores with emerging molecular biomarkers or radiomic features may help counteract the observed decline in long-term predictive accuracy, thereby enhancing its overall predictive utility.37,38
Conclusion
In summary, the aim of this study was to establish a prognostic model for patients with NSCLC combined with MPE to help physicians be able to assess the risk factors of patients at an early stage, so that they can develop better prevention and individualized treatment strategies. Our predictive model incorporated five variables with good predictive effects, but more cohort or prospective studies are needed to confirm the credibility of our model in the future.
Abbreviations
NSCLC, non-small cell lung cancer; MPE, malignant pleural effusion; LDH, pleural lactate dehydrogenase; LHR, low/high-density lipoprotein cholesterol concentration ratio; PNI, prognostic nutritional index; AUC, area under the curve; MPM, malignant pleural mesothelioma; ROC, receiver operating characteristic; PS, Physical Activity Status; ECOG, Eastern Cooperative Oncology Group; BMIs, body mass indexes; VIF, Variance inflation factors; DCA, Decision curve analysis; LUAD, lung adenocarcinoma, SCC, lung squamous cell carcinoma, ASC, pulmonary adenosquamous carcinoma.
Data Sharing Statement
The datasets used and analyzed in this study are available upon request from the first author.
Ethics Approval and Consent to Participate
Approval of the research protocol by an institutional review board: This study has been approved by the Medical Ethics Committee of Zhejiang Provincial People’s Hospital (No. 2023349) and the Second Affiliated Hospital of Zhejiang Traditional Chinese Medicine Hospital (No. 2023078-01).
Funding
This work was funded by the following grants and associations: the Bethune Tumor Clinical Research Program (BCF-XD-ZL-20220118-032); Traditional Chinese Medicine Science and Technology Program of Zhejiang Province (2018ZB064, 2021ZB127), and the Pang Dexiang Famous Old Chinese Medicine Experts Inheritance Studio (2A12012014).
Disclosure
The authors declare that the research was conducted in the absence of any commercial or financial relationships that could be construed as a potential conflict of interest.
References
1. Gregg EW, Cheng YJ, Srinivasan M, et al. Trends in cause-specific mortality among adults with and without diagnosed diabetes in the USA: an epidemiological analysis of linked national survey and vital statistics data. Lancet. 2018;391:2430–2440. doi:10.1016/S0140-6736(18)30314-3
2. Sung H, Ferlay J, Siegel RL, et al. Global cancer statistics 2020: GLOBOCAN estimates of incidence and mortality worldwide for 36 Cancers in 185 countries. CA. 2021;71:209–249. doi:10.3322/caac.21660
3. Roberts ME, Neville E, Berrisford RG, Antunes G, Ali NJ. Management of a malignant pleural effusion: British thoracic society pleural disease guideline 2010. Thorax. 2010;65 (Suppl 2):ii32–40.
4. Jany B, Welte T. Pleural effusion in adults-etiology, diagnosis, and treatment. Deutsches Arzteblatt Int. 2019;116:377–386. doi:10.3238/arztebl.2019.0377
5. Clive AO, Kahan BC, Hooper CE, et al. Predicting survival in malignant pleural effusion: development and validation of the LENT prognostic score. Thorax. 2014;69:1098–1104. doi:10.1136/thoraxjnl-2014-205285
6. Psallidas I, Kanellakis NI, Gerry S, et al. Development and validation of response markers to predict survival and pleurodesis success in patients with malignant pleural effusion (PROMISE): a multicohort analysis. Lancet Oncol. 2018;19:930–939. doi:10.1016/S1470-2045(18)30294-8
7. Nicholson AG, Tsao MS, Beasley MB, et al. The 2021 WHO classification of lung tumors: impact of advances since 2015. J Thorac Oncol. 2022;17:362–387. doi:10.1016/j.jtho.2021.11.003
8. Zhang J, Song Z, Zhang Y, et al. Recent advances in biomarkers for predicting the efficacy of immunotherapy in non-small cell lung cancer. Front Immunol. 2025;16:1554871. doi:10.3389/fimmu.2025.1554871
9. Zullo L, Dall’Olio FG, Rossi G, et al. Molecular and genetic advances in small cell lung cancer landscape: from homogeneity to diversity. Int J Mol Sci. 2023;25:25. doi:10.3390/ijms25010025
10. Zugazagoitia J, Molina-Pinelo S, Lopez-Rios F, Paz-Ares L. Biological therapies in nonsmall cell lung cancer. Europ resp J. 2017;49.
11. Bazan Russo TD, Pepe F, Gristina V, et al. Recent advances in liquid biopsy for precision oncology: emerging biomarkers and clinical applications in lung cancer. Future Oncol. 2025;1–19.
12. Li FQ, Cui JW. Circulating tumor DNA-minimal residual disease: an up-and-coming nova in resectable non-small-cell lung cancer. Crit rev oncol/hematol. 2022;179:103800. doi:10.1016/j.critrevonc.2022.103800
13. Villa M, Sharma GG, Manfroni C, Cortinovis D, Mologni L. New advances in liquid biopsy technologies for Anaplastic Lymphoma Kinase (ALK)-positive cancer. Cancers. 2021;14:13. doi:10.3390/cancers14010013
14. Michaelidou K, Agelaki S, Mavridis K. Molecular markers related to immunosurveillance as predictive and monitoring tools in non-small cell lung cancer: recent accomplishments and future promises. Expert Rev Mol Diagn. 2020;20:335–344. doi:10.1080/14737159.2020.1724785
15. Siegel RL, Miller KD, Jemal A. Cancer statistics, 2018. CA. 2018;68:7–30. doi:10.3322/caac.21442
16. Detterbeck FC, Boffa DJ, Kim AW, Tanoue LT. The Eighth Edition Lung Cancer Stage Classification. Chest. 2017;151:193–203. doi:10.1016/j.chest.2016.10.010
17. Woodard GA, Jones KD, Jablons DM. Lung cancer staging and prognosis. Cancer Treatment Res. 2016;170:47–75.
18. Goldstraw P, Chansky K, Crowley J, et al. The IASLC lung cancer staging project: proposals for revision of the TNM stage groupings in the forthcoming (Eighth) edition of the TNM classification for lung cancer. J Thorac Oncol. 2016;11:39–51. doi:10.1016/j.jtho.2015.09.009
19. Zhang Y, Kong FF, Zhu ZQ, Shan HX. Controlling Nutritional Status (CONUT) score is a prognostic marker in III-IV NSCLC patients receiving first-line chemotherapy. BMC Cancer. 2023;23:225. doi:10.1186/s12885-023-10682-z
20. Scott JM, Stene G, Edvardsen E, Jones LW. Performance status in cancer: not broken, but time for an upgrade? J clin oncol. 2020;38:2824–2829. doi:10.1200/JCO.20.00721
21. Cheng S, Qureshi M, Pullenayegum E, Haynes A, Chan KK. Do patients with reduced or excellent performance status derive the same clinical benefit from novel systemic cancer therapies? A systematic review and meta-analysis. ESMO open. 2017;2:e000225.
22. West HJ, Jin JO. Performance status in patients with cancer. JAMA Oncol. 2015;1:998. doi:10.1001/jamaoncol.2015.3113
23. Salloum RG, Smith TJ, Jensen GA, Lafata JE. Survival among non-small cell lung cancer patients with poor performance status after first line chemotherapy. Lung Cancer. 2012;77:545–549. doi:10.1016/j.lungcan.2012.04.019
24. Tas F, Aykan F, Alici S, Kaytan E, Aydiner A, Topuz E. Prognostic factors in pancreatic carcinoma: serum LDH levels predict survival in metastatic disease. Am J Clin Oncol. 2001;24:547–550. doi:10.1097/00000421-200112000-00003
25. García R, Hernández JM, Caballero MD, et al. Serum lactate dehydrogenase level as a prognostic factor in Hodgkin’s disease. Br J Cancer. 1993;68:1227–1231. doi:10.1038/bjc.1993.509
26. Kemeny N, Braun DW Jr. Prognostic factors in advanced colorectal carcinoma. Importance of lactic dehydrogenase level, performance status, and white blood cell count. Am J Med. 1983;74:786–794. doi:10.1016/0002-9343(83)91066-5
27. Zhang N, Ning F, Guo R, et al. Prognostic values of preoperative inflammatory and nutritional markers for colorectal cancer. Front Oncol. 2020;10:585083. doi:10.3389/fonc.2020.585083
28. Yamashita K, Ushiku H, Katada N, et al. Reduced preoperative serum albumin and absence of peritoneal dissemination may be predictive factors for long-term survival with advanced gastric cancer with positive cytology test. Eur J Surg Oncol. 2015;41:1324–1332. doi:10.1016/j.ejso.2015.05.021
29. Tanriverdi O, Avci N, Oktay E, et al. Pretreatment serum albumin level is an independent prognostic factor in patients with stage IIIB non-small cell lung cancer: a study of the turkish descriptive oncological researches group. Asian Pac J Cancer Prev. 2015;16:5971–5976. doi:10.7314/APJCP.2015.16.14.5971
30. Icard P, Lincet H. A global view of the biochemical pathways involved in the regulation of the metabolism of cancer cells. BBA. 2012;1826:423–433. doi:10.1016/j.bbcan.2012.07.001
31. Gogvadze V, Zhivotovsky B, Orrenius S. The Warburg effect and mitochondrial stability in cancer cells. Mol Aspect Med. 2010;31:60–74. doi:10.1016/j.mam.2009.12.004
32. Mezquita L, Auclin E, Ferrara R, et al. Association of the lung immune prognostic index with immune checkpoint inhibitor outcomes in patients with advanced non-small cell lung cancer. JAMA Oncol. 2018;4:351–357. doi:10.1001/jamaoncol.2017.4771
33. Yamaguchi O, Kaira K, Imai H, et al. Clinical utility of inflammatory and nutritious index as therapeutic prediction of nivolumab plus ipilimumab in advanced NSCLC. Oncology. 2023;102:271–282. doi:10.1159/000534169
34. Wu Y, Yang J, Qiao X, et al. Use of the prognostic nutrition index as a predictive biomarker in small-cell lung cancer patients undergoing immune checkpoint inhibitor treatment in the Chinese alpine region. Front Oncol. 2023;13:1041140. doi:10.3389/fonc.2023.1041140
35. Li P, Lai Y, Tian L, Zhou Q. The prognostic value of prognostic nutritional index in advanced cancer receiving PD-1/L1 inhibitors: a meta-analysis. Cancer Med. 2022;11:3048–3056. doi:10.1002/cam4.4668
36. Park S, Park S, Lee SH, et al. Nutritional status in the era of target therapy: poor nutrition is a prognostic factor in non-small cell lung cancer with activating epidermal growth factor receptor mutations. Korean J Intern Med. 2016;31:1140–1149. doi:10.3904/kjim.2015.062
37. Le VH, Kha QH, Minh TNT, Nguyen VH, Le VL, Le NQK. Development and validation of CT-based radiomics signature for overall survival prediction in multi-organ cancer. J Digit Imaging. 2023;36:911–922. doi:10.1007/s10278-023-00778-0
38. Le VH, Kha QH, Hung TNK, Le NQK. Risk score generated from CT-based radiomics signatures for overall survival prediction in non-small cell lung cancer. Cancers. 2021;14:13.
 © 2025 The Author(s). This work is published and licensed by Dove Medical Press Limited. The
full terms of this license are available at https://www.dovepress.com/terms
and incorporate the Creative Commons Attribution
- Non Commercial (unported, 4.0) License.
By accessing the work you hereby accept the Terms. Non-commercial uses of the work are permitted
without any further permission from Dove Medical Press Limited, provided the work is properly
attributed. For permission for commercial use of this work, please see paragraphs 4.2 and 5 of our Terms.
© 2025 The Author(s). This work is published and licensed by Dove Medical Press Limited. The
full terms of this license are available at https://www.dovepress.com/terms
and incorporate the Creative Commons Attribution
- Non Commercial (unported, 4.0) License.
By accessing the work you hereby accept the Terms. Non-commercial uses of the work are permitted
without any further permission from Dove Medical Press Limited, provided the work is properly
attributed. For permission for commercial use of this work, please see paragraphs 4.2 and 5 of our Terms.