Back to Journals » International Journal of Women's Health » Volume 17
Development and Validation of a Nomogram for Prognostic Prediction in Ovarian Cancer Based on Tumor Proliferation and Immune-Related Biomarkers in Chinese Patients
Authors Ren Y, Jin Y, Xu R, Su L, Wang Y, Zhang D, Chu Z, Wang S
Received 17 January 2025
Accepted for publication 5 July 2025
Published 25 August 2025 Volume 2025:17 Pages 2661—2670
DOI https://doi.org/10.2147/IJWH.S517367
Checked for plagiarism Yes
Review by Single anonymous peer review
Peer reviewer comments 2
Editor who approved publication: Professor Elie Al-Chaer
Yanan Ren,1 Ying Jin,2 Ren Xu,1 Luyang Su,3 Yazhuo Wang,1 Di Zhang,1 Zhaoping Chu,1 Shaoqing Wang4
1Department of Gynecology, Hebei General Hospital, Shijiazhuang, Hebei, People’s Republic of China; 2Obstetric and Gynecological Rehabilitation, Hebei General Hospital, Shijiazhuang, People’s Republic of China; 3Physical Examination Center, Hebei General Hospital, Shijiazhuang, People’s Republic of China; 4Department of Reproductive Medicine, Second Hospital of Hebei Medical University, Shijiazhuang, Hebei, People’s Republic of China
Correspondence: Shaoqing Wang, Department of Reproductive Medicine, Second Hospital of Hebei Medical University, No. 215 Heping West Road, Shijiazhuang, People’s Republic of China, Tel +86-0311-66002721, Email [email protected]; [email protected]
Objective: To develop a nomogram prediction model for ovarian cancer prognosis using tumor proliferation and immune-related biomarkers.
Methods: Between January 2018 and December 2023, clinical data were collected from 140 patients diagnosed with epithelial ovarian cancer (EOC). These patients were randomly allocated into a training cohort consisting of 84 patients and a validation cohort comprising 56 patients, adhering to a 6:4 ratio. Immunohistochemical staining assessed Ki67, epidermal growth factor receptor (EGFR), and programmed death-ligand 1 (PD-L1) expression. Lasso-Cox regression identified variables for the nomogram model. Model performance was evaluated using time-dependent receiver operating characteristic (ROC) curves, concordance index, calibration curves, and decision curve analysis. Kaplan-Meier survival analysis assessed the prognostic value of the model’s risk score.
Results: Lasso-Cox regression identified seven variables for constructing the nomogram prediction model: maximum tumor diameter, KI67 positive rate, pathological grade, N stage, M stage, KI67 ≥ 20%, and PD-L1 > 0. The area under the ROC curve (AUC) for 1-, 4-, and 6-year overall survival (OS) in the training set were 0.908, 0.940, and 0.965, respectively, with a concordance index of 0.85 [95% confidence interval (CI): 0.80– 0.90]. In the validation set, the AUCs for 1-, 4-, and 6-year OS were 0.835, 0.802, and 0.832, respectively, with a concordance index of 0.72 (95% CI: 0.65– 0.79). Calibration curves demonstrated good agreement between predicted and actual outcomes (as indicated by non-significant Hosmer-Lemeshow tests, all P> 0.05). The model outperformed TNM staging in clinical benefit. High-risk scores correlated with poorer overall and progression-free survival (P< 0.01). These findings suggest the nomogram can effectively stratify patients and predict prognosis.
Conclusion: The successful development and validation of a nomogram prediction model based on tumor proliferation and immune-related biomarkers offers an efficient and straightforward clinical tool. This tool holds promise for enabling personalized treatment strategies for patients with ovarian cancer.
Keywords: epithelial ovarian cancer, prognostic nomogram, Ki67, PD-L1, survival prediction, tumor microenvironment
Introduction
Ovarian cancer (OC) represents one of the most prevalent malignant tumors in the field of gynecology, accounting for a significant proportion of cancer-related mortality among women globally.1,2 In China, ovarian cancer incidence and mortality rates have also shown an increasing trend, posing a significant public health challenge.3 Within this category, epithelial ovarian cancer (EOC) is the predominant pathological subtype, constituting over 90% of all ovarian cancer cases.4 Despite recent advances in therapeutic approaches, such as targeted therapy and immunotherapy, the five-year survival rate for ovarian cancer patients remains dismally low, frequently below 50%.5 This alarming statistic highlights the need for improved prognostic tools that can facilitate better risk stratification and personalized treatment strategies.
Cancer staging, primarily based on the TNM (Tumor, Node, Metastasis) system by the American Joint Committee on Cancer (AJCC) and the International Federation of Gynecology and Obstetrics (FIGO) staging system, provides crucial prognostic information and guides treatment decisions. The TNM system assesses the primary tumor’s extent (T), regional lymph node involvement (N), and distant metastasis (M). FIGO staging is specific to gynecological cancers and similarly categorizes disease spread.6 While essential, these systems primarily rely on anatomical extent and may not fully capture the biological heterogeneity influencing patient outcomes.
The pathophysiology of ovarian cancer is complex, with both tumor cell proliferation and immune evasion playing critical roles in disease progression and patient prognosis.7 Tumor proliferation is often associated with aggressive disease behavior, while the ability of cancer cells to evade immune surveillance is a key mechanism through which tumors can progress unchecked. Ki67, a well-established marker of cellular proliferation, is a nuclear protein expressed throughout the active phases of the cell cycle (G1, S, G2, and mitosis) but absent in quiescent (G0) cells, has been extensively utilized to gauge proliferative activity in tumor tissues.2 Additionally, the epidermal growth factor receptor (EGFR) is intricately linked to processes of tumor proliferation, invasion, and metastasis, making it a valuable biomarker in the study of EOC.8 EGFR activation triggers downstream signaling pathways, such as MAPK and PI3K-Akt, promoting cell growth and survival. Furthermore, programmed death-ligand 1 (PD-L1) expression is closely intertwined with tumor immune evasion, as it facilitates the suppression of anti-tumor immune responses.2 PD-L1 on tumor cells binds to PD-1 on T cells, inhibiting T-cell effector functions and allowing tumors to escape immune destruction.
This study aims to holistically evaluate the impact of aberrant tumor proliferation and immune evasion on the prognosis of patients with EOC. By integrating key biomarkers, including Ki67, EGFR, and PD-L1, along with relevant clinical characteristics, we seek to develop a comprehensive prognostic nomogram model. This model is designed to provide a more accurate framework for assessing the prognosis of EOC patients, ultimately enabling clinicians to tailor treatment strategies more effectively based on individual risk profiles. Through this research, we hope to contribute to the ongoing efforts to enhance the management of ovarian cancer and improve outcomes for affected patients.
Materials, Subjects, and Methods
Study Subjects
A retrospective collection of medical records and pathological tissues from ovarian cancer patients treated Between January 2018 and December 2023 was conducted, utilizing formalin-fixed, paraffin-embedded (FFPE) specimens exclusively from the Shanghai Xinchao Biological Ovarian Cancer Tissue Microarray (HOvaC154Su01), which represents a cohort of EOC cases from various contributing institutions in China. The sampling strategy for inclusion in this study was based on the availability of complete clinical and pathological data from this pre-existing tissue microarray.
Inclusion Criteria: Cases were included if they were pathologically confirmed as malignant epithelial ovarian cancer (EOC) with available overall survival (OS) and follow-up data.
Exclusion Criteria: Tissue samples derived from metastatic sites or adjacent to cancerous regions were excluded from the study. Patients who received neoadjuvant chemotherapy or radiotherapy before surgery, those with a history of other malignant tumors, or those with incomplete clinicopathological or follow-up data were also excluded.
Reagents and Instruments
The following reagents and instruments were utilized:
EnVision™ FLEX + reagent and Antibody Diluent with Background Reducing Components, both manufactured by Dako, Glostrup, Denmark;
Mayer’s hematoxylin staining solution (Solarbio, Beijing, China) and rabbit anti-PD-L1 antibody (Clone SP142), sourced from Genetic (Shanghai, China);
Rabbit anti-EGFR antibody (Clone EP38Y) and rabbit anti-KI67 antibody (Clone MIB-1), provided by Maixin Biotech, Fuzhou, China.
For staining, a ST502 fully automatic staining machine (Leica, Wetzlar, Germany), PT Link fully automatic immunohistochemistry pretreatment system, and Autostainer Link48 fully automatic immunohistochemistry staining system (both produced by Dako, Glostrup, Denmark) were used, along with an Aperio XT scanner (Leica, Wetzlar, Germany).
Experimental Methods
Medical Record Collection
Clinical information was gathered, including patient age, pathological diagnosis, International Federation of Gynecology and Obstetrics (FIGO) grade, tumor invasion, lymph node metastasis, distant metastasis (TNM staging), pathological grade, and maximum tumor diameter. Follow-up data on OS and progression-free survival (PFS) were also recorded.
Immunohistochemical Staining for KI67, EGFR, and PD-L1 Expression
Immunohistochemical staining of the tissue microarray was conducted following the protocol described in reference9 and manufacturer’s instructions for each antibody. The tissue microarray underwent steps including dewaxing, antigen retrieval, incubation with primary antibodies (anti-Ki67, anti-EGFR, anti-PD-L1) followed by the EnVision™ FLEX + reagent (which includes secondary antibodies and visualization system), color development with diaminobenzidine (DAB), and hematoxylin counterstaining prior to mounting for pathological examination. Immunohistochemical results were quantified as the percentage of positive cells (positive rate). KI67 was localized in the nucleus, EGFR in the cell membrane/cytoplasm, and PD-L1 in the cell membrane. Under microscopy, cells exhibiting light yellow, yellow, or brownish-yellow staining in the respective cellular components were deemed positive. Ten fields of view were randomly selected at high magnification (typically 200x or 400x) for counting positive cells, with patients categorized based on positive rate thresholds of >0%, ≥10%, ≥20%, ≥30%, ≥40%, and ≥50%, as explored during univariate analysis.
Nomogram Model Construction and Evaluation
The “caret” package (version as available in R 4.0.3) was employed for random division of the final included patients into training and validation sets in a 6:4 ratio. The “mice” package (version as available in R 4.0.3) facilitated multiple imputations for a small amount of missing data (less than 5% for any single variable). Zero-variance and collinearity testing were performed on the training set using the “caret” package. Subsequently, univariate COX regression analysis was carried out using the “survival” package (version as available in R 4.0.3) for prognostic evaluation, and variables correlated with prognosis were subjected to Lasso-Cox regression for further model variable screening. The “regplot” package (version as available in R 4.0.3) was utilized to construct a nomogram model predicting 1-, 4-, and 6-year OS for ovarian cancer patients, with model performance evaluated and validated in the validation set. The selection of 1-, 4-, and 6-year survival prediction points was based on common clinical follow-up milestones for ovarian cancer, aiming to provide short-term, intermediate-term, and longer-term prognostic insights.
Time-dependent receiver operating characteristic (ROC) curves were generated using the “time-ROC” package (version as available in R 4.0.3), and the concordance index (C-index) was calculated with the “survcomp” package (version as available in R 4.0.3) to assess the model’s discriminative performance. Model calibration accuracy was evaluated through calibration curves plotted with the “PredictABEL” package (version as available in R 4.0.3). Additionally, decision curve analysis (DCA) quantified the clinical net benefit of the model. Based on the predictive model, risk scores were computed for each patient, stratifying the cohort into high- and low-risk groups according to the median risk score; this is a common data-driven approach for Kaplan-Meier analysis when predefined cutoffs are not established. Survival differences between these groups were analyzed using Kaplan-Meier survival curves, generated with the “survminer” package (version as available in R 4.0.3). All R packages were used with their respective versions available at the time of analysis within the R (version 4.0.3, R Foundation for Statistical Computing, Vienna, Austria) environment.
Statistical Analysis
All statistical analyses were conducted using R version 4.0.3. Categorical variables were expressed as proportions (%), while continuous variables were presented as mean ± standard deviation ( ) for normally distributed data, or as median and interquartile range for non-normally distributed data. For group comparisons, one-way ANOVA was used for normally distributed continuous variables, and the Wilcoxon rank-sum test was applied for non-normally distributed data. Categorical variables were compared using either the chi-square test or Fisher’s exact test, as appropriate. The goodness-of-fit of the model was assessed using the Hosmer-Lemeshow test, and survival differences between groups were evaluated using the Log rank test. A P-value < 0.05 was considered statistically significant. Outliers were identified using standard deviation methods or boxplots during exploratory data analysis, but given the nature of the clinical variables and the use of robust methods like Lasso regression, no specific trimming or winsorizing was applied beyond addressing clear data entry errors. The potential impact of any remaining outliers is considered minimal due to the sample size and regression techniques used.
Results
General Information
A total of 140 patients with epithelial ovarian cancer (EOC) were selected based on the inclusion and exclusion criteria. Among these, 84 patients were included in the training set, and 56 patients in the validation set. After performing multiple imputations for missing data (which affected less than 5% of data points for variables like PD-L1 positivity rate and tumor maximum diameter), the clinical characteristics of the patients are summarized in Table 1. There was a statistically significant difference in FIGO stage distribution between the training and validation cohorts (P<0.05), with the validation cohort having fewer Stage I/II cases and more Stage III/IV cases; other baseline characteristics were comparable. This imbalance was noted, and the model’s performance was assessed in both cohorts independently to ensure robustness.
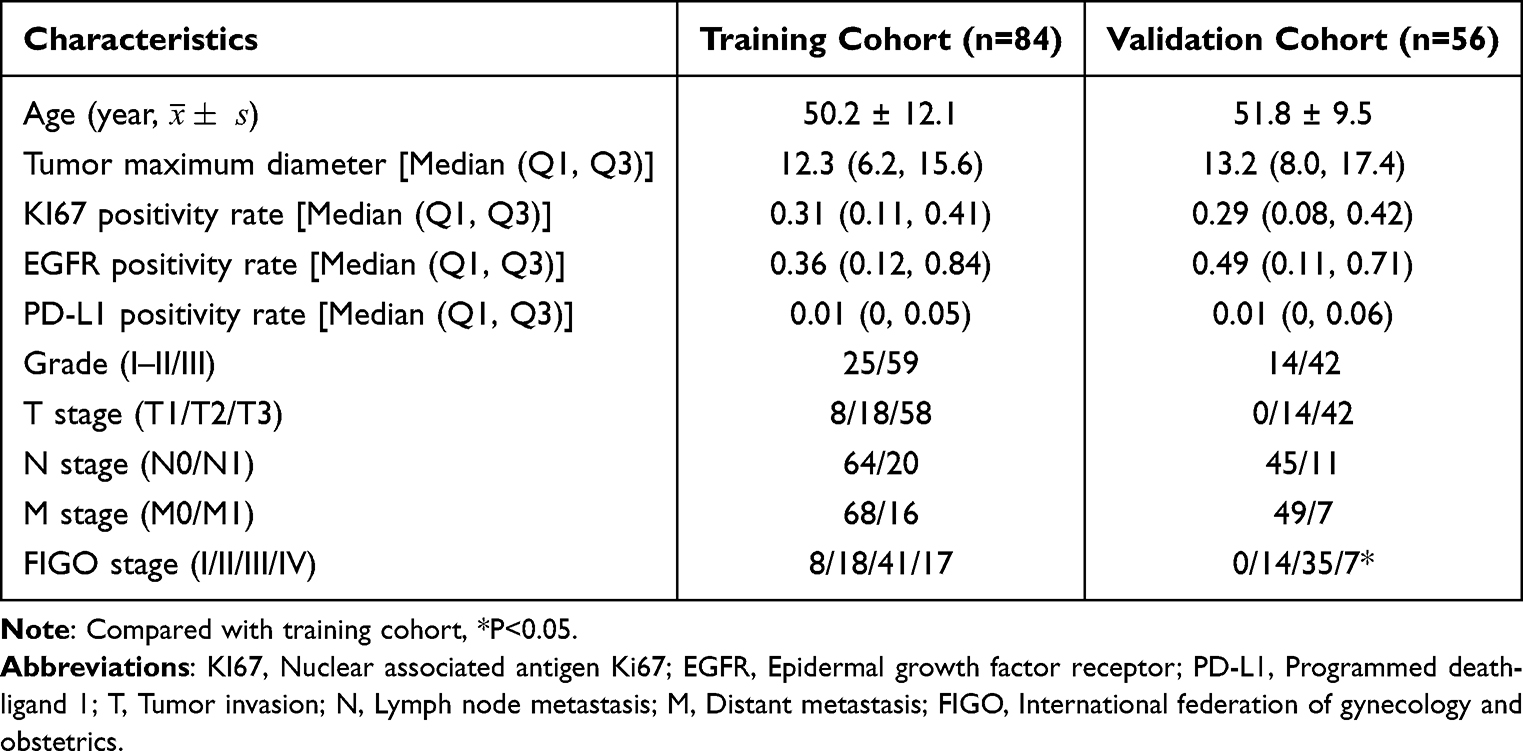 |
Table 1 General Information of EOC Patients |
Univariate Cox Regression Analysis for Screening Prognostic Variables
Univariate Cox regression analysis identified seven variables significantly associated with overall survival (OS) in ovarian cancer patients. These variables include:• Maximum tumor diameter (hazard ratio [HR] = 1.121, P < 0.05)• KI67 positive rate (HR = 4.852, P < 0.05)• Pathological grade (HR = 3.198, P < 0.05)• N stage (HR = 6.187, P < 0.05)• M stage (HR = 8.901, P < 0.05)• KI67 ≥ 20% (HR = 2.219, P < 0.05)• PD-L1 > 0 (HR = 2.203, P < 0.05).
All of these variables were identified as risk factors influencing the prognosis of ovarian cancer patients.
Lasso-Cox Regression Analysis for Screening Predictive Model Variables
Lasso-Cox regression, using an L1 norm penalty and cross-validation, was applied to the variables identified by univariate Cox regression. Seven variables were ultimately selected for the predictive model: maximum tumor diameter, KI67 positive rate, pathological grade, N stage, M stage, KI67 ≥ 20%, and PD-L1 > 0. EGFR positivity rate was not selected by the Lasso-Cox regression as a significant predictor in the multivariate model.
Construction and Performance Evaluation of the Prognostic Nomogram for Ovarian Cancer Patients
A prognostic nomogram for predicting OS in ovarian cancer patients was constructed based on the variables selected by Lasso-Cox regression. The formula for the prognostic model is as follows: Lasso-Cox=h₀(t)exp[0.112×(Tumor max diameter)+1.128×(KI67 positive rate)+0.953×(Grade)+0.889×(N stage)+1.402×(M stage)+0.358×(KI67 ≥ 20%)+0.321×(PD-L1 > 0)].
The predictive model was visualized using a nomogram, as shown in Figure 1.
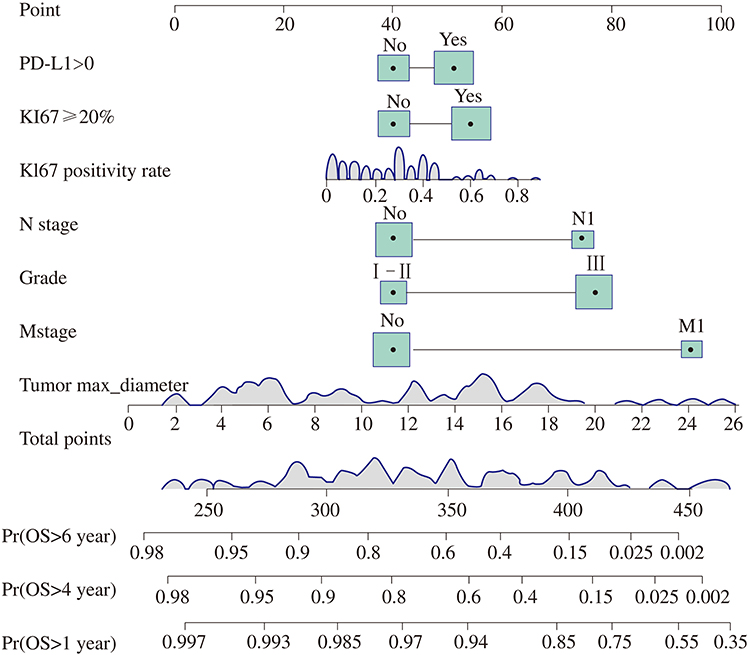 |
Figure 1 Nomogram prediction model for 1-year, 4-year, and 6-year OS of EOC. The nomogram integrates seven variables: PD-L1 >0 (Programmed Death-Ligand 1 positivity), KI67 ≥ 20% (Ki67 positivity threshold), KI67 positivity rate (continuous), N stage (Lymph Node metastasis status), Grade (Pathological grade), M stage (Distant Metastasis status; “No” indicates M0), and Tumor max_diameter. Points for each variable are summed to obtain Total Points, which corresponds to predicted probabilities for 1-year, 4-year, and 6-year Overall Survival (Pr(OS)). |
In both the training and validation sets, the concordance index (C-index) for the model was 0.85 [95% confidence interval (CI): 0.80–0.90] and 0.72 (95% CI: 0.65–0.79), respectively. The area under the time-dependent ROC curve (AUC) for predicting 1-, 4-, and 6-year OS in the training set was 0.908, 0.940, and 0.965, respectively. In the validation set, the corresponding AUC values were 0.835, 0.802, and 0.832, as shown in Figure 2. These results indicate that the model demonstrates good predictive performance for OS in ovarian cancer patients.
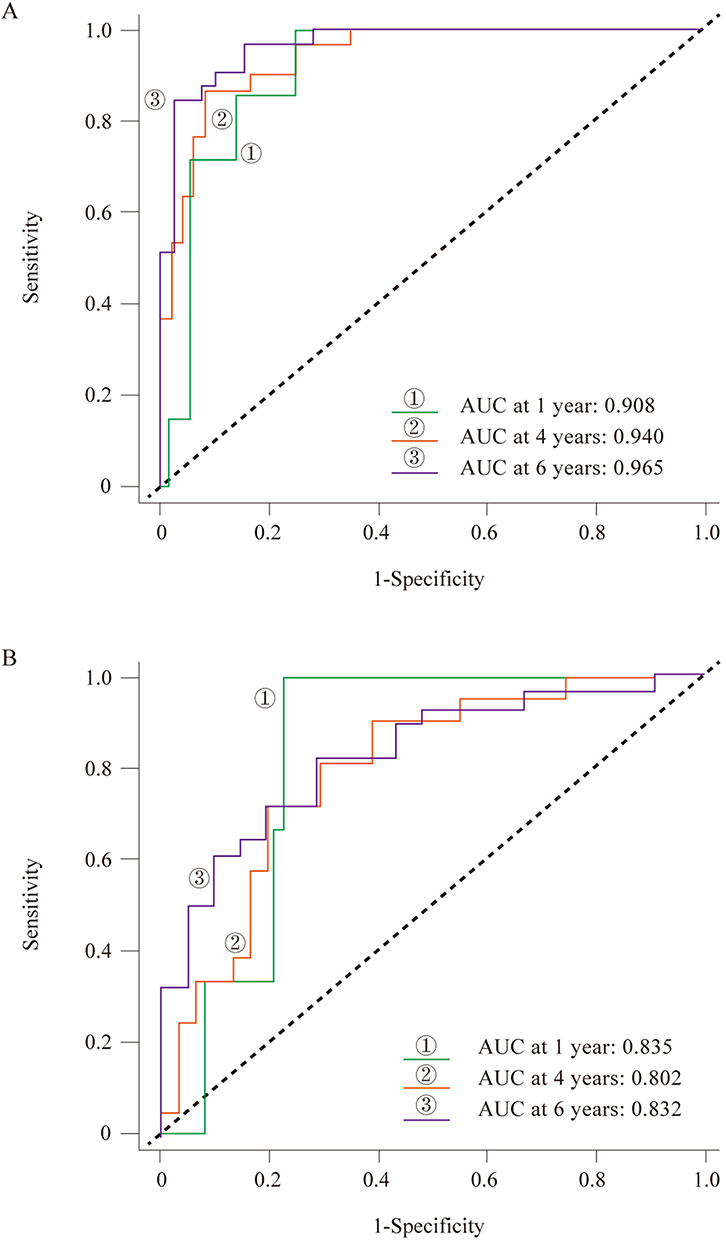 |
Figure 2 Time-dependent ROC curve analysis for predicting 1-year, 4-year, and 6-year OS. (A) Training set; (B) Validation set. ①, ②, and ③ represent AUC values at 1 year, 4 years, and 6 years, respectively. Abbreviation: AUC, Area Under the Curve. |
Calibration curve analysis showed that the model-predicted OS rates were well aligned with actual observations (Hosmer-Lemeshow goodness-of-fit test indicating no significant difference between predicted and observed probabilities: χ² = 13.892, P > 0.05 for the training set; χ² = 8.503, P > 0.05 for the validation set). A P-value > 0.05 in the Hosmer-Lemeshow test suggests good calibration, as the null hypothesis is that there is no difference between the predicted and observed outcomes. Decision curve analysis (DCA) revealed that within the threshold probability range of 5%-50%, the Lasso-Cox model exhibited superior clinical net benefits in both the training and validation sets compared to the traditional TNM staging system, as illustrated in Figure 3. This suggests that using the nomogram to make clinical decisions would lead to a greater net benefit than relying on TNM staging alone across a range of clinically relevant risk thresholds.
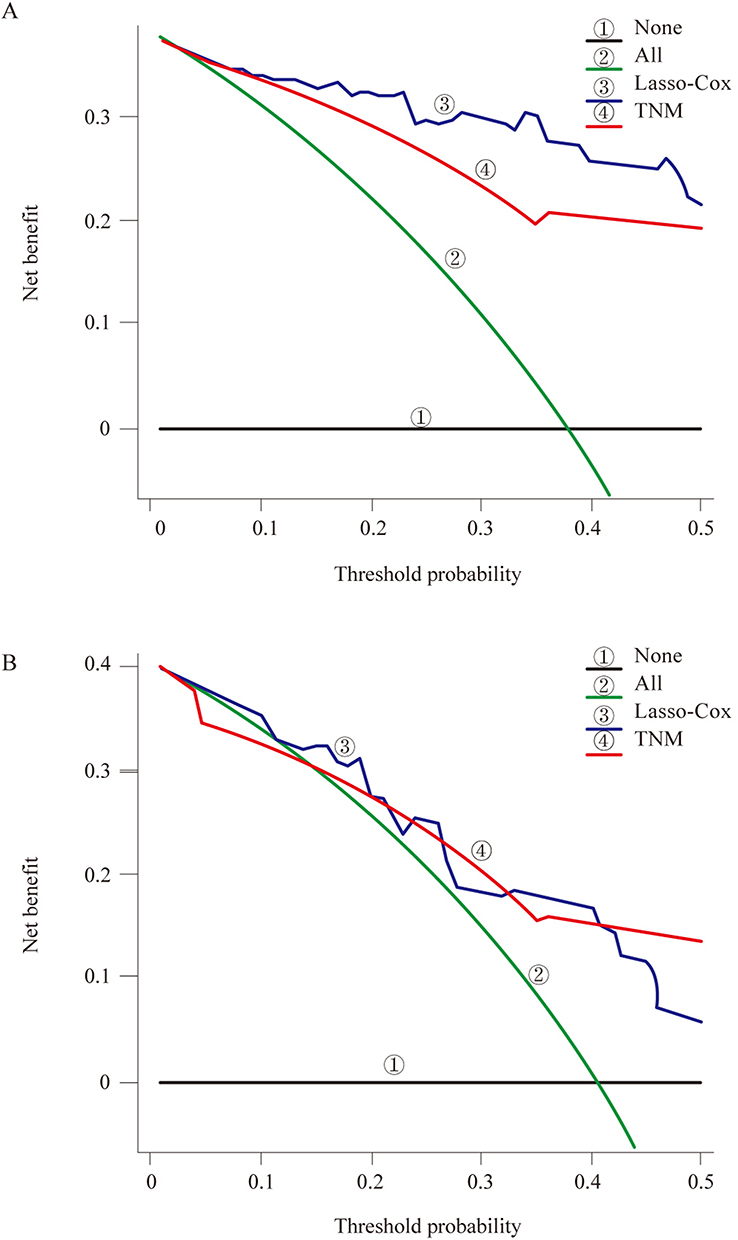 |
Figure 3 DCA curves for OS. (A) Training set; (B) Validation set. ① None (treat no patients); ② All (treat all patients); ③ Lasso-Cox (the proposed nomogram model); ④ TNM (TNM staging system). The y-axis represents the net benefit. Abbreviation: DCA, Decision Curve Analysis. |
Prognostic Value Assessment of Model Risk Scores
Based on the predictive model, the prognostic risk scores were calculated for each patient. Patients were stratified into high-risk and low-risk groups according to the median risk score derived from the training cohort, which was then applied to the validation cohort. Kaplan-Meier survival analysis demonstrated that the high-risk group had significantly worse OS (HR = 17.2, P < 0.01 in training; HR = 4.58, P < 0.01 in validation) and progression-free survival (PFS) (HR = 2.20, P < 0.01 in training; HR = 3.28, P < 0.01 in validation) in both the training and validation sets.
Discussion
This study presents a 7-feature prognostic model that includes maximum tumor diameter, KI67 positive rate, pathological grade, N stage, M stage, KI67 ≥ 20%, and PD-L1 > 0. The model demonstrates good discrimination and calibration in predicting the overall survival (OS) of epithelial ovarian cancer (EOC) patients. Notably, it offers a greater net benefit compared to the traditional TNM staging system, as demonstrated by DCA. In contrast to conventional mathematical formula-based predictive models, we introduced a nomogram that converts regression coefficients into scores, providing a visual representation of the impact of each factor on the prediction outcome. This approach enhances clarity and aids both physicians and patients in understanding the prognostic influence of each factor.10
Lasso regression, which is based on penalized least squares, is widely used for variable selection in Cox regression modeling. It compresses variable coefficients, reducing model complexity and mitigating the risk of overfitting. This technique is particularly effective when dealing with datasets that vary in the number of predictors and sample sizes.11
Several previous studies have explored the relationship between traditional clinical features—such as N stage, M stage, and pathological grade—and the prognosis of EOC patients. These studies consistently found that poor tumor differentiation, lymph node involvement, and distant metastasis are associated with an increased risk of mortality and poor prognosis,12,13 which is consistent with our findings. Maximum tumor diameter, a key indicator of tumor size, reflects the biological heterogeneity of the tumor. Previous research has identified tumor size as an independent risk factor for ovarian cancer prognosis,14 and our study further corroborates the role of maximum tumor diameter as a significant risk factor in EOC prognosis.
The nuclear protein KI67, which is closely linked to cell proliferation and invasion,15 was found in our study to be associated with worse OS in EOC patients. Ki67 is expressed during all active phases of the cell cycle (G1, S, G2, mitosis) but is absent in resting cells (G0), making it a reliable marker of the growth fraction of a cell population. High Ki67 expression indicates a greater proportion of actively dividing tumor cells, which often correlates with more aggressive tumor behavior and resistance to certain therapies. This finding aligns with a meta-analysis that also identified a high KI67 positive rate as a marker of poor prognosis.16 Notably, EOC patients with a KI67 positive rate ≥ 20% experienced significantly worse OS. Further investigation revealed that EGFR, another biomarker associated with tumor proliferation, was not correlated with EOC prognosis in our multivariate model, likely due to the low frequency of EGFR mutations in ovarian cancer patients,17 though EGFR overexpression can occur via other mechanisms and its role remains complex and may vary between studies.18
PD-L1, a critical immune checkpoint molecule, binds to the PD-1 receptor on T cells, promoting T cell apoptosis and facilitating tumor immune escape. This interaction dampens the anti-tumor immune response, allowing cancer cells to evade destruction by cytotoxic T lymphocytes. Our study showed that EOC patients with a PD-L1 positive rate > 0 had worse OS. However, it is important to note that there is currently no universally accepted cutoff value for PD-L1 expression, and the standards vary depending on the detection antibody used, the cell types assessed (tumor cells vs immune cells), and the specific cancer type.19 As a result, further large-scale clinical studies are needed to establish a standardized cutoff value for PD-L1 and refine its prognostic significance.
This study has several notable strengths and limitations. By incorporating both tumor proliferation and immune-related biomarkers into the prognostic model, we effectively capture the complex biological heterogeneity of ovarian cancer. This enhances the model’s accuracy and generalizability, offering a more nuanced understanding of patient prognosis. However, the study’s reliance on data from a single tissue microarray supplier, albeit representing multiple institutions, and its retrospective design may limit the external validity of the model. This constraint could impact the broader applicability of the findings, and further validation in multicenter prospective cohorts is warranted. Additionally, while multiple imputation was used for missing data, this cannot fully replace complete data. The imbalance in FIGO staging between training and validation cohorts, though addressed by separate validation, is another limitation.
Conclusion
In conclusion, this study successfully developed and validated a novel nomogram incorporating clinical features, tumor proliferation marker Ki67, and immune checkpoint molecule PD-L1 for predicting 1-, 4-, and 6-year OS in EOC patients. The nomogram demonstrated good predictive accuracy and calibration, outperforming the traditional TNM staging system in terms of clinical net benefit. This user-friendly tool has the potential to assist clinicians in more accurately stratifying patients by risk, thereby facilitating personalized treatment planning and potentially improving outcomes for individuals with ovarian cancer. Further prospective, multicenter studies are recommended to confirm its clinical utility.
Data Sharing Statement
Data is provided within the manuscript files, further enquiries can be directed to the corresponding author.
Ethics Approval and Consent to Participate
The study protocol was approved by the Ethics Committee of Hebei General Hospital (NO. 2024-SHH-108). The study was performed in accordance with the Helsinki II declaration. The tissue microarray (HOvaC154Su01) used in this study was commercially sourced from Shanghai Xinchao Biotechnology Co., Ltd. The supplier confirmed that all tissue samples were collected with informed consent from patients for research use and under ethical approvals from the originating institutions, in compliance with national and international guidelines. Specific patient identifiers were anonymized prior to inclusion in the microarray.
Author Contributions
All authors made a significant contribution to the work reported, whether that is in the conception, study design, execution, acquisition of data, analysis and interpretation, or in all these areas; took part in drafting, revising or critically reviewing the article; gave final approval of the version to be published; have agreed on the journal to which the article has been submitted; and agree to be accountable for all aspects of the work.
Funding
This study was supported by Medical Science Research Project of Hebei (NO. 20240273).
Disclosure
The authors declare that they have no competing interests.
References
1. Siegel RL, Miller KD, Fuchs HE, Jemal A. Cancer statistics, 2022. CA Cancer J Clin. 2022;72(1):7–33. doi:10.3322/caac.21708
2. Penny SM. Ovarian cancer: an overview. Radiol Technol. 2020;91(6):561–575.
3. Chen W, Zheng R, Baade PD, et al. Cancer statistics in China, 2015. CA Cancer J Clin. 2016;66(2):115–132. doi:10.3322/caac.21338
4. Lheureux S, Gourley C, Vergote I, Oza AM. Epithelial ovarian cancer. Lancet. 2019;393(10177):1240–1253. doi:10.1016/s0140-6736(18)32552-2
5. Webb PM, Jordan SJ. Epidemiology of epithelial ovarian cancer. Best Pract Res Clin Obstet Gynaecol. 2017;41:3–14. doi:10.1016/j.bpobgyn.2016.08.006
6. Amin MB, Edge S, Greene F. AJCC Cancer Staging Manual.
7. Hanahan D, Weinberg RA. Hallmarks of cancer: the next generation. Cell. 2011;144(5):646–674. doi:10.1016/j.cell.2011.02.013
8. Sigismund S, Avanzato D, Lanzetti L. Emerging functions of the EGFR in cancer. Mol Oncol. 2018;12(1):3–20. doi:10.1002/1878-0261.12155
9. Duduyemi BM, Ayibor WG, Agyemang-Yeboah F. Tissue microarray immunohistochemical staining for androgen receptor in breast cancer in a Ghanaian cohort. Ann Afr Med. 2024;23(3):452–458. doi:10.4103/aam.aam_83_23
10. Zhou ZR, Wang WW, Li Y, et al. In-depth mining of clinical data: the construction of clinical prediction model with R. Ann Transl Med. 2019;7(23):796. doi:10.21037/atm.2019.08.63
11. Bunea F, She Y, Ombao H, Gongvatana A, Devlin K, Cohen R. Penalized least squares regression methods and applications to neuroimaging. Neuroimage. 2011;55(4):1519–1527. doi:10.1016/j.neuroimage.2010.12.028
12. Wang R, Xie G, Shang L, et al. Development and validation of nomograms for epithelial ovarian cancer: a SEER population-based, real-world study. Future Oncol. 2021;17(8):893–906. doi:10.2217/fon-2020-0531
13. Chen S, Lu H, Jiang S, et al. An analysis of clinical characteristics and prognosis of endometrioid ovarian cancer based on the SEER database and two centers in China. BMC Cancer. 2023;23(1):608. doi:10.1186/s12885-023-11048-1
14. Zhang T, Zhu L. Nomogram for predicting postoperative cancer-specific early death in patients with epithelial ovarian cancer based on the SEER database: a large cohort study. Arch Gynecol Obstet. 2022;305(6):1535–1549. doi:10.1007/s00404-021-06342-x
15. Schlüter C, Duchrow M, Wohlenberg C, et al. The cell proliferation-associated antigen of antibody Ki-67: a very large, ubiquitous nuclear protein with numerous repeated elements, representing a new kind of cell cycle-maintaining proteins. J Cell Biol. 1993;123(3):513–522. doi:10.1083/jcb.123.3.513
16. Qiu D, Cai W, Zhang Z, Li H, Zhou D. High Ki-67 expression is significantly associated with poor prognosis of ovarian cancer patients: evidence from a meta-analysis. Arch Gynecol Obstet. 2019;299(5):1415–1427. doi:10.1007/s00404-019-05082-3
17. Cancer Genome Atlas Research Network. Integrated genomic analyses of ovarian carcinoma. Nature. 2011;474(7353):609–615. doi:10.1038/nature10166
18. Siwak DR, Carey M, Hennessy BT, et al. Targeting the epidermal growth factor receptor in epithelial ovarian cancer: current knowledge and future challenges. J Oncol. 2010;2010:568938. doi:10.1155/2010/568938
19. Patel SP, Kurzrock R. PD-L1 expression as a predictive biomarker in cancer immunotherapy. Mol Cancer Ther. 2015;14(4):847–856. doi:10.1158/1535-7163.mct-14-0983
 © 2025 The Author(s). This work is published and licensed by Dove Medical Press Limited. The
full terms of this license are available at https://www.dovepress.com/terms
and incorporate the Creative Commons Attribution
- Non Commercial (unported, 4.0) License.
By accessing the work you hereby accept the Terms. Non-commercial uses of the work are permitted
without any further permission from Dove Medical Press Limited, provided the work is properly
attributed. For permission for commercial use of this work, please see paragraphs 4.2 and 5 of our Terms.
© 2025 The Author(s). This work is published and licensed by Dove Medical Press Limited. The
full terms of this license are available at https://www.dovepress.com/terms
and incorporate the Creative Commons Attribution
- Non Commercial (unported, 4.0) License.
By accessing the work you hereby accept the Terms. Non-commercial uses of the work are permitted
without any further permission from Dove Medical Press Limited, provided the work is properly
attributed. For permission for commercial use of this work, please see paragraphs 4.2 and 5 of our Terms.