Back to Journals » Cancer Management and Research » Volume 14
Development and Validation of a New Multiparametric Random Survival Forest Predictive Model for Breast Cancer Recurrence with a Potential Benefit to Individual Outcomes
Authors Li H ![]() , Liu RB, Long CM, Teng Y, Cheng L, Liu Y
, Liu RB, Long CM, Teng Y, Cheng L, Liu Y
Received 29 October 2021
Accepted for publication 27 January 2022
Published 1 March 2022 Volume 2022:14 Pages 909—923
DOI https://doi.org/10.2147/CMAR.S346871
Checked for plagiarism Yes
Review by Single anonymous peer review
Peer reviewer comments 2
Editor who approved publication: Professor Seema Singh
Huan Li,1,* Ren-Bin Liu,1,* Chen-Meng Long,2 Yuan Teng,3 Lin Cheng,1 Yu Liu1
1Department of Thyroid and Breast Surgery, Third Affiliated Hospital of Sun Yat-sen University, Guangzhou, Guangdong, People’s Republic of China; 2Department of Breast Surgery, Liuzhou Women and Children’s Medical Center, Liuzhou, Guangxi, People’s Republic Of China; 3Department of Breast Surgery, Guangzhou Women and Children’s Medical Center, Guangzhou, Guangdong, People’s Republic of China
*These authors contributed equally to this work
Correspondence: Yu Liu, Tel +8613560170809, Fax +86 20 85252154, Email [email protected]
Purpose: Breast cancer (BC) is a multi-factorial disease. Its individual prognosis varies; thus, individualized patient profiling is instrumental to improving BC management and individual outcomes. An economical, multiparametric, and practical model to predict BC recurrence is needed.
Patients and Methods: We retrospectively investigated the clinical data of BC patients treated at the Third Affiliated Hospital of Sun Yat-sen University and Liuzhou Women and Children’s Medical Center from January 2013 to December 2020. Random forest-recursive feature elimination (run by R caret package) was used to determine the best variable set, and the random survival forest method was used to develop a predictive model for BC recurrence.
Results: The training and validations sets included 623 and 151 patients, respectively. We selected 14 variables, the pathological (TNM) stage, gamma-glutamyl transpeptidase, total cholesterol, Ki-67, lymphocyte count, low-density lipoprotein, age, apolipoprotein B, high-density lipoprotein, globulin, neutrophil count to lymphocyte count ratio, alanine aminotransferase, triglyceride, and albumin to globulin ratio, using random survival forest (RSF)-recursive feature elimination. We developed a recurrence prediction model using RSF. Using area under the receiver operating characteristic curve and Kaplan–Meier survival analyses, the model performance was determined to be accurate. C-indexes were 0.997 and 0.936 for the training and validation sets, respectively.
Conclusion: The model could accurately predict BC recurrence. It aids clinicians in identifying high-risk patients and making treatment decisions for Breast cancer patients in China. This new multiparametric RSF model is instrumental for breast cancer recurrence prediction and potentially improves individual outcomes.
Keywords: breast cancer, random survival forest, recurrence, individualized patient profiles, multi-level diagnostics and disease modeling
Introduction
Breast cancer (BC) is a malignant tumor originating from the epithelial tissue of the breast. The incidence of BC has been increasing annually, and BC has become a significant threat to women’s health. According to the data of GLOBOCAN 2020, the number of new cases of female BC is estimated to be 2.3 million (11.7%), surpassing lung cancer as the most common cancer type.1 In China, morbidity and mortality rates of BC have increased in recent years because of lifestyle changes, dietary regimens, and the natural environment.2,3
Conventional prognostic factors for BC include tumor-node-metastasis (TNM) stage (tumor size, number of metastatic lymph nodes, distant metastatic state), tumor grade, and expression of molecular biomarkers such as estrogen receptor (ER), progesterone receptor (PR), Ki-67, and human epidermal growth factor receptor 2 (HER-2).4 However, patient characteristics, including age, body fat, and nutritional and inflammatory status, affect tumor prognosis.5–8 With the recent development of gene technology, several studies have focused on the genetic diagnosis of BC, and researchers have proposed the integration of multiple genes and molecular markers to construct new prognostic models for predicting BC prognosis. One of them was the 21-gene recurrence score assay, which considers the expression of 21 genes to accurately predict the risk of BC recurrence in patients.9 However, gene detection requires proficient technological devices and is costly; thus, it is still not widely used.9
Overall, prognostic factors of BC include not only the tumor itself but also patient characteristics. Using tumor or patient characteristics separately to predict BC recurrence may be inaccurate.10,11 The genetic prediction of BC recurrence has been shown to be accurate, but obtaining genetic information is laborious, time-consuming, and relatively expensive, which has greatly limited use in clinical practice.9
Breast cancer is a multi-factorial disease, so individualized patient profiling is instrumental to improving BC management and individual outcomes. Thus, the paradigm shift from a reactive to a predictive, preventive, and personalized medicine approach is essential to improve BC management.12–14 Thus, a comprehensive, accurate, and low-cost predictive model using multi-level diagnostics and disease modeling that can be used in clinical practice is needed.
The rapid development of machine learning technologies has facilitated the construction of predictive models that can efficiently evaluate numerous parameters. However, conventional models often have a low level of predictive accuracy due to overfitting.15 Random survival forest (RSF), derived from random forest, is a machine learning method based on both random forest and survival analysis.16 It has the following advantages: it has no special requirements for the data set and can be used to analyze data for which a number of variables are significantly larger than the sample size. Moreover, RSF effectively avoids problems associated with overfitting and collinearity.17–19 Further, no restrictions on the type of data or the association between predictive variables and outcomes are needed, nor is RSF constrained by proportional risk or logarithmic linear assumptions. As a result, higher levels of accuracy are achieved.16,20 To capitalize on the advantages of the machine learning method, we developed a new predictive model for BC recurrence using RSF, which was based on baseline, cross-sectional, common clinical variables, including general patient information, blood tests, pathological examinations, and adverse events due to treatment.
Here, we hypothesized that multi-level diagnostics and disease modeling may lead to the identification of risk of recurrence for BC patients. Furthermore, a multi-omic predictive model using machine learning was considered a potent tool for stratifying patients with high versus low risk for BC recurrence.
Methods
A retrospective survey of BC patients’ medical records was performed at the Third Affiliated Hospital of Sun Yat-sen University and Liuzhou Women and Children’s Medical Center between January 2013 and December 2020. All patients enrolled in this cohort study were diagnosed with stage 0 to III primary BC and had received primary BC therapy. Patients lost to follow-up and those with tumor stage IV, a history of cancer, other synchronous malignancies, or incomplete important information (lacking more than 50% variables) were excluded from the study. Patients diagnosed and treated at the Third Affiliated Hospital of Sun Yat-sen University were included in the training set for model development, and patients diagnosed and treated at Liuzhou Women and Children’s Medical Center were included in the validation set for model validation. The flowchart of the study design and patient selection is shown in Figure 1.
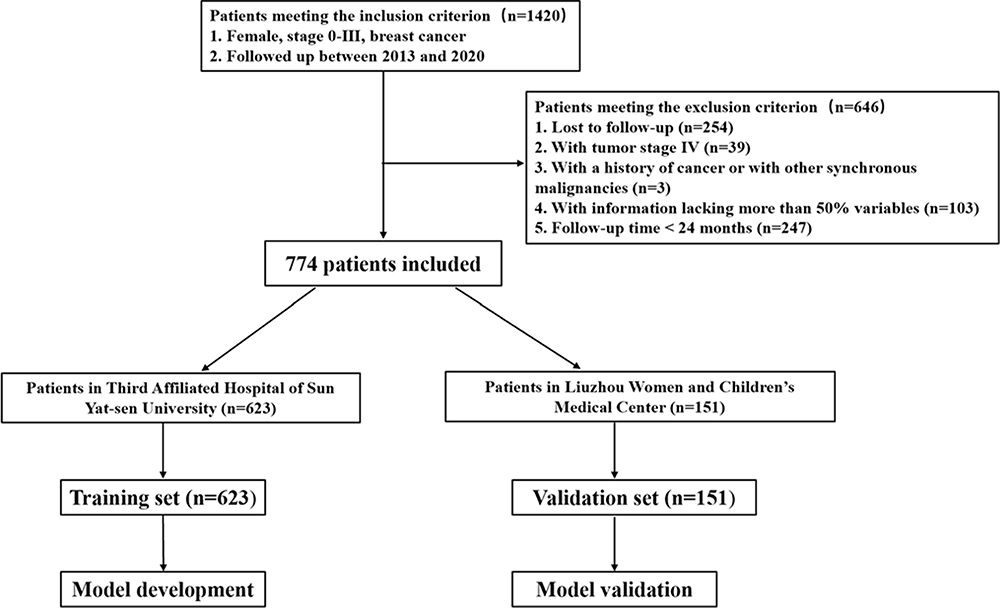 |
Figure 1 Flowchart of the study design and patient selection. |
This study was approved by the ethics committee of the Third Affiliated Hospital of Sun Yat-sen University and Liuzhou Women and Children’s Medical Center. The study was in compliance with the Declaration of Helsinki and its later amendments. All study participants provided informed consent to review their medical records. Identifiable data involving the individuals in this study were encrypted.
Potential Predictors
The patients’ data were obtained from their medical records. The results of the routine peripheral blood parameters and biochemical parameters before initiating any treatment were reviewed. The complete blood cell counts and biochemical parameters were measured by standard clinical laboratory methods. White blood cell (WBC), neutrophil (NEUT), and platelet (PLT) counts were collected, and the neutrophil count to lymphocyte count ratio (NLR) and platelet count to lymphocyte count ratio (PLR) were calculated. We retrospectively investigated patients’ characteristics, including age, type of chemotherapy, chemotherapy toxicities, and prognoses based on a review of patients’ medical records or telephonic follow-up.
ER, PR, and Ki67 status was assessed by immunohistochemistry (IHC). HER-2 status was evaluated by IHC and/or fluorescence in situ hybridization (FISH). Tumors exhibiting greater than or equal to 10% positivity for ER or PR at any staining intensity among the total tumor cells were considered positive. The HER-2 staining intensity score was evaluated from 0 to 3+. HER-2 membranous staining was evaluated as 0 if no cells showed staining; as 1+ if incomplete, faint staining was present in >10% of cells; as 2+ if complete, moderate staining was present in >10% of cells; and as 3+ if complete, strong staining was present in >10% of cells. An HER-2 score of 0–1+ was considered negative, and when HER-2 score was 2+ and 3+, further examination of FISH was performed. Specimens scored as 3+ or confirmed to display amplification based on FISH were considered positive. The patients were categorized into four subtypes based on ER, PR, HER-2, and Ki67 via IHC of their tumor in the following manner: Luminal A (ER+ and/or PR+, HER-2‐, Ki67 <14%), Luminal B (ER+ and/or PR+, HER-2+) or (ER+ and/or PR+, HER-2‐, Ki67 ≥ 14%), HER-2+ (ER‐, PR‐, HER-2+), and TNBC (ER‐, PR‐, HER-2‐). The TNM staging was performed according to histopathology results using the recommendation of the American Joint Committee on Cancer.
Assessment of Adverse Events
Data on adverse events were collected and assessed by the Common Terminology Criteria for Adverse Events version 5.0. The severity of adverse events was measured using grades 1 to 5 as follows:
Grade 1: Mild, asymptomatic or mild symptoms, clinical or diagnostic observations only, and intervention not indicated.
Grade 2: Moderate; minimal, local, or noninvasive intervention indicated; limiting age-appropriate instrumental activities of daily living (ADLs).
Grade 3: Severe or medically significant but not immediately life-threatening; hospitalization or prolongation of hospitalization indicated; disabling; and limiting self-care ADLs.
Grade 4: Life-threatening consequences and urgent intervention indicated.
Grade 5: Death related to adverse events.
Severe adverse events included grades 3 to 5.
Statistical Analyses
The patients’ baseline demographic and clinical characteristics are listed as percentages or means with standard deviation. Student’s t-test or Mann–Whitney U-test was employed to estimate the continuous data, and the chi-squared test was employed to estimate the categorical data. R software was employed when performing all statistical analyses. All analyses were two-tailed, and differences were statistically significant when P was < 0.05.
We used the R mice package (PMM) to interpolate the missing data in the training and validation sets. Based on the characteristics of BC, demographic characteristics, routine blood tests, treatment adverse events, and interruption of treatment, the random forest-recursive feature elimination (RF-RFE) (run by R caret package) was used to determine the best variable set, and the RSF method was used to develop a predictive model for the recurrence risk of BC patients. All the pairs of ntree and mtry were formed by a grid search using 10-fold cross-validation, and those with the best concordance index (C-index) values were identified as the optimized parameters. Moreover, the C-index was used to evaluate the discrimination of the predictive model, and the receiver operating characteristic (ROC) curve and Kaplan-Meier (KM) survival analysis were used to evaluate the precision of the model in predicting BC recurrence.
Results
In total, 774 patients were included in the study. Patients diagnosed with BC and treated at the Third Affiliated Hospital of Sun Yat-sen University were included in the training set (n=623) for model development, and patients diagnosed with BC and treated at Liuzhou Women and Children’s Medical Center were included in the validation set (n=151) for model validation.
We used R-Pack mice (PMM) to interpolate the missing data in the training and validation sets. Basic information regarding the training and validation sets is shown in Table 1.
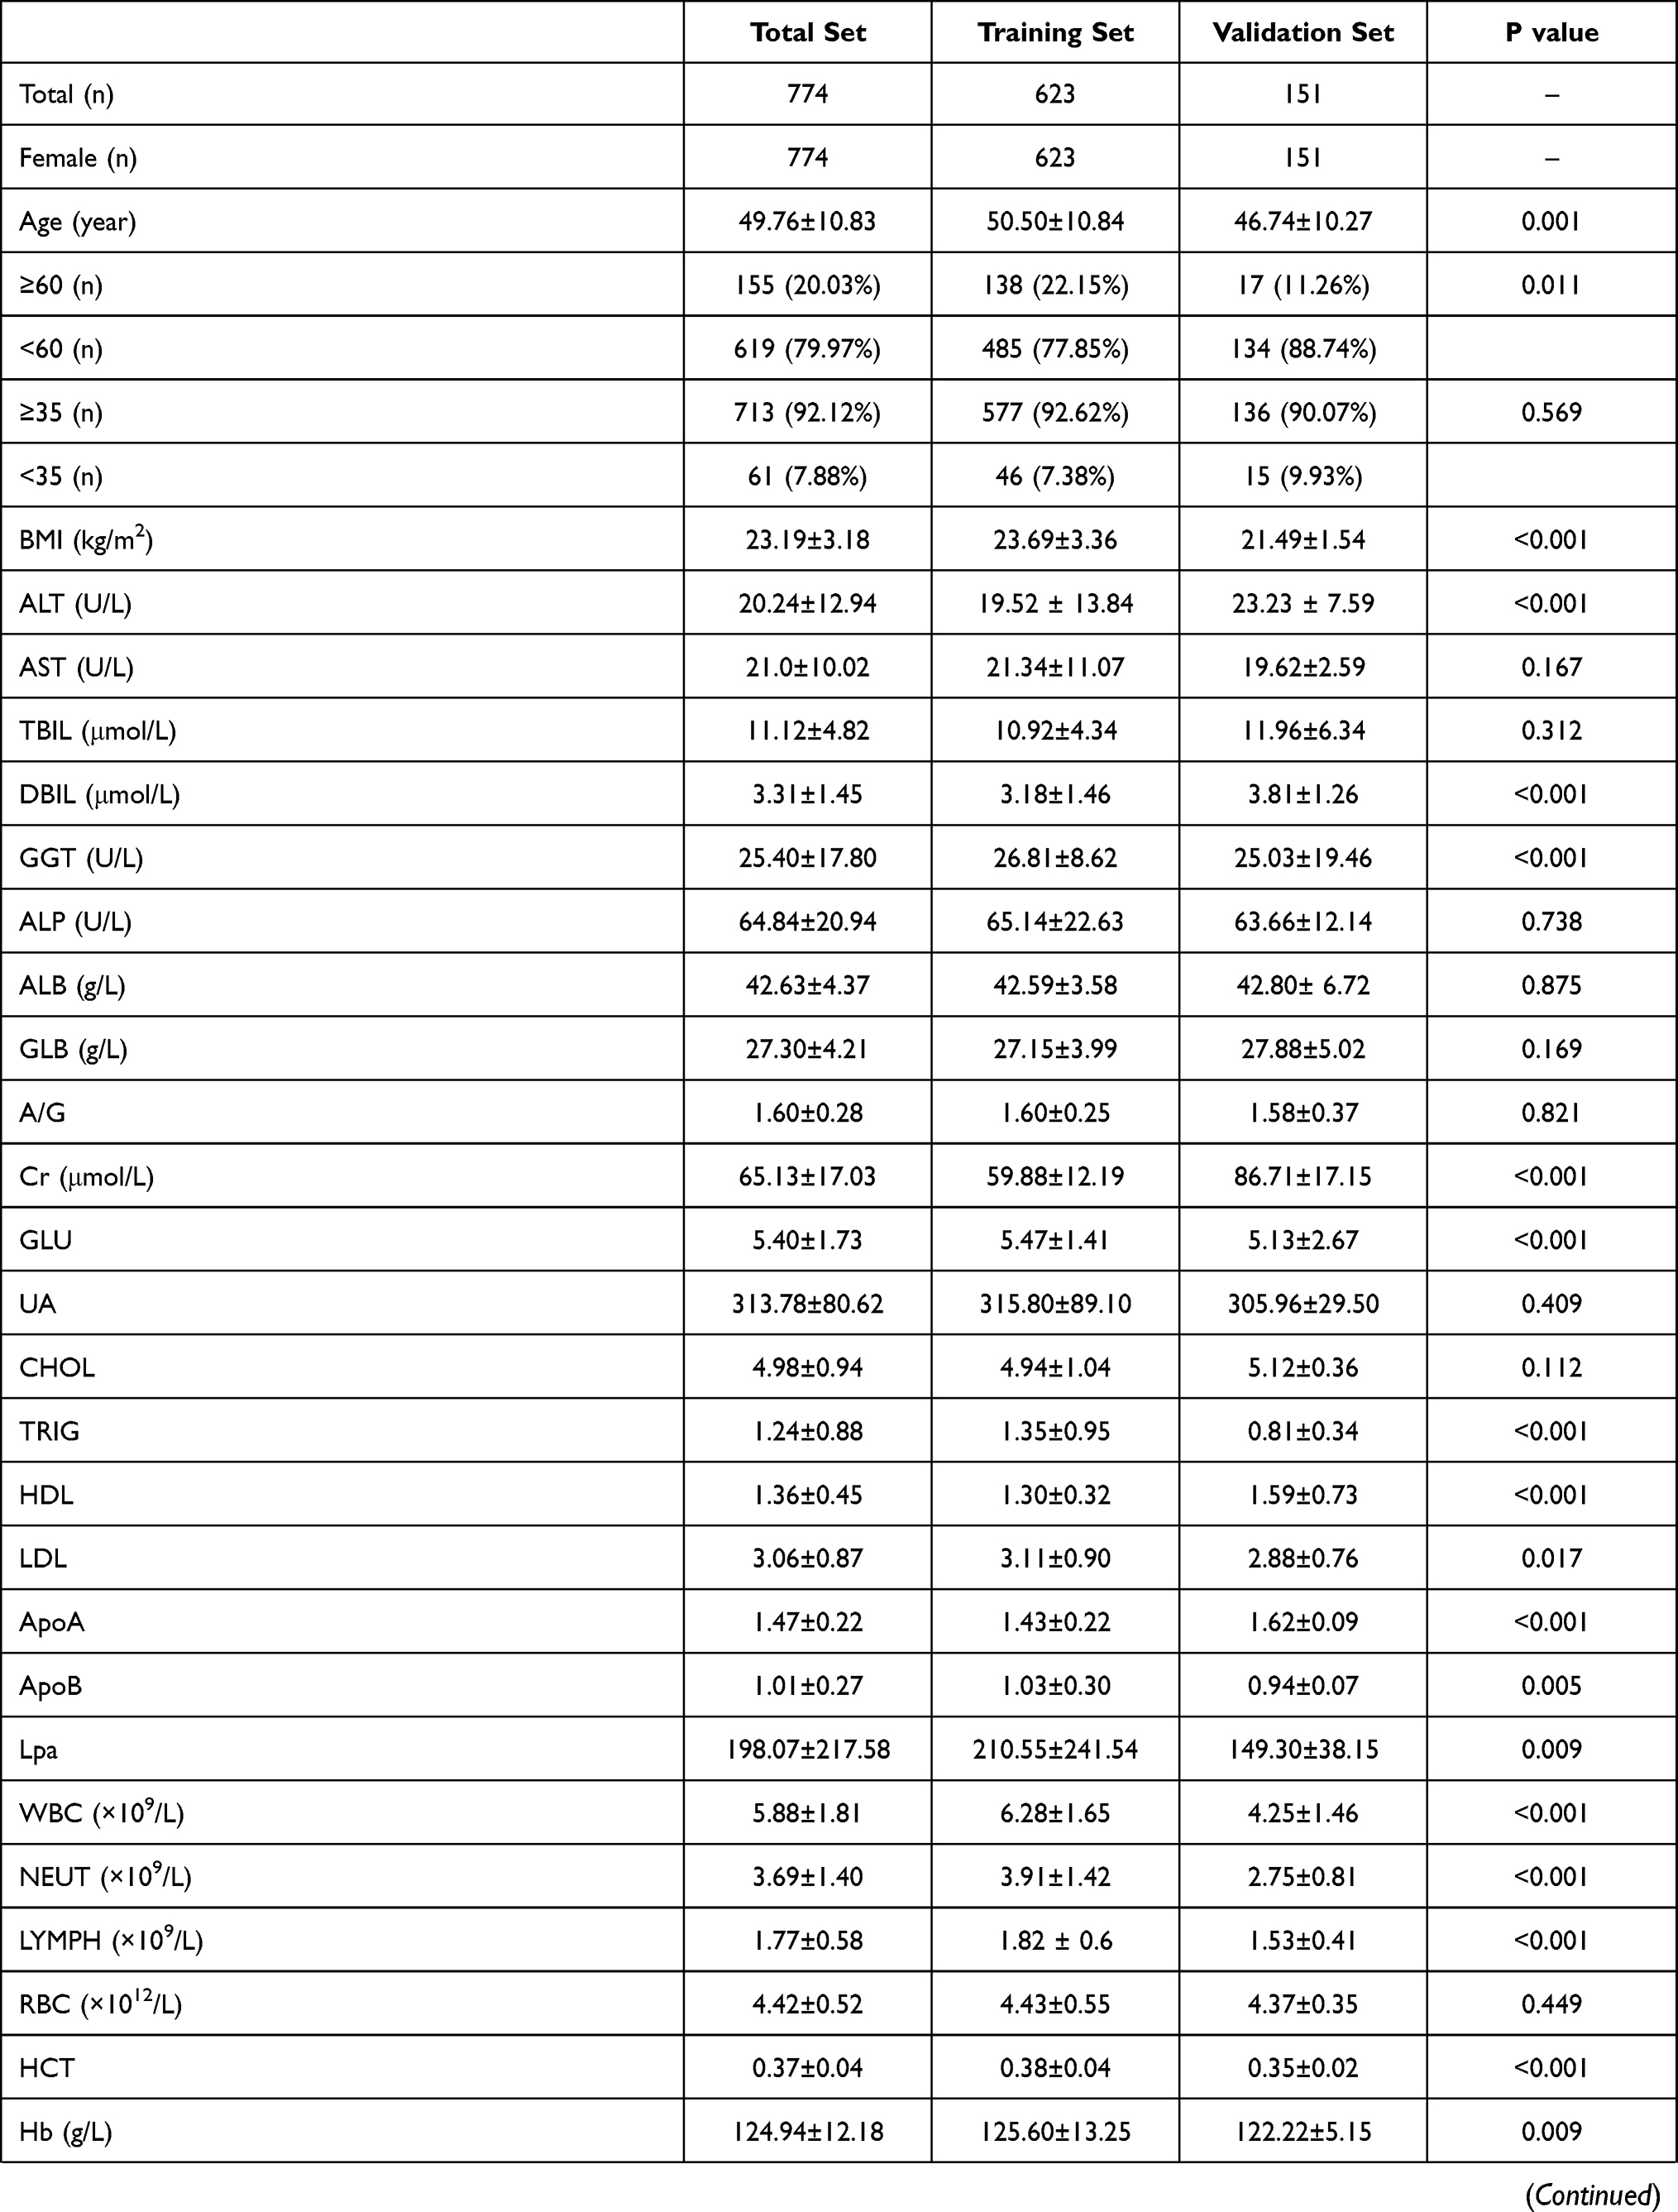 | 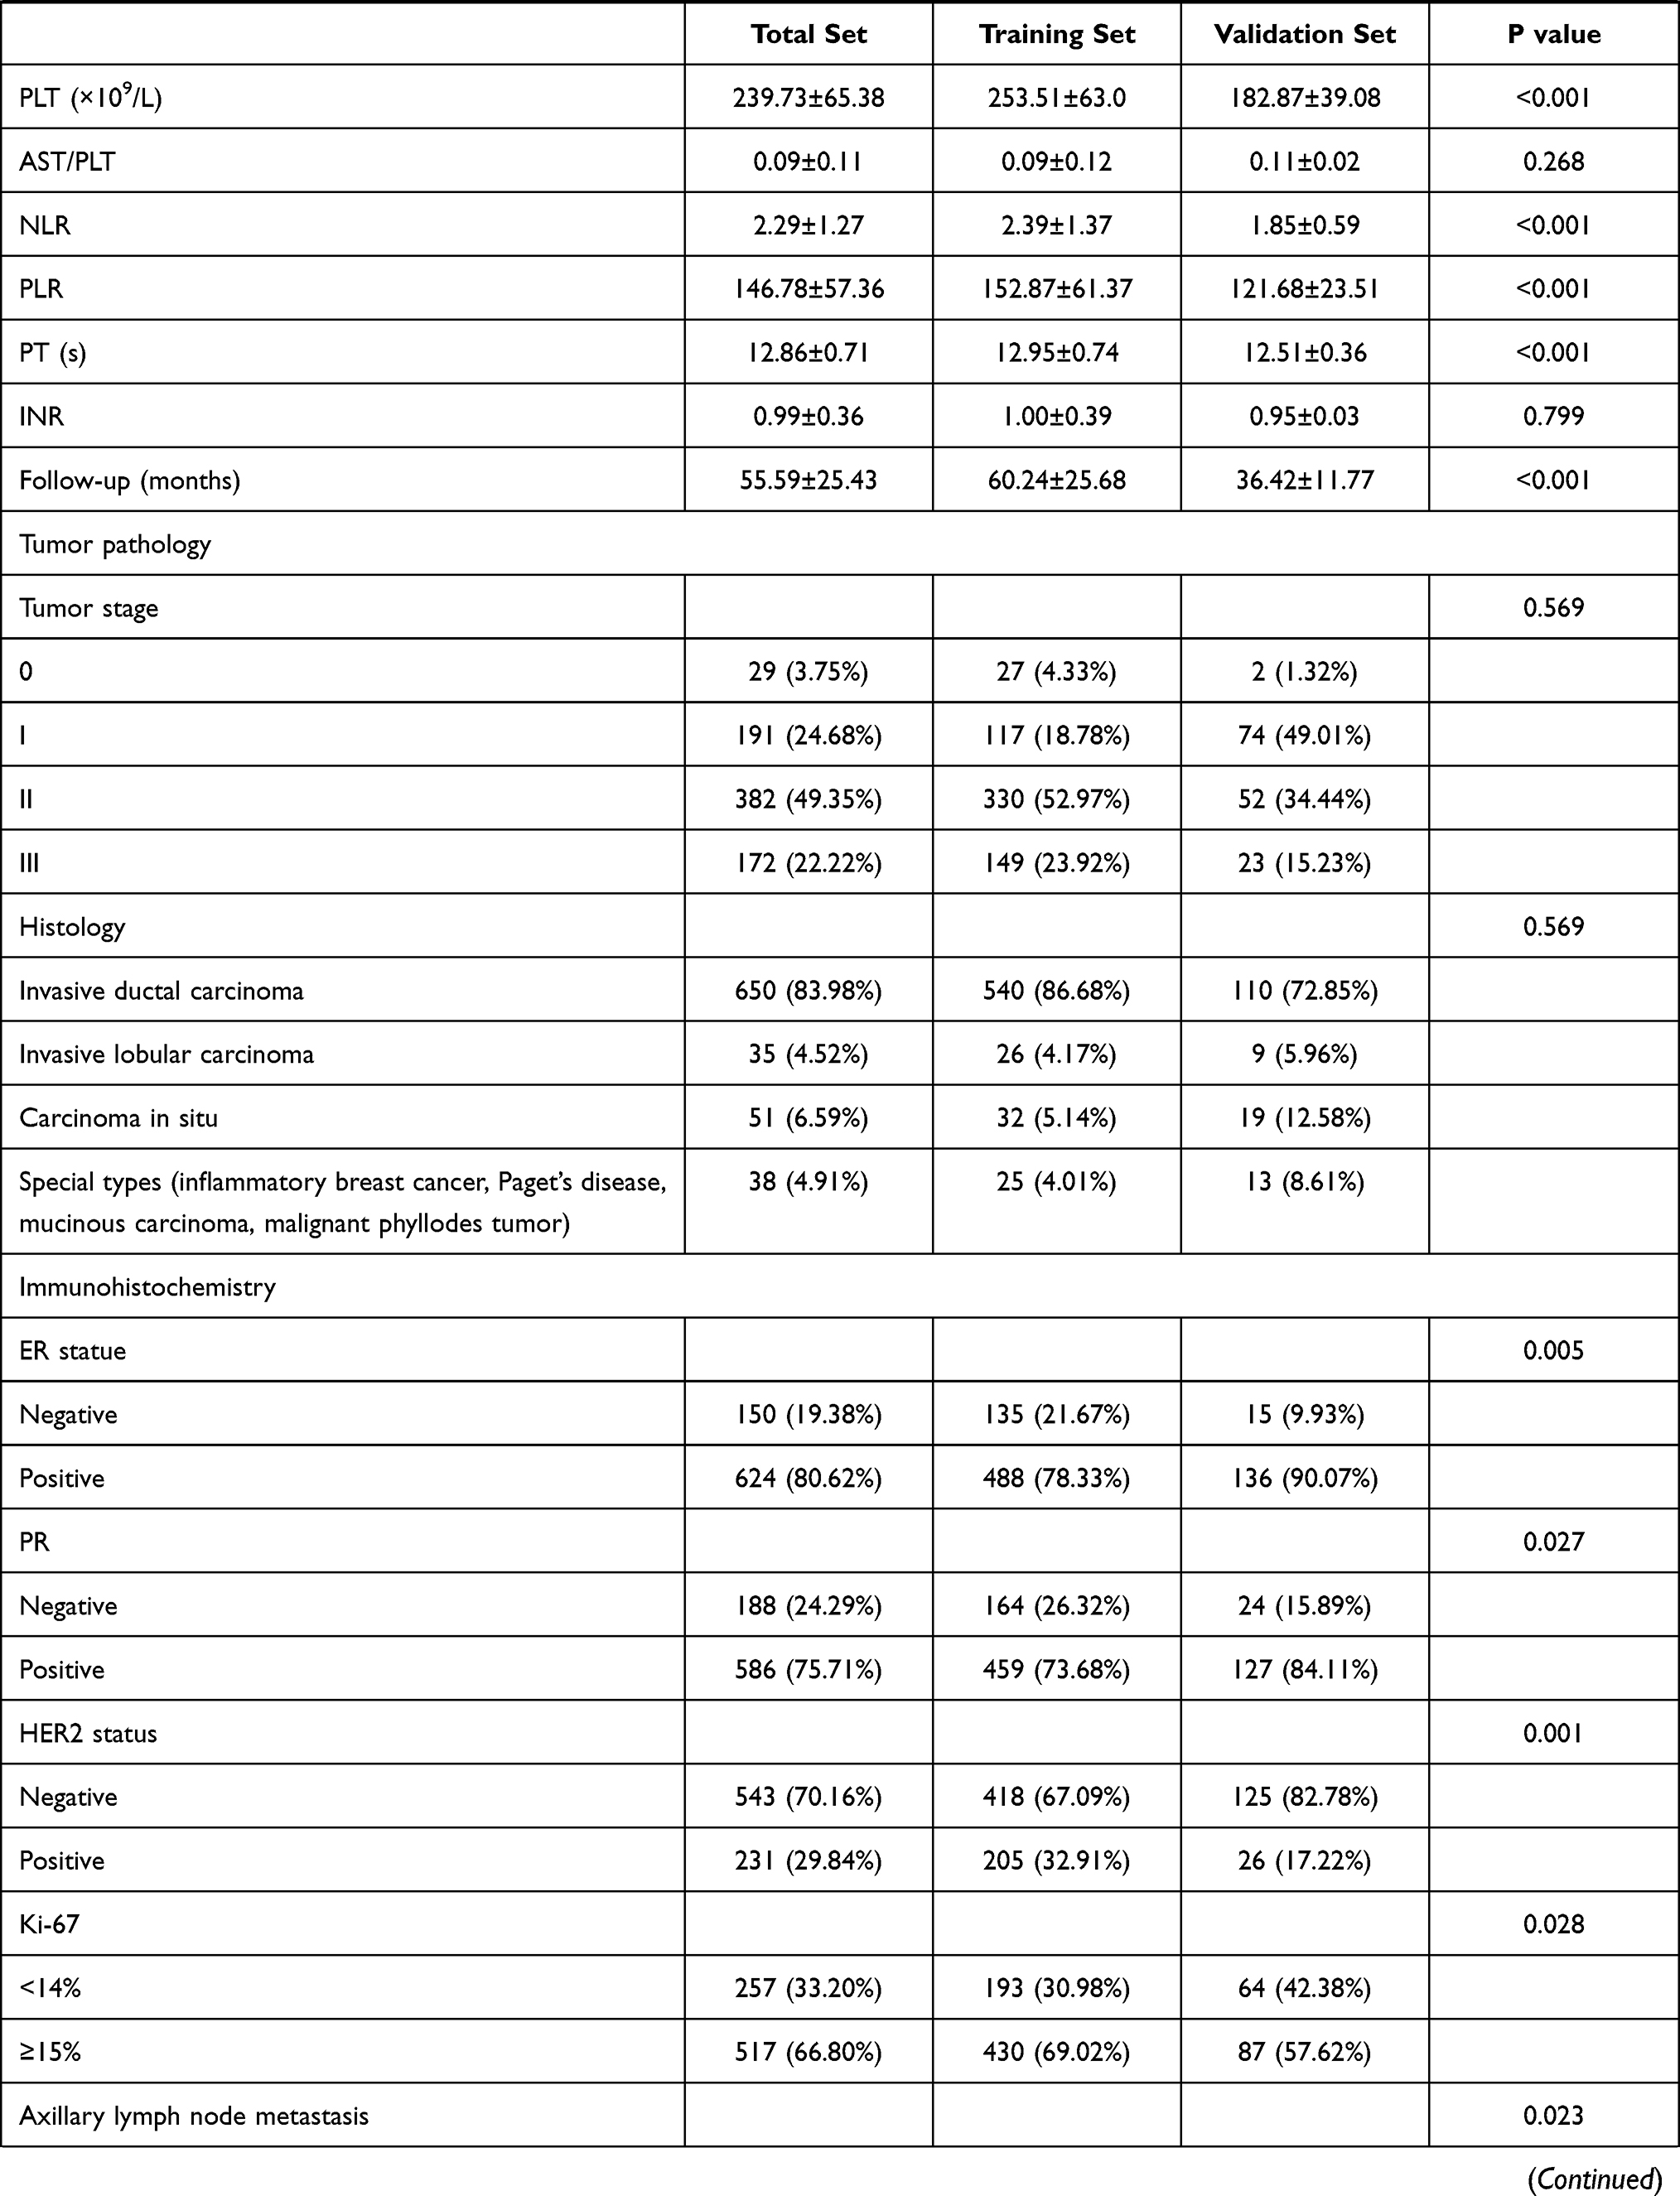 | 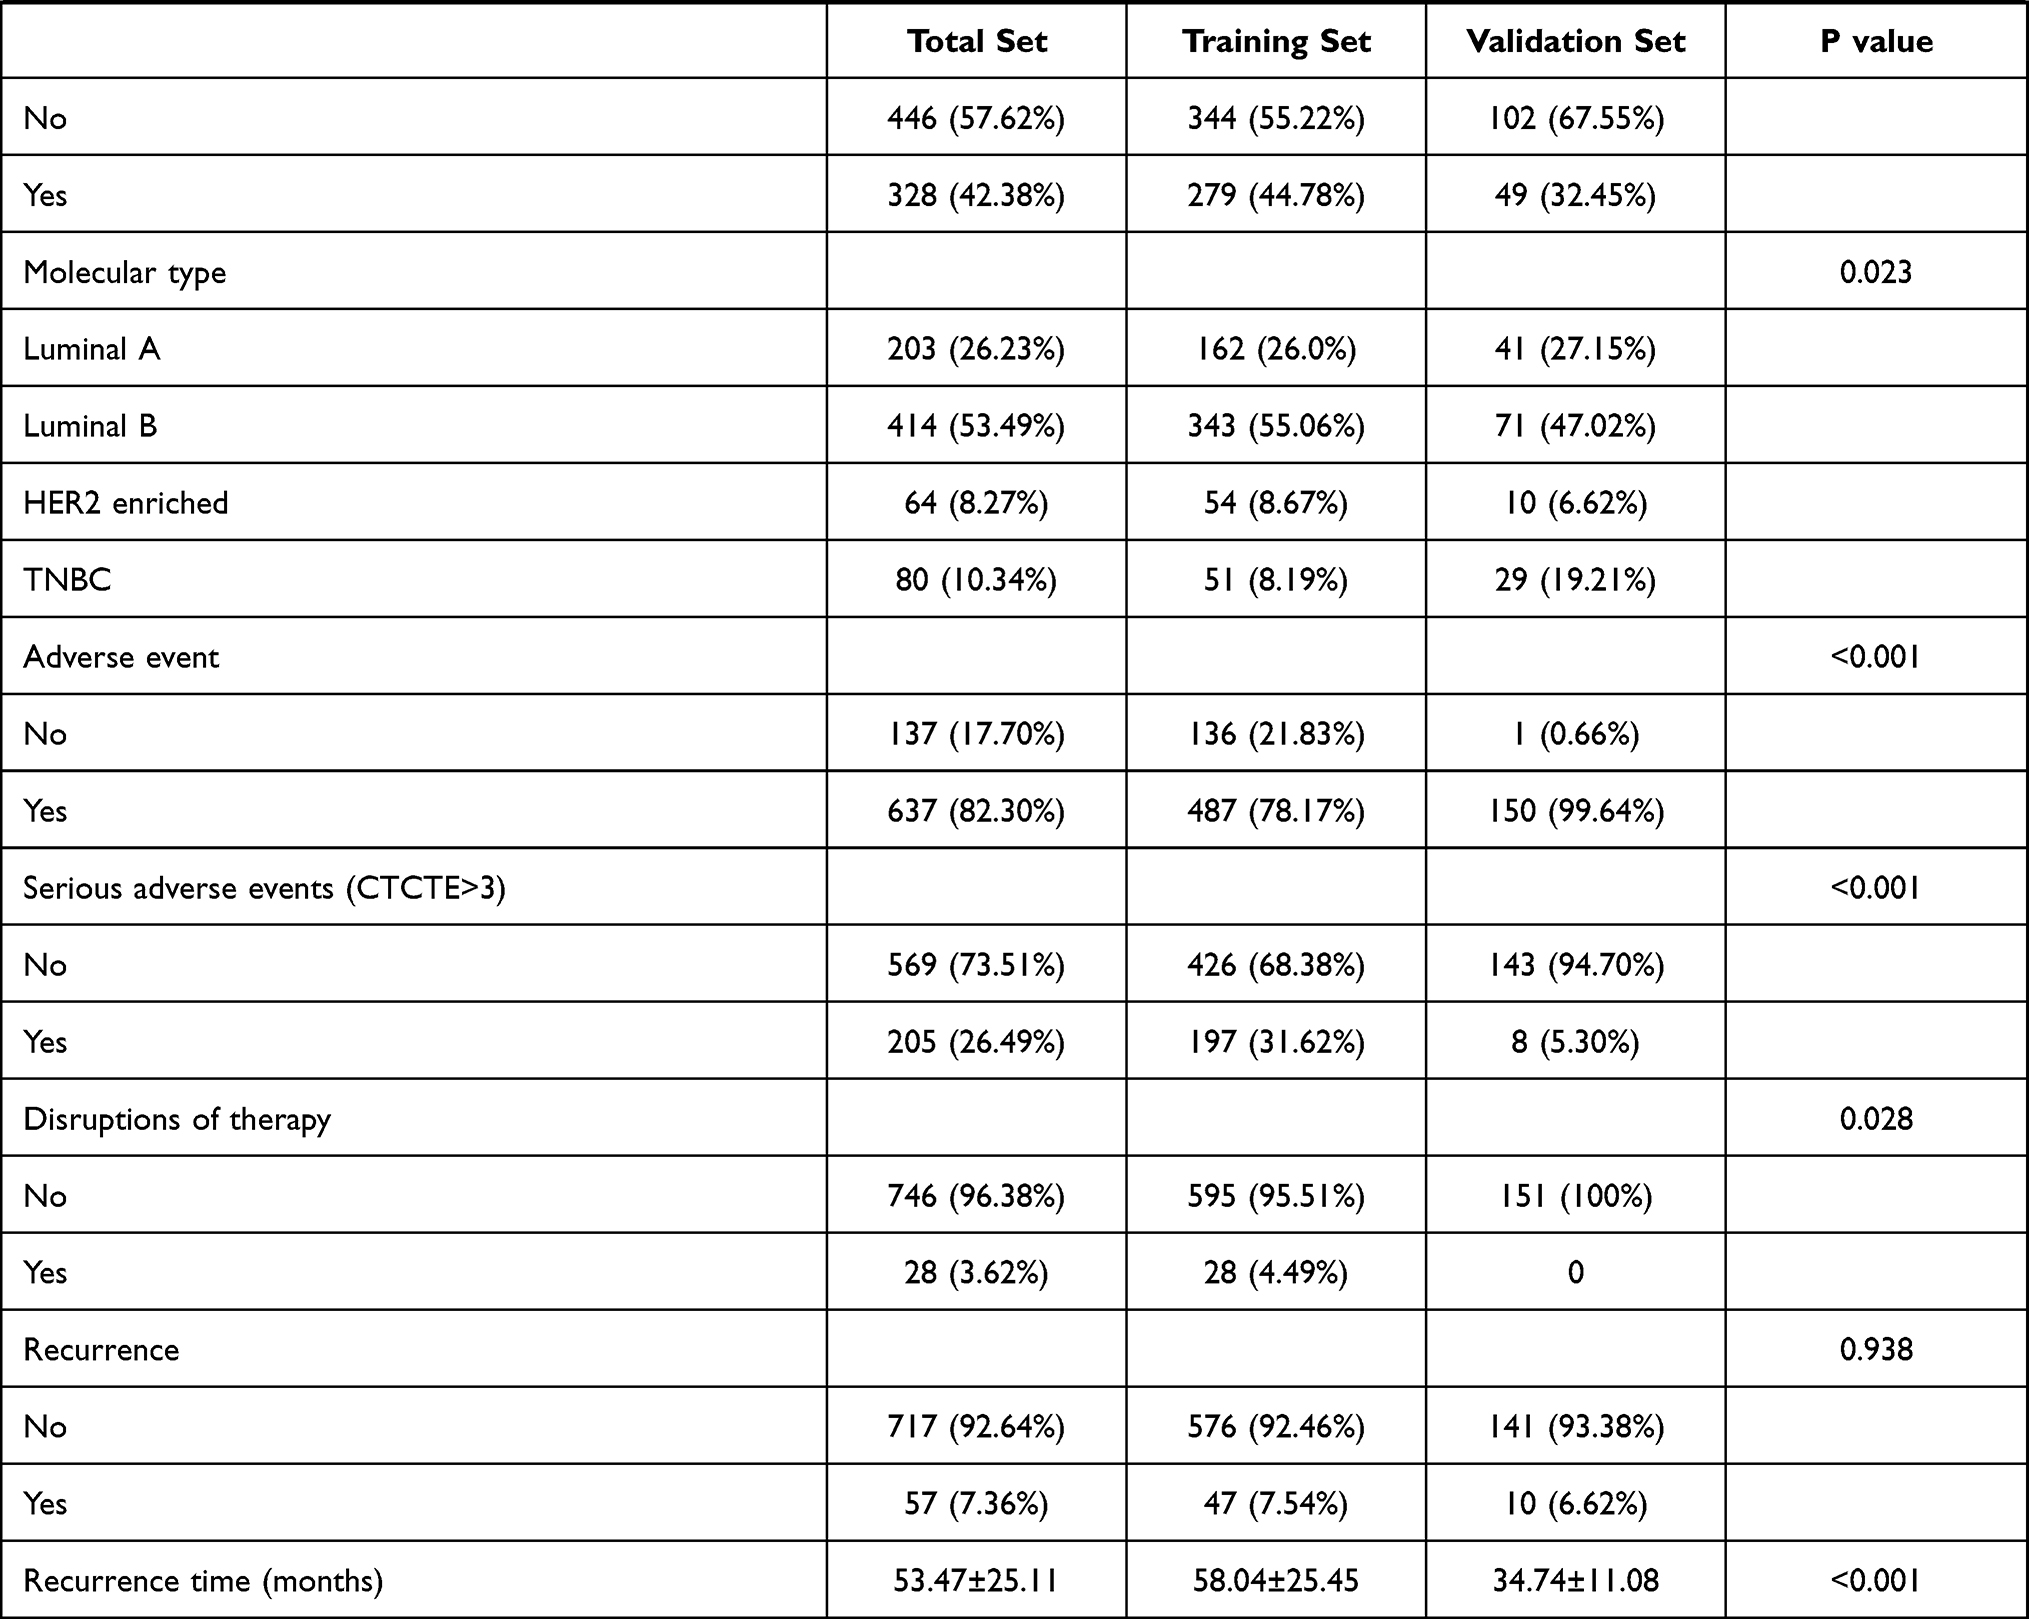 |
Table 1 Basic Information of the Training and Validation Sets |
The RF-RFE program of the R caret package was used to filter the most highly predictive variables of the set, and we selected the optimal number of variables according to the root mean square error (RMSE). To evaluate the accuracy of a model, the RMSE of test and predicted values is determined. The lower the RMSE value, the higher the predictive accuracy of the model. Figure 2 shows that when the model included 14 variables, the RMSE value was lowest.
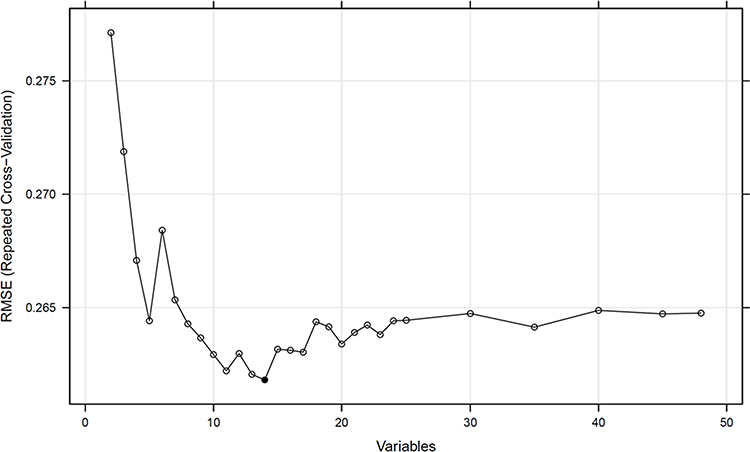 |
Figure 2 Evaluating the number of variables contained in the optimal set using the root mean square error. |
The best variable set (14 variables) filtered by RF-RFE included the pathological (TNM) stage, gamma-glutamyl transpeptidase (GGT), total cholesterol (CHOL), Ki-67, lymphocyte count, low-density lipoprotein (LDL), age, apolipoprotein B (ApoB), high-density lipoprotein (HDL), serum globulin (GLB), neutrophil count to lymphocyte count ratio (NLR), alanine aminotransferase (ALT), triglyceride (TRIG), and serum albumin to serum GLB (A/G) ratio data. Variable importance (VIMP) indicated by RF-RFE is shown in Figure 3. The positive VIMP value indicates that one variable improves predictive accuracy, while the negative value indicates an adverse effect in the prediction.21 VIMP indicated the contribution of each variable to model prediction separately, but it did not consider the contribution of combinations of variables.22,23 VIMPs of A/G were negative, but when they were included in the variable set, the RMSE value was reduced to the lowest level measured, indicating that the variable set that included A/G had the best predictive performance. Moreover, the previous studies reported that the increased A/G ratio often predicts a good prognosis,6,24–26 which was reversed to recurrence. Therefore, A/G ratios were included in the variable set.
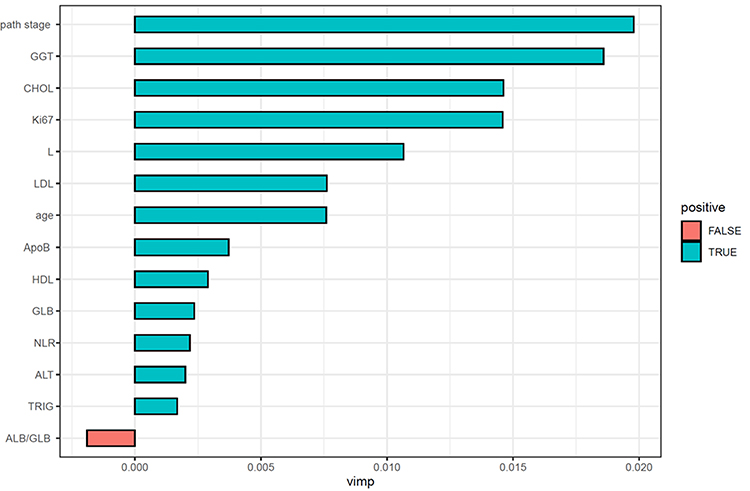 |
Figure 3 Variable importance values derived from the random forest-recursive feature elimination analysis. |
RSF using the R software RandomForestSRC package was used to construct the model. As shown in Figure 4, the error rate of the model gradually stabilized as the numbers of fixed trees increased. Between 4000 and 6000, the out-of-bag error rate steadily decreased and tended to be approximately 0.3. The error rate was stable when the number of fixed trees was 10,000. Therefore, the selection of 10,000 trees (ntree = 10,000) was appropriate, and the best performing parameters (ntree = 10,000; mtry = 4) were selected to develop the RSF prognostic model. Subsequently, RSF-based scores for individual samples were calculated. The C-index was 0.997 (95% confidence interval [CI], 0.995–0.998) (strong discriminatory power).27 ROC curve analysis was used to evaluate the performance of the developed RSF prognostic model in the training set. Based on RSF scores, the area under the ROC curve (AUROC) was 0.994 (95% CI, 0.9848–1.0), with a sensitivity of 97.9%, specificity of 98.4%, and an optimal cut-off value of 2.81 in the training set (Figure 5).
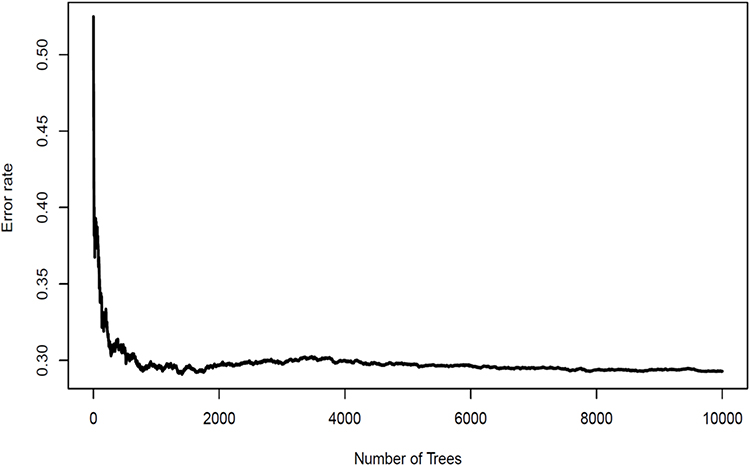 |
Figure 4 Change in the prediction error rate of the recurrence risk model of breast cancer patients with tree number. |
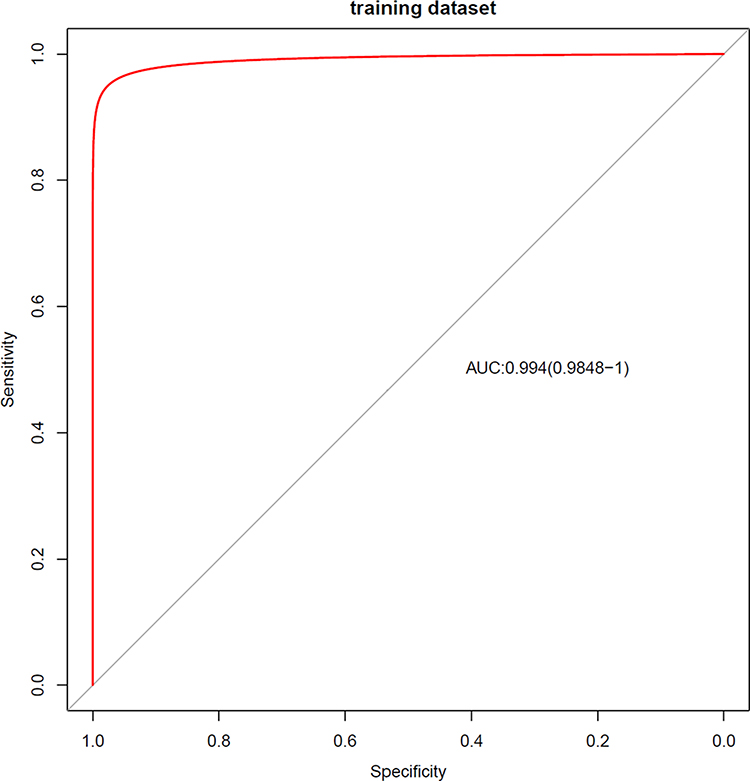 |
Figure 5 Receiver operating characteristic curve of the developed random survival forest model. |
We divided samples into high-and low-risk groups, which included above- and below RSF-based scores of 2.81, respectively. KM analyses revealed highly significant differences between overall survival times of the high-risk and low-risk groups (P < 0.0001) (Figure 6). Results showed that the developed RSF prognostic model was able to predict BC recurrence accurately.
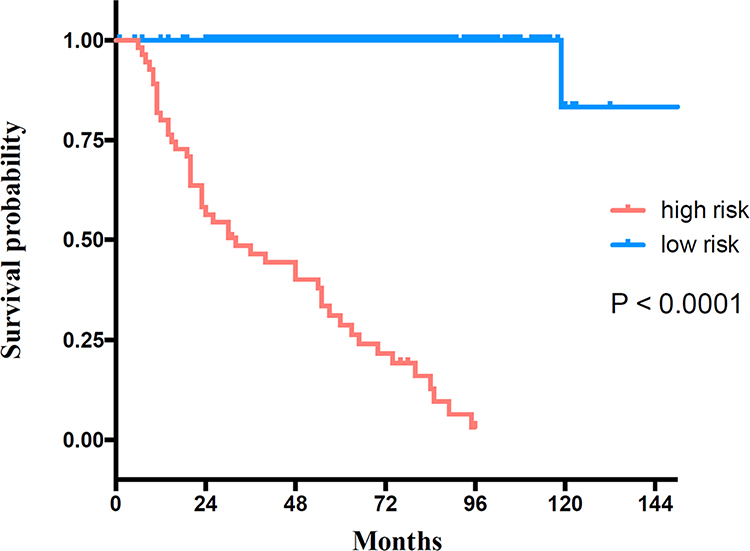 |
Figure 6 Kaplan-Meier survival curves of recurrence-free survival for the training set. |
The developed RSF prognostic model was applied in the assessment of an independent validation set, and the predictive performance of the model was evaluated using data of the Liuzhou Women and Children’s Medical Center cohort. The C-index was determined to be 0.936 (95% CI, 0.891–0.981) (strong discriminatory power).27
ROC curve analysis was used to evaluate the performance of the developed RSF prognostic model in the validation set. Based on the RSF-based scores, the AUROC was 0.961 (95% CI, 0.926–0.996), with a sensitivity of 100% and specificity of 87.9% (Figure 7).
 |
Figure 7 Receiver operating characteristic curve of the developed random survival forest model assessment by the validation set. |
The optimal cut-off value of 2.81 in the RSF-based score in the training set was used to stratify patients into high-risk and low-risk groups in the validation set. KM analyses revealed highly significant differences in recurrence-free survival between high-risk and low-risk groups (P < 0.0001) (Figure 8).
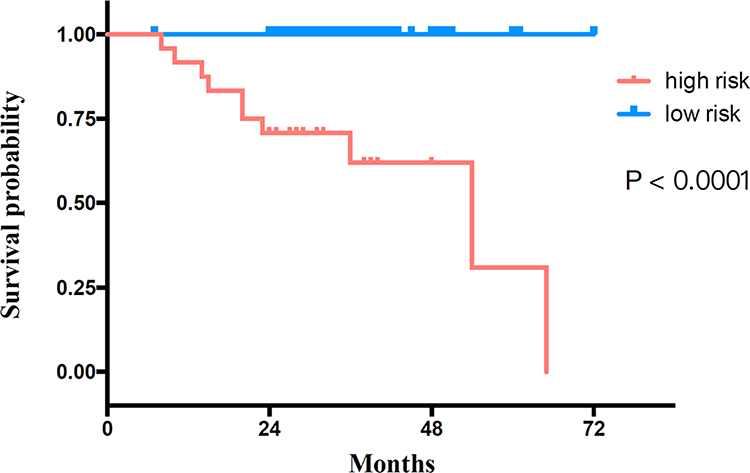 |
Figure 8 Kaplan-Meier survival curves of recurrence-free survival for the validation set. |
Discussion
This study employed an RF-RFE algorithm28 to automatically select the most relevant features among 40 variables identified for further RSF model development. Variable selection is the process of selecting a data set that includes relevant features for further analysis to minimize possible generalization error.
The 14 selected variables for the model developed included pathological (TNM) stage, GGT, CHOL, Ki-67, lymphocyte count, LDL, age, ApoB, HDL, GLB, NLR, ALT, TRIG, and A/G. These were reported to be closely associated with BC recurrence risk in previous studies, and they were used in this study to develop a reliable model.
The Characteristic of the Selected Variables
The most important variable selected was pathological stage (TNM stage). Pathological stage has been widely used in clinical practice to predict prognosis and survival as well as guide clinical treatment.29 Proliferating cell nuclear antigen (Ki-67) is a protein closely related to cell proliferation. Current studies have shown that Ki-67 is highly correlated with the differentiation, invasion, and metastasis of BC,30 which can be used to predict the prognosis of BC patients. Some studies have confirmed that Ki-67-positive BC patients have a poor treatment response and prognosis.29,31
Lymphocyte count, NLR, and platelet count to lymphocyte count ratio (PLR) are variables assessed in routine blood tests. In previous studies, it was found that a change in the white blood cell (WBC) count in peripheral blood is related to the systemic inflammatory response.5 Moreover, some studies have found that tumor-related systemic inflammatory response is an independent predictor of tumor prognosis in patients.32,33 NLR and PLR can reliably reflect the body’s inflammatory status. In fact, studies confirmed the classification of WBC count in peripheral blood, and NLR and PLR can be used to predict the prognosis of BC.5,34–36 Increases in NLR and PLR often indicate poor response to treatment and poor prognosis, whereas low NLR and PLR are often indicative of good treatment response and good prognosis.37–39
Age is an independent risk factor for BC. The incidence and mortality rate of BC increases with age. Many factors related to age play an important role in the occurrence and development of BC, such as changes in hormone levels before and after menopause, cumulative DNA damage with aging, the occurrence of various types of chronic infections, and changes in the immune system.40–42 At the same time, some studies have shown that the prognosis of young BC patients is often poor, which may be due to the higher pathological grade of young patients’ tumors, as these patients are also often cancer cell hormone receptor-negative and HER-2-positive and may have other adverse indications.8,43
The liver function test is routinely performed to assess ALT, AST, total bilirubin, ALP, GGT, ALB, GLB, and A/G. Some researchers have used ALT and GGT to predict all-cause mortality in the general population and found that predictions using the factors were moderately accurate.44 Previous studies have shown that high levels of GLB are associated with a poor prognosis in patients with breast and rectal cancers.6,45,46 On the other hand, in various tumors including BC, non-small cell lung cancer, renal cell cancer, and laryngeal cancer, increased ALB levels and ALB/GLB ratios (A/Gs) are often predictive of a good prognosis.6,24–26 Therefore, these liver function parameters can be used as predictors of BC prognosis.
BC patients with baseline hypertriglyceridemia may have poor prognosis.47 Moreover, CHOL is associated with BC recurrence,48 whereas a high HDL/CHOL ratio is associated with a good prognosis.47
Novelty of the Proposed Model
However, breast cancer is a multi-factorial disease, and individualized patient profiling is instrumental to improving BC management and individual outcomes.12–14 It is widely accepted that the prognosis of cancer patients depends on not only tumor characteristics but also patient characteristics.49 Thus, we determined that it would be best to develop a predictive model using both tumor characteristics and patient characteristics. In terms of validity and reliability, we found that our predictive model performed well even upon external validation using an independent data set. C-indexes were 0.997 and 0.936 for the training and external validation sets, respectively, and discriminatory power was good. The KM analyses (P < 0.0001 for both training and validation sets) were used to evaluate the performance of the model, and we found that our model could accurately predict BC recurrence. Further, AUROCs were 0.994 and 0.961 for training and validation sets, respectively, indicating that our model was able to reliably predict BC recurrence. Moreover, the AUROC of the previously reported predictive model ranged from 0.69 to 0.92, suggesting that our model was more accurate than the models previously described.50–53
Compared with published predictive models created based on new molecular biomarkers derived from gene or protein expression analysis, our existing models rely on simple and easy-to-obtain demographic data and clinical routine examination indicators obtainable in clinical practice. This means that a high-accuracy prediction may be made without increasing cost to patients. From the perspective of economic cost, using conventional laboratory indicators has lower cost than using new molecular biomarkers, particularly since new molecular biomarkers measurements are not routinely conducted in clinical practice. Further, this additional expense is not covered by insurance. The model constructed in this study included comprehensive selected features for both tumor and patient-related features and can be performed without additional cost to patients and is easy to operate. The model has the potential to help clinicians identify and provide interventions for high-risk patients in the early stage of disease and allow physicians to perform more accurate, targeted, efficient, and individualized treatment plans to improve the prognosis of BC patients.
Our study has some limitations. First, all study participants were of Han descent. Thus, the model has limited applicability to other races until external validation using data of patients from other regions and ethnicities is performed. Second, this is a cross-sectional study, which created a prediction model based on the baseline level, suggesting that timing and causality could not be determined. Thus, studies conducted at multiple centers that include larger cohorts are required.
Conclusions
We developed and validated a model to predict BC recurrence in patients in China. Predictive variables were selected based on data commonly obtained in clinical practice, which would not incur an additional cost to patients. The RSF model exhibited high discriminatory accuracy and good calibration, which may facilitate recurrence prediction. Moreover, by using the model, clinicians can deliver precise and efficient individualized treatment for BC patients to improve their prognosis. This new multiparametric RSF model is instrumental for breast cancer recurrence prediction and potentially improves individual outcomes.
Abbreviations
BC, breast cancer; TNBC, triple negative breast cancer; ER, estrogen receptor; PR, progesterone receptor; RSF, random survival forest; HER2, human epidermal growth factor receptor 2; AEs, Adverse Events; ADLs, activities of daily livings; PMM, predictive mean matching; RF-RFE, random forest-recursive feature elimination; ROC, receiver operating characteristic; KM, Kaplan-Meier; RMSE, root mean square error; GGT, gamma-glutamyl transpeptidase; CHOL, total cholesterol; LYMPH, lymphocyte; BMI, body mass index; HDL, high-density lipoprotein; LDL, low-density lipoprotein; ALP, alkaline phosphatase; Hb, hemoglobin; PLT, platelet; PLR, platelet count to lymphocyte count ratio; ApoA, apolipoprotein A; ApoB, apolipoprotein B; TRIG, triglyceride; ALT, alanine aminotransferase; AST, aspartate aminotransferase; GLB, globulin; NEUT, neutrophil; NLR, neutrophil count to lymphocyte count ratio; ALB, albumin; A/G, albumin to globulin ratio; HCT, hematocrit; VIMP, variable importance; CI, confidence interval; C-index, concordance index; AUROC, the area under the ROC curve; WBC, white blood cell; RBC, red blood cell, TBIL, total bilirubin, DBIL, direct bilirubin; PT, prothrombin time; INR, international normalized ratio; Cr, creatinine; GLU, glucose; UA, uric acid; Lpa, lipoprotein a.
Funding
This research was supported by grants from the National Natural Science Foundation (grant number 81372815), Guangdong Basic and Applied Basic Research Foundation (grant number 2021A1515110818), the youth education Grand of Sun Yat-sen University (grant number N2019Y08), and the Guangdong Nature Science Foundation (grant number 2016A030313250).
Disclosure
The authors report no conflicts of interest in this work.
References
1. Bray F, Ferlay J, Soerjomataram I, Siegel RL, Torre LA, Jemal A. Global cancer statistics 2018: GLOBOCAN estimates of incidence and mortality worldwide for 36 cancers in 185 countries. CA Cancer J Clin. 2018;68(6):394–424. doi:10.3322/caac.21492
2. Sung H, Rosenberg PS, Chen WQ, et al. Female breast cancer incidence among Asian and Western populations: more similar than expected. J Natl Cancer Inst. 2015;107(7):7. doi:10.1093/jnci/djv107
3. Cao W, Wang X, Li JC. Hereditary breast cancer in the Han Chinese population. J Epidemiol. 2013;23(2):75–84. doi:10.2188/jea.JE20120043
4. Nicolini A, Ferrari P, Duffy MJ. Prognostic and predictive biomarkers in breast cancer: past, present and future. Semin Cancer Biol. 2018;52(Pt 1):56–73. doi:10.1016/j.semcancer.2017.08.010
5. Guthrie GJ, Charles KA, Roxburgh CS, Horgan PG, McMillan DC, Clarke SJ. The systemic inflammation-based neutrophil-lymphocyte ratio: experience in patients with cancer. Crit Rev Oncol Hematol. 2013;88(1):218–230. doi:10.1016/j.critrevonc.2013.03.010
6. Azab BN, Bhatt VR, Vonfrolio S, et al. Value of the pretreatment albumin to globulin ratio in predicting long-term mortality in breast cancer patients. Am J Surg. 2013;206(5):764–770. doi:10.1016/j.amjsurg.2013.03.007
7. Zimta AA, Tigu AB, Muntean M, Cenariu D, Slaby O, Berindan-Neagoe I. Molecular links between central obesity and breast cancer. Int J Mol Sci. 2019;20(21):5364. doi:10.3390/ijms20215364
8. El Saghir NS, Seoud M, Khalil MK, et al. Effects of young age at presentation on survival in breast cancer. BMC Cancer. 2006;6(1):194. doi:10.1186/1471-2407-6-194
9. Peethambaram PP, Hoskin TL, Day CN, Goetz MP, Habermann EB, Boughey JC. Use of 21-gene recurrence score assay to individualize adjuvant chemotherapy recommendations in ER+/HER2- node positive breast cancer-A National Cancer Database study. NPJ Breast Cancer. 2017;3(1):41. doi:10.1038/s41523-017-0044-4
10. Gal J, Bailleux C, Chardin D, Pourcher T, Chamorey E. Comparison of unsupervised machine-learning methods to identify metabolomic signatures in patients with localized breast cancer. Comput Struct Biotechnol J. 2020;18:1509–1524. doi:10.1016/j.csbj.2020.05.021
11. Dlamini Z, Francies FZ, Hull R, Marima R. Artificial intelligence (AI) and big data in cancer and precision oncology. Comput Struct Biotechnol J. 2020;18:2300–2311. doi:10.1016/j.csbj.2020.08.019
12. Fröhlich H, Patjoshi S, Yeghiazaryan K, Kehrer C, Kuhn W, Golubnitschaja O. Premenopausal breast cancer: potential clinical utility of a multi-omics based machine learning approach for patient stratification. EPMA J. 2018;9(2):175–186. doi:10.1007/s13167-018-0131-0
13. Golubnitschaja O, Liskova A, Koklesova L, et al. Caution, “normal” BMI: health risks associated with potentially masked individual underweight-EPMA Position Paper 2021. EPMA J. 2021;12(3):1–22. doi:10.1007/s13167-021-00251-4
14. Qian S, Golubnitschaja O, Zhan X. Chronic inflammation: key player and biomarker-set to predict and prevent cancer development and progression based on individualized patient profiles. EPMA J. 2019;10(4):365–381. doi:10.1007/s13167-019-00194-x
15. Brock GN, Shaffer JR, Blakesley RE, Lotz MJ, Tseng GC. Which missing value imputation method to use in expression profiles: a comparative study and two selection schemes. BMC Bioinform. 2008;9(1):12. doi:10.1186/1471-2105-9-12
16. Ishwaran H, Kogalur UB. RandomSurvivalForest: random survival forests; 2013.
17. Breiman L. Bagging predictors. Mach Learn. 2001;45(1):5–32. doi:10.1023/A:1010933404324
18. Moorthy K, Mohamad MS. Random forest for gene selection and microarray data classification. Bioinformation. 2011;7(3):142–146. doi:10.6026/97320630007142
19. Ram M, Najafi A, Shakeri MT. Classification and biomarker genes selection for cancer gene expression data using random forest. Iran J Pathol. 2017;12(4):339–347. doi:10.30699/ijp.2017.27990
20. Ishwaran H, Kogalur UB. Consistency of random survival forests. Stat Probab Lett. 2010;79(13–14):1056–1064. doi:10.1016/j.spl.2010.02.020
21. Ehrlinger J, ggRandomForests: exploring random forest survival. 2016.
22. Strobl C, Boulesteix AL, Kneib T, Augustin T, Zeileis A. Conditional variable importance for random forests. BMC Bioinform. 2008;9(1):307. doi:10.1186/1471-2105-9-307
23. Ishwaran H. Variable importance in binary regression trees and forests. Electron J Stat. 2007;1. doi:10.1214/07-EJS039
24. Zhen C, Shao Y, Yao H, Zhuang Q, Xu R. Preoperative albumin to globulin ratio predicts survival in clear cell renal cell carcinoma patients. Oncotarget. 2017;8(29):48291.
25. Jiang H, Li H, Li A, et al. Preoperative combined hemoglobin, albumin, lymphocyte and platelet levels predict survival in patients with locally advanced colorectal cancer. Oncotarget. 2016;7(44):72076–72083. doi:10.18632/oncotarget.12271
26. Chen WZ, Yu ST, Xie R, Lv YX, Xu DB. Preoperative albumin/globulin ratio has predictive value for patients with laryngeal squamous cell carcinoma. Oncotarget. 2017;8(29):48240–48247. doi:10.18632/oncotarget.18443
27. Steyerberg EW. Clinical Prediction Models: A Practical Approach to Development, Validation, and Updating by Ewout W. Steyerberg[M]. New York: Springer, 2009, ISBN 978-0-387-77243-1, xxviii + 497 pp.
28. Granitto PM, Furlanello C, Biasioli F, Gasperi F. Recursive feature elimination with random forest for PTR-MS analysis of agroindustrial products. Chemometr Intell Lab Syst. 2006;83(2):83–90. doi:10.1016/j.chemolab.2006.01.007
29. Stuart-Harris R, Caldas C, Pinder SE, Pharoah P. Proliferation markers and survival in early breast cancer: a systematic review and meta-analysis of 85 studies in 32,825 patients. Breast. 2008;17(4):323–334. doi:10.1016/j.breast.2008.02.002
30. Trihia H, Murray S, Price K, et al. Ki-67 expression in breast carcinoma: its association with grading systems, clinical parameters, and other prognostic factors–a surrogate marker? Cancer. 2003;97(5):1321–1331. doi:10.1002/cncr.11188
31. Denkert C, Loibl S, Müller BM, et al. Ki67 levels as predictive and prognostic parameters in pretherapeutic breast cancer core biopsies: a translational investigation in the neoadjuvant GeparTrio trial. Ann Oncol. 2013;24(11):2786–2793. doi:10.1093/annonc/mdt350
32. Elinav E, Nowarski R, Thaiss CA, Hu B, Jin C, Flavell RA. Inflammation-induced cancer: crosstalk between tumours, immune cells and microorganisms. Nat Rev Cancer. 2013;13(11):759–771. doi:10.1038/nrc3611
33. Dolan RD, McSorley ST, Horgan PG, Laird B, McMillan DC. The role of the systemic inflammatory response in predicting outcomes in patients with advanced inoperable cancer: systematic review and meta-analysis. Crit Rev Oncol Hematol. 2017;116:134–146. doi:10.1016/j.critrevonc.2017.06.002
34. Azab B, Shah N, Radbel J, et al. Pretreatment neutrophil/lymphocyte ratio is superior to platelet/lymphocyte ratio as a predictor of long-term mortality in breast cancer patients. Med Oncol. 2013;30(1):432. doi:10.1007/s12032-012-0432-4
35. Kilincalp S, Çoban Ş, Akinci H, et al. Neutrophil/lymphocyte ratio, platelet/lymphocyte ratio, and mean platelet volume as potential biomarkers for early detection and monitoring of colorectal adenocarcinoma. Eur J Cancer Prev. 2015;24(4):328–333. doi:10.1097/CEJ.0000000000000092
36. Huang SH, Waldron JN, Milosevic M, et al. Prognostic value of pretreatment circulating neutrophils, monocytes, and lymphocytes in oropharyngeal cancer stratified by human papillomavirus status. Cancer. 2015;121(4):545–555. doi:10.1002/cncr.29100
37. Chen Y, Chen K, Xiao X, et al. Pretreatment neutrophil-to-lymphocyte ratio is correlated with response to neoadjuvant chemotherapy as an independent prognostic indicator in breast cancer patients: a retrospective study. Bmc Cancer. 2016;16(1):320. doi:10.1186/s12885-016-2352-8
38. Mimica X, Acevedo F, Oddo D, et al. Neutrophil/lymphocyte ratio in complete blood count as a mortality predictor in breast cancer. Rev Med Chil. 2016;144(6):691. doi:10.4067/S0034-98872016000600001
39. Cuello-López J, Fidalgo-Zapata A, López-Agudelo L, Vásquez-Trespalacios E. Platelet-to-lymphocyte ratio as a predictive factor of complete pathologic response to neoadjuvant chemotherapy in breast cancer. PLoS One. 2018;13(11):e0207224. doi:10.1371/journal.pone.0207224
40. De L, Campana F, Fenton J. Age as prognostic factor in premenopausal breast carcinoma. Lancet. 1993;341(8852):1039–1043. doi:10.1016/0140-6736(93)92407-K
41. Tarone RE, Chu KC. Evaluation of birth cohort patterns in population disease rates. Am J Epidemiol. 1996;143(1):85–91. doi:10.1093/oxfordjournals.aje.a008661
42. Howlader N, Noone AM, Krapcho M, et al. SEER cancer statistics review, 1975–2012. National Cancer Institute; 2013.
43. Radecka B, Litwiniuk M. Breast cancer in young women. Ginekol Pol. 2016;87(9):659–663. doi:10.5603/GP.2016.0062
44. Liu Z, Ning H, Que S, et al. Complex association between alanine aminotransferase activity and mortality in general population: a systematic review and meta-analysis of prospective studies. PLoS One. 2014;9(3):e91410. doi:10.1371/journal.pone.0091410
45. Wen J, Ye F, Li S, et al. The practicability of a novel Prognostic Index (PI) model and comparison with Nottingham Prognostic Index (NPI) in stage I–III breast cancer patients undergoing surgical treatment. PLoS One. 2015;10(11):e0143537. doi:10.1371/journal.pone.0143537
46. Li Q, Meng X, Liang L, Xu Y, Cai G, Cai S. High preoperative serum globulin in rectal cancer treated with neoadjunctive chemoradiation therapy is a risk factor for poor outcome. Am J Cancer Res. 2015;5(9):2856.
47. Trygve L, Mortensen ES, Hawa N, et al. Impact of pre-diagnostic triglycerides and HDL-cholesterol on breast cancer recurrence and survival by breast cancer subtypes. BMC Cancer. 2018;18(1):654. doi:10.1186/s12885-018-4568-2
48. Bahl M, Ennis M, Tannock IF, et al. Serum lipids and outcome of early-stage breast cancer: results of a prospective cohort study. Breast Cancer Res Treat. 2005;94(2):135–144. doi:10.1007/s10549-005-6654-9
49. Jia W, Wu J, Jia H, et al. The peripheral blood neutrophil-to-lymphocyte ratio is superior to the lymphocyte-to-monocyte ratio for predicting the long-term survival of triple-negative breast cancer patients. PLoS One. 2015;10(11):e0143061. doi:10.1371/journal.pone.0143061
50. Zhong X, Luo T, Deng L, et al. Multidimensional machine learning personalized prognostic model in an early invasive breast cancer population-based cohort in china: algorithm validation study. JMIR Med Inform. 2020;8(11):e19069. doi:10.2196/19069
51. Kim W, Kim KS, Park RW. Nomogram of naive bayesian model for recurrence prediction of breast cancer. Healthc Inform Res. 2016;22(2):89–94. doi:10.4258/hir.2016.22.2.89
52. Kim W, Kim KS, Lee JE, et al. Development of novel breast cancer recurrence prediction model using support vector machine. J Breast Cancer. 2012;15(2):230–238. doi:10.4048/jbc.2012.15.2.230
53. Park KU, Chen Y, Chitale D, et al. Utilization of the 21-gene recurrence score in a diverse breast cancer patient population: development of a clinicopathologic model to predict high-risk scores and response to neoadjuvant chemotherapy. Ann Surg Oncol. 2018;25(7):1921–1927. doi:10.1245/s10434-018-6440-7
 © 2022 The Author(s). This work is published and licensed by Dove Medical Press Limited. The
full terms of this license are available at https://www.dovepress.com/terms
and incorporate the Creative Commons Attribution
- Non Commercial (unported, 3.0) License.
By accessing the work you hereby accept the Terms. Non-commercial uses of the work are permitted
without any further permission from Dove Medical Press Limited, provided the work is properly
attributed. For permission for commercial use of this work, please see paragraphs 4.2 and 5 of our Terms.
© 2022 The Author(s). This work is published and licensed by Dove Medical Press Limited. The
full terms of this license are available at https://www.dovepress.com/terms
and incorporate the Creative Commons Attribution
- Non Commercial (unported, 3.0) License.
By accessing the work you hereby accept the Terms. Non-commercial uses of the work are permitted
without any further permission from Dove Medical Press Limited, provided the work is properly
attributed. For permission for commercial use of this work, please see paragraphs 4.2 and 5 of our Terms.