Back to Journals » Patient Preference and Adherence » Volume 15
Development and Psychometric Validation of the Hypertension Beliefs Assessment Tool Among Adult Population in Northwest Ethiopia
Authors Teshome DF, Balcha SA ![]() , Ayele TA, Atnafu A
, Ayele TA, Atnafu A ![]() , Gelaye KA
, Gelaye KA ![]()
Received 23 August 2021
Accepted for publication 9 November 2021
Published 25 November 2021 Volume 2021:15 Pages 2659—2671
DOI https://doi.org/10.2147/PPA.S335070
Checked for plagiarism Yes
Review by Single anonymous peer review
Peer reviewer comments 4
Editor who approved publication: Dr Johnny Chen
Destaw Fetene Teshome,1 Shitaye Alemu Balcha,2 Tadesse Awoke Ayele,1 Asmamaw Atnafu,3 Kassahun Alemu Gelaye1
1Department of Epidemiology and Biostatistics, Institute of Public Health, College of Medicine and Health Sciences, University of Gondar, Gondar, Ethiopia; 2Department of Internal Medicine, School of Medicine, College of Medicine and Health Sciences, University of Gondar, Gondar, Ethiopia; 3Department of Health Systems and Policy, Institute of Public Health, College of Medicine and Health Sciences, University of Gondar, Gondar, Ethiopia
Correspondence: Destaw Fetene Teshome Email [email protected]
Background: In Ethiopia, the majority of hypertension cases remain undiagnosed, untreated, and uncontrolled. Beliefs about hypertension and its complications play an important role in hypertension management behaviors. Accurate assessment of individuals’ beliefs towards the disease is of paramount importance in the design of hypertension education. This study aimed to develop and validate a hypertension belief assessment tool based on the Health Belief Model for the general population among rural adults in northwest Ethiopia.
Methods: The study included item construction, face and content validation, factor analysis, and establishment of reliability and validity of the tool. A total of 308 rural adults participated in the study. Inter-item and item-to-total correlations were used to examine the items assessed with the same content on a scale. Principal component analysis with promax rotation was used to extract the factors. Internal consistency reliability was assessed using Cronbach’s alpha coefficient. Convergent and discriminant validity were assessed using average variance extraction and maximum shared variance.
Results: The median age of the participants was 41 (IQR: 31– 55) years. Of the participants, 175 (56.8%) were female and 287 (93.2%) were farmers. Kaiser-Meyer-Olkin test value of 0.84 and significant Bartlett’s test of sphericity (p=0.000) revealed that the data were suitable for exploratory factor analysis. The principal component analysis identified 6 factors, which explained 70.06% of the variation of the hypertension belief. Cronbach’s alpha was 0.85 for the entire scale, ranging from 0.74 to 0.92 for the sub-domains. The average variance extracted was above 0.5 for all factors, indicating convergent validity. The maximum shared variance between the two constructs was lower than the average variance extracted from each factor, indicating that discriminating validity had been established.
Conclusion: The hypertension belief assessment tool was found to be valid and reliable, which can be used to measure the health beliefs on hypertension for the rural adult population.
Keywords: hypertension, belief, validation, exploratory factor analysis
Background
Hypertension, also known as high blood pressure,1 is one of the major global public health problems.2–7 An estimated 1.13 billion adult people worldwide had hypertension with most (two-thirds) living in low and middle-income countries.8 Hypertension affects nearly 1 in 4 Ethiopian adults and becomes a major public health problem.9 Literature showed that the pooled prevalence of hypertension was 21.8%10 and ranged from 13.2%11 in southwest Ethiopia to 31.9% in Dabat northwest Ethiopia.12
Hypertension, if left untreated and uncontrolled, might lead to cardiovascular disease morbidity, disability, and mortality.5 Estimated 10.7 million deaths13 and 162 million years of life lost14 were attributed to hypertension in 2017. In Ethiopia, it accounted for 62.3% of cardiovascular diseases,15 37% to 41.1% of coronary heart disease,16,17 and 36.3% to 69.3% of stroke cases.18–22
Lowering or controlling high blood pressure is associated with a decreased risk of cardiovascular disease morbidity, as well as overall mortality.23 For instance, if systolic blood pressure was managed to be lowered by 10 mmHg, the risk of dying of coronary heart disease and stroke would be decreased by 22–25% and 27–41%, respectively.24–26 Moreover, if blood pressure were optimally controlled, the incidence of heart failure and stroke would be reduced by 50% and 35–40%, respectively.27
Although medical and lifestyle interventions are effective in managing hypertension,28,29 a large proportion of patients with hypertension in Ethiopia remain undiagnosed, untreated, and uncontrolled.12,30–33 Studies conducted in different settings suggested that individuals’ beliefs about hypertension and its complications play an important role in hypertension management behaviors.34,35 Poor health beliefs, such as low perceived susceptibility and perceived severity of hypertension, could lead to less optimal blood pressure control indirectly through lower rates of hypertension screening and diagnosis,36 poor clinical linkage and treatment,37 less engagement in healthy lifestyle practices,38 and medication non-adherence.39
Individuals’ perceived benefit, barrier, and self-efficacy to take action also directly affect hypertension prevention and management.40 A study in Kenya showed poor beliefs in treatment effectiveness had been linked to poor adherence to care, treatment, and blood pressure control.41 However, patients who had a strong belief that their medicines are effective in protecting them from the effect of hypertension were found to be more adherent.42 Patients with hypertension who have had fewer perceived barriers to adherence43 and greater self-efficacy to take action were positively and significantly associated with better medication adherence43–45 and blood pressure reduction.46
Accurate assessment of individuals’ health beliefs about hypertension and its complication is an important first step to identifying individuals in need of hypertension education intervention. The Health Belief Model (HBM) is the most common health behavior theory used to explore one’s health belief.47 It was introduced in the 1950s by social psychologists to help understand the reasoning of individuals who participated in health programs, such as health check-ups and immunization.48 It has also been used by many researchers to determine health protective and promotive behaviors, such as cardiovascular disease,49 breast cancer,50–53 testicular cancer,54 osteoporosis,55 arthritis,56 diabetes,57,58 and patients with hypertension.5,59 However, there is no valid, reliable, and easy-to-use instrument to assess the health beliefs of the general population towards hypertension. Hence, this study aimed to develop and validate a hypertension belief assessment tool (HBAT) based on the HBM for the general population among rural adults in northwest Ethiopia.
Methods
Domain Identification
The hypothesized theoretical HBM with sub-domains of perceived susceptibility, perceived severity, perceived benefits of taking action, perceived barriers, and perceived self-efficacy to take action was used to develop the items.60 Perceived susceptibility is defined as a person’s subjective perception of the risk of acquiring a disease. Perceived severity is defined as person’s feelings on the seriousness of contracting a disease. The perceived benefit of taking action is defined as a person’s perception of the effectiveness of various actions available to reduce the threat of the disease. A perceived barrier to taking action is defined as a person’s feelings on the obstacles to performing a recommended health action. Self-efficacy is defined as the level of a person’s confidence in his or her ability to successfully perform a behavior.61
Item Construction
Existing scientific literatures regarding the health beliefs towards hypertension,62 Health Belief Model Scale for Breast Self-Examination,50,51 Health Belief Scale (HBS) for testicular cancer,54 Champion Health Belief Model Scale (CHBMS) for Breast Cancer Screening,63 Champion Health Belief Model Questionnaire,64 Health Belief Model Scale for diabetic patients57 shown to be reliable and valid were reviewed to develop the initial items. Moreover, experts in the subject area were consulted on the various dimensions of health beliefs to generate the initial items. First, a total of 25 items were generated in the form of positive sentences to measure an individual’s health beliefs. The construct addresses 5 domains under the tenets of the HBM, including perceived susceptibility to hypertension, perceived severity of hypertension, perceived benefits of taking action, perceived barriers to taking action, and self-efficacy to prevent hypertension. Each item of the scale/tool was assessed using a 5-point Likert scale ranging from 1 (strongly disagree) to 5 (strongly agree).
Face and Content Validation
First, seven Ethiopian experts from different disciplines (1 internal medicine specialist, 1 Ph.D. in nutrition, 1 public health expert, 3 Epidemiologist, and 1 MSc in Medical Nursing) who are content experts, and each has more than 10 years of work experience in the field evaluated the initial items for face validity. Experts commented on the items for clarity, conciseness, and alternative wordings. Then, a panel of experts evaluated the items, and items were revised as per the experts’ suggestion. Accordingly, 3 items that do not work for the general adult population (If I had hypertension, I cannot support my family; having hypertension causes additional time; and, taking anti-hypertensive medication causes sexual dysfunction) were removed from the item list. One item was also added (Early detection of hypertension makes prevention of complications easier) from the item list making a total of 23 items.
Secondly, a total of 9 content experts were invited from different departments to evaluate the tool for content validity. The initial items pool was provided for the experts to rate each item of the health belief for relevance as “very relevant”, “relevant”, “somewhat relevant”, and “not relevant”. The content validity index for the individual items and the overall scale and Kappa coefficient of agreement were used to determine the relevance of the items. The content validity index for the individual items ≥0.78 and the content validity index for the overall scale ≥0.90 have been taken as the minimum acceptable indices. Kappa values >0.81 are considered excellent, between 0.60 and 0.80 good and 0.40 to 0.59 fair.
Description of the HBAT
The developed and validated tool to assess the health beliefs of the adult population towards hypertensive disease in this study is called the Hypertension Beliefs Assessment Tool (Appendix A). The tool was developed in the English version and translated forward to Amharic. The first translator was an Epidemiologist who knew the content area of the constructs of the tool. The second translator was an English language expert who did not have any knowledge about medical terminology and the construct of the tool. Two translated versions of the tool were generated (FT1 and FT2).
A panel of discussion was held with the presence of 2 forward translators and the research team. The two translated Amharic versions were compared with the original version regarding format, wording, the grammatical structure of the sentences, similarity in meaning, and relevance. Ambiguities and discrepancies of words, sentences, and meanings were resolved. A preliminary initial Amharic version (FT12) was developed from these two translations.
The initial translation (FT12) was back-translated into English by the independent bilingual English language and clinical experts. Two back-translated versions of the research tool were produced (BT1 and BT2). An expert panel of all the bilingual translators and the research team was also held. The instruction, items, and response format of the two back-translations were compared with its original English version regarding the format, wording, grammatical structure of the sentences, similarity in meaning, and relevance. Any ambiguities and discrepancies in words, sentences, and meanings were discussed and resolved through consensus. Finally, a pre-final Amharic version of the tool was produced (Appendix B).
Pilot-Testing
The pre-final Amharic version of the research tool was administered to a convenient sample of the target population. A total of 20 rural adult populations were recruited aimed at evaluating the instructions, items, and response format of the pre-final Amharic version of their clarity and suggestions for rewording considered.
Psychometric Validation of HBAT
Study Settings and Population
A cross-sectional study design was used to collect data in rural districts (Dabat and Gondar Zuria) in northwest Ethiopia from May to June 2020. Adults aged ≥18 years who lived in the catchment area for at least 6 months were eligible to be part of the study. Pregnant women and individuals with cognitive dysfunction were excluded. However, we did not get any of the individuals with the aforementioned exclusion criteria during data collection.
Sample Size and Sampling Procedures
In this study, the sample size for the psychometric analysis was performed according to Hair and Anderson’s recommendation,65 with a subjects-to-item ratio of 12:1 and 10% non-response rate. Therefore, a total of 308 rural adults participated in the study to validate the construct. First, 10 kebeles from each district were selected using a simple random sampling technique. Then, 12–18 households were selected using a systematic random sampling method, and one participant per household was selected using lottery method from residents living in the selected kebeles.
Data Collection Procedures
A structured questionnaire including socio-demographic characteristics, medical histories, and beliefs towards hypertension was used to collect the data. Three data collectors trained for 2 days visited participants’ homes and collected the data using an interviewer-administered questionnaire. The data collectors read aloud the instructions and each of the questions/items for the study participants to respond. Blood pressures were measured from each participant twice, 30 minutes apart,66,67 using an aneroid sphygmomanometer and stethoscope. The questionnaire took 20 to 25 minutes to complete.
Statistical Analysis
All the data were entered using Epidata version 4.6 and analyzed using Statistical Package for Social Sciences (SPSS) version 25. Descriptive statistics such as mean with standard deviation, frequency, and percentages were used to describe variables.
Inter-Item and Item-Total Correlations
Inter-item correlations examine the extent to which a score on one item is related to scores on other items at a scale. An inter-items correlation of ≥0.30 in absolute value for each item was considered desirable to conduct factor analysis.68,69 Item-total (item to rest) correlations, defined as the correlation between the item score and the rest of the score, were also carried out to assess the extent to which an item was correlated to the overall scale. The Pearson correlation coefficient values of the corrected item-total correlation ≥0.20 were considered satisfactory70 and included in the scale, while an item-total correlation value of less than 0.20 indicated that the item did not correlate very well with the overall scale.71
Exploratory Factor Analysis
Exploratory factor analysis (EFA) is a statistical procedure used to reduce a large number of observed variables to a small number of factors and identify the underlying structures.72 In EFA, the correlations among a group of observed variables were identified and transformed into a small number of related factors. The requirements to conduct EFA such as multivariate normality,73 linearity, and sampling adequacy were checked.74
Preliminary analysis regarding inter-item correlation,68,69 Kaiser-Meyer-Olkin (KMO) measure of sampling adequacy,75,76 and Bartlett’s test of Sphercity77 were carried out to decide the factorability of the instrument. The KMO measure of sampling adequacy with the recommended value ≥.50 for the overall items was applied to measure sampling adequacy and appropriateness of the data for EFA.75,76 Bartlett’s test of sphericity was also used to assess the correlation or relationship among a set of items and multivariate normality of a set of distributions.77 A significant value of less than 0.05 indicates that the data do not produce an identity matrix and are acceptable for further analysis.78
Exploratory factor analysis with the Principal Component Analysis method was used to extract the data. The communalities of each item and the proportion of the item variance that was explained by the combination of items that had been extracted were set at a minimum value of 0.3 to retain an item. Factors with Eigenvalue ≥1 and a scree plot were used to determine the optimal number of underlying factors to be extracted. The factor loading criterion was set at ≥0.30 and considered appropriate to retain an item in each factor structure.79 Factors obtained during factor extraction were rotated using oblique varimax rotation procedure with Kaiser Normalization. Inter-factors correlation (IFC), the strength of correlation between factors, was checked by observing the component correlation matrix. The IFC > 0.30 in absolute value was considered to choose the oblique rotation method.
Reliability Assessment
In this study, Cronbach’s alpha coefficient was used to check the internal consistency reliability of the overall tool and the sub-domains. Cronbach’s alpha coefficient measures how closely related a set of items are as a group, with ≥0.70 was accepted as evidence of good internal consistency for the tool.80
Construct Validity of the Tool
Construct validity is the extent to which an instrument measures the construct that was intended to measure.81 Convergent and discriminant validity were used to explore the construct validity of the tool. Convergent validity is the assessment to measure the level of correlation of multiple indicators of the same construct that are in agreement. The average variance extracted (AVE), a measure of the amount of variance that is captured by a construct in relation to the amount of variance due to measurement error, was used to assess the convergent validity of the construct. An AVE of >0.50 was considered to confirm that the items were converged in the same factor.82,83 Discriminant validity (divergent validity), which tests constructs that should have no relationship, in fact, do not have any relationship, was assessed by comparing the AVE of one construct with the maximum shared variance (the squared of the IFC) of another construct. Thus, the levels of the AVE for each construct should be greater than the squared correlation involving the constructs.82
Ethical Consideration
This study has been approved by the Institutional Review Board of the University of Gondar (reference number R/T/T/C/Eng./327/02/2019). Permission letter was obtained from respective health departments. An information sheet including the purpose and importance of the study, confidentiality of the participants’ response, and study benefits and risks was prepared and explained to the study participants. Since the majority of the study participants were unable to read and write, the informed consent was read by the data collectors to them and put their fingerprint on the consent form of their agreement. Confidentiality of data was guaranteed by using identification numbers rather than names and limiting access to the data. Finally, the study was conducted per the declaration of Helsinki.
Results
Participant Characteristics
The median age of the participants was 41 (IQR=31–55) years, ranging from 19 to 90 years. Of the total participants, 175 (56.8%) were female and 254 (82.5%) were married. Of the total participants, 287 (93.2%) were farmers and 207 (67.2%) were unable to read and write (Table 1).
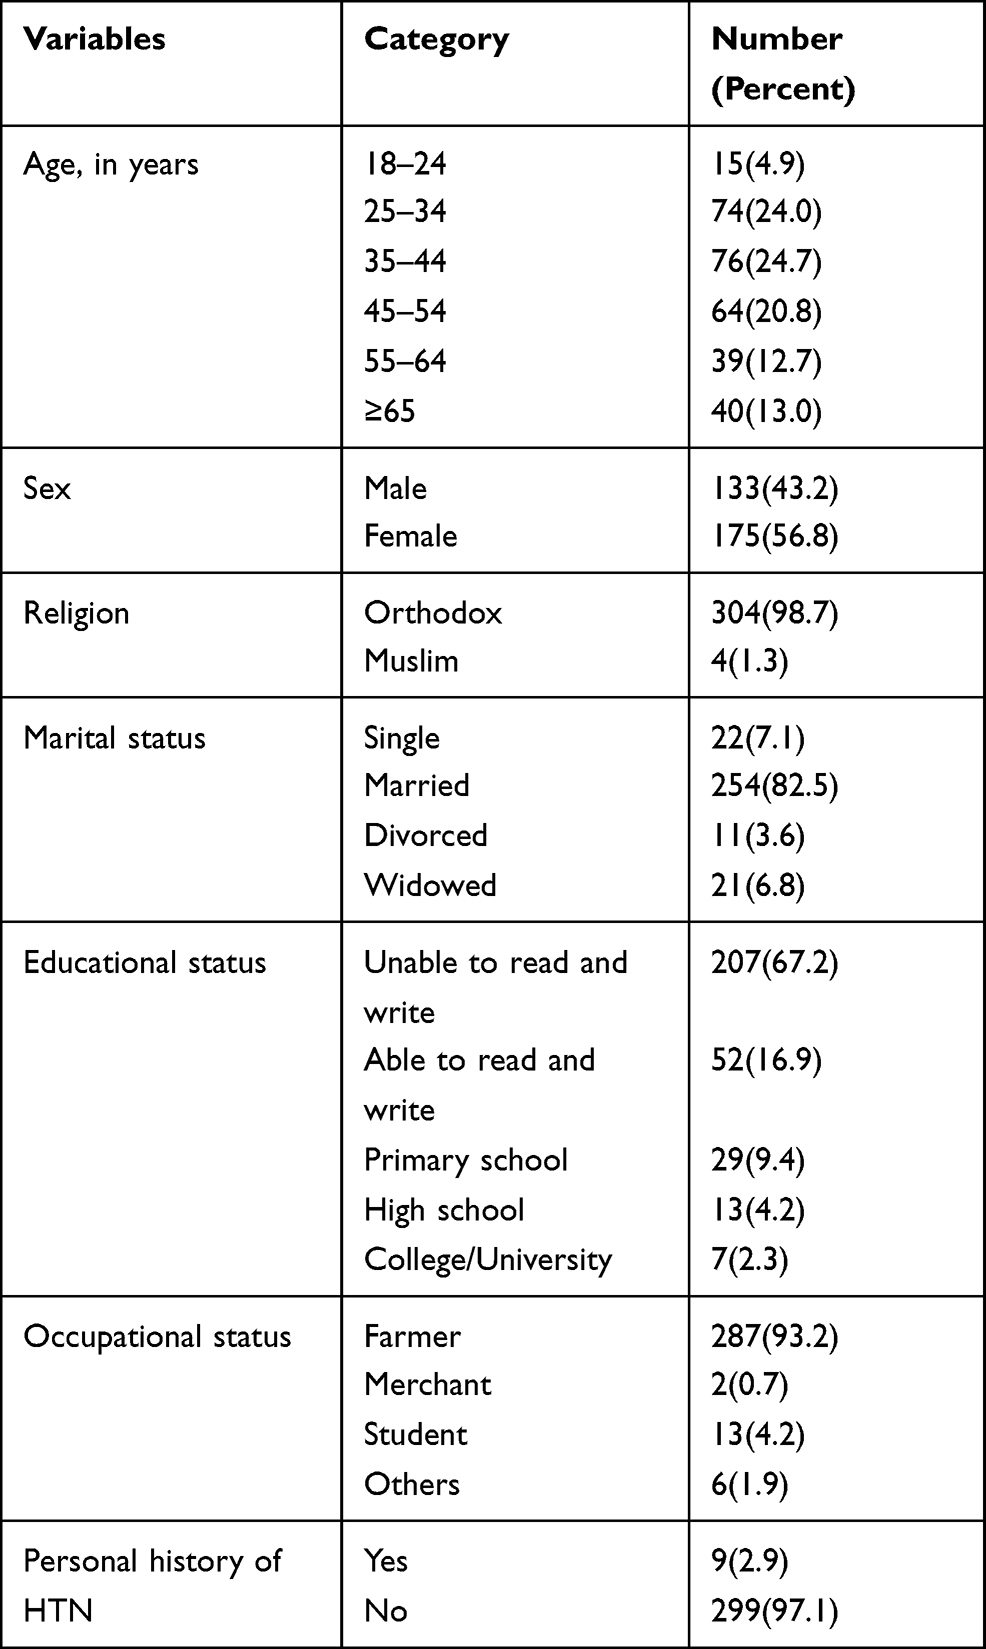 |
Table 1 Sociodemographic Characteristics of Participants in Rural Districts of Northwest Ethiopia (n = 308) |
Content Validity
In this study, the content validation showed the content validity index for the individual items ranged from 0.78 to 1, content validity index of the overall scale (0.96), and kappa coefficient of agreement ranged from 0.8 to 1.
Item Analysis
The overall mean of health beliefs towards hypertension was 3.35, ranging from 2.36 to 4.2. The low item mean (2.36) was “I am more likely to catch hypertension than other people”, indicating that most participants had poor belief in the perceived susceptibility to hypertensive disease. The high item mean (4.22) was “hypertension is a serious disease”, indicating that the majority of the participants were perceived hypertensive disease as highly dangerous (Table 2).
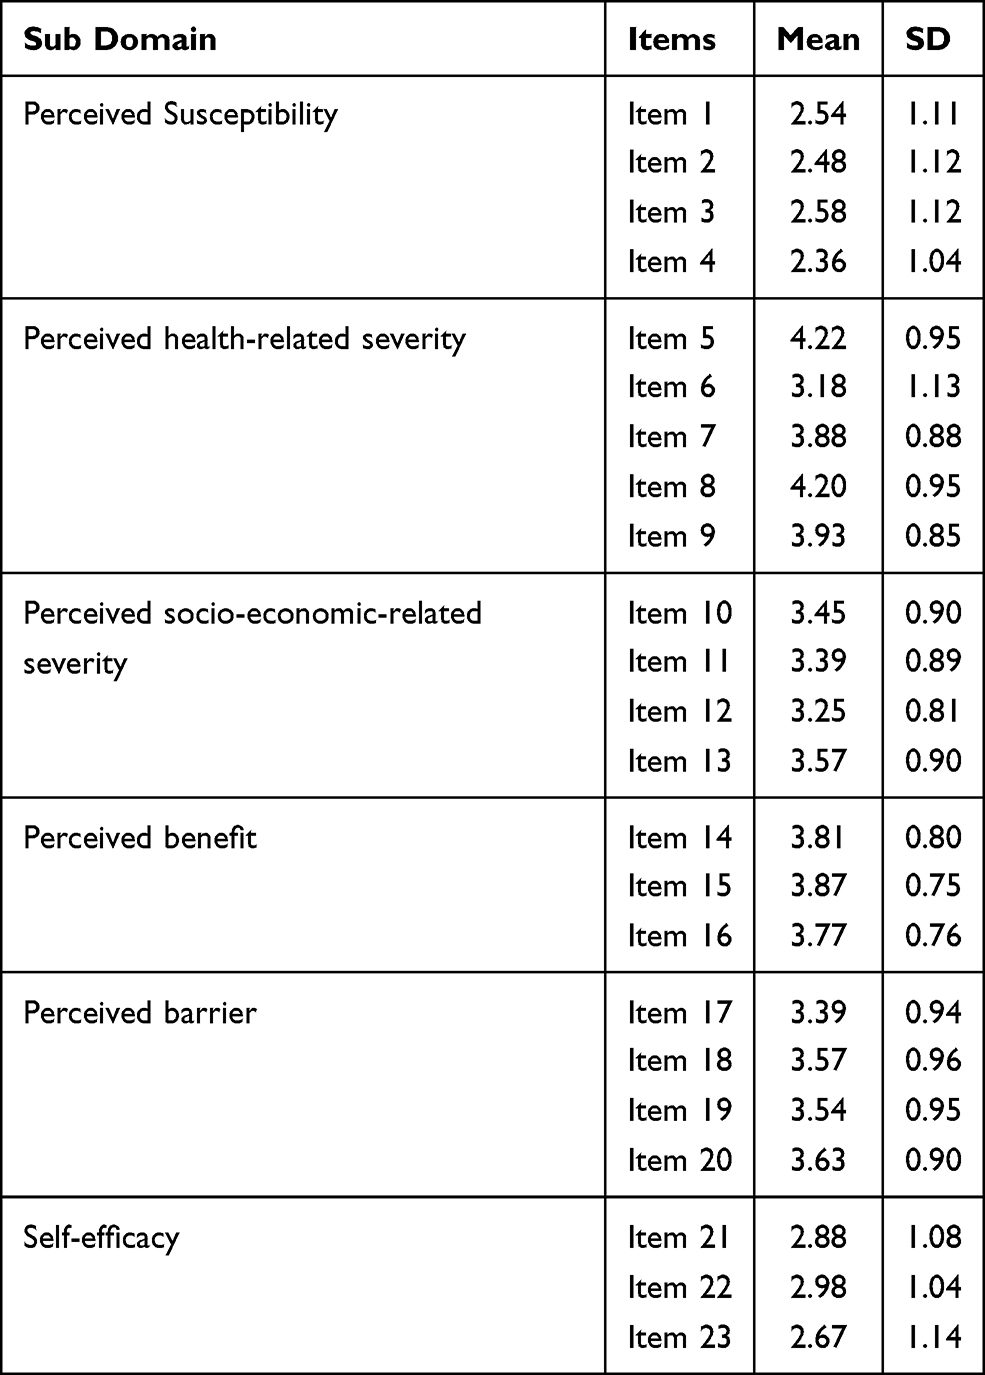 |
Table 2 Item Analysis of the Health Belief Assessment Tool |
Exploratory Factor Analysis
The correlation matrix showed the inter-item correlations were above the cut-off value ranging from 0.36 to 0.80. The KMO measure of sampling adequacy was 0.84, which revealed that the sample size was adequate for factor analysis. The measure of sampling adequacies ranging from 0.74 (“I follow health information about hypertension”) to 0.89 (“hypertension is a serious disease”) were also above the cut-off value of 0.50. Bartlett’s test of sphericity, which tests the null hypothesis that the original correlation matrix is an identity matrix, was statistically significant (χ2= 3756.48, df = 253, p=0.000). The communality values for all the items were above the cut-off value (0.30) and ranged from 0.41 to 0.88. All these indicated that the data were suitable for EFA and can be grouped into a smaller number of underlying factors.
Factor Extraction
The principal component analysis identified and retained 6 factors with an eigenvalue of >1 for further analysis. The scree plot also verified the existence of 6 factors above an eigenvalue of 1. The first factor explained 26.2% of the total variance of hypertension belief in the data set. The second factor explained 15.2% of the total variance in the data set. Factors three, four, five, and six explained 10.7%, 6.8%, 5.7%, and 5.5% of the total variance of hypertension belief in the data set, respectively. Overall, items loaded on the 6 factors for the HBAT explained 70.06% of the variation in hypertension belief in the data set (Table 3).
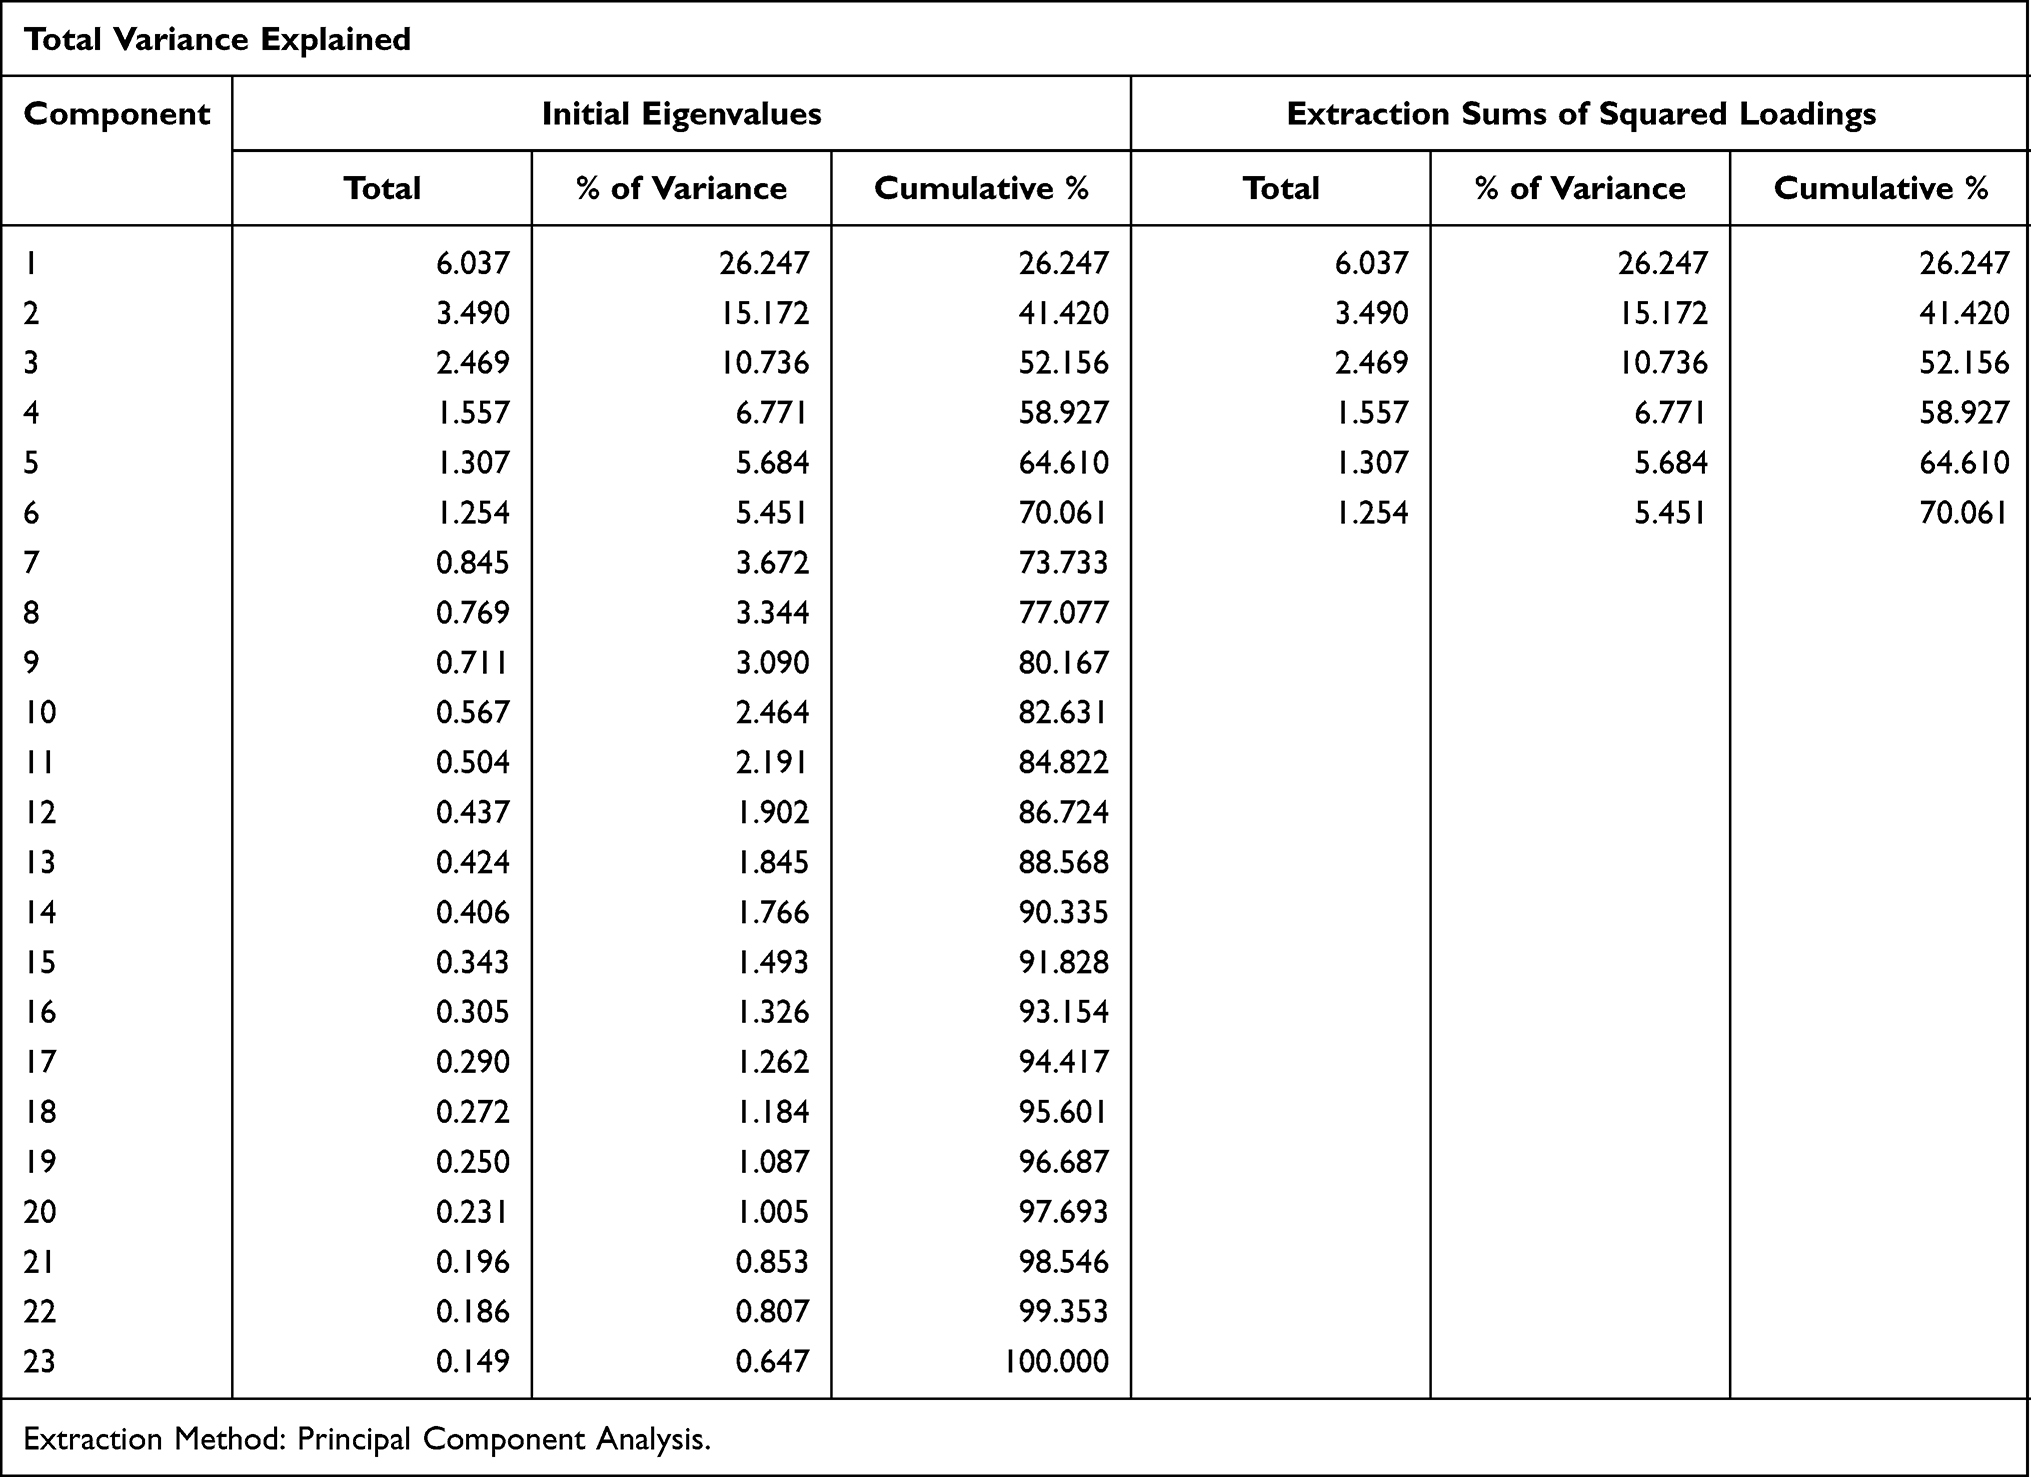 |
Table 3 Total Variance Explained of the Health Belief Assessment Tool |
Factor Rotation
The rotated component matrix showed that items 1 to 4 strongly loaded on factor 1 with factor loadings ranging from 0.88 to 0.94, items 5 to 9 loaded on factor 2 with factor loadings ranging from 0.56 to 0.87, items 21 to 23 loaded on factor 3 with factor loadings ranging from 0.89 to 0.90, items 17 to 20 loaded on factor 4 with factor loading ranging from 0.48 to 0.90, items 10 to 13 loaded on factor 5 with factor loading ranging from 0.69 to 0.80, and items 14 to 16 strongly loaded on factor 6 with factor loading ranging from 0.81 to 0.84 (Table 4).
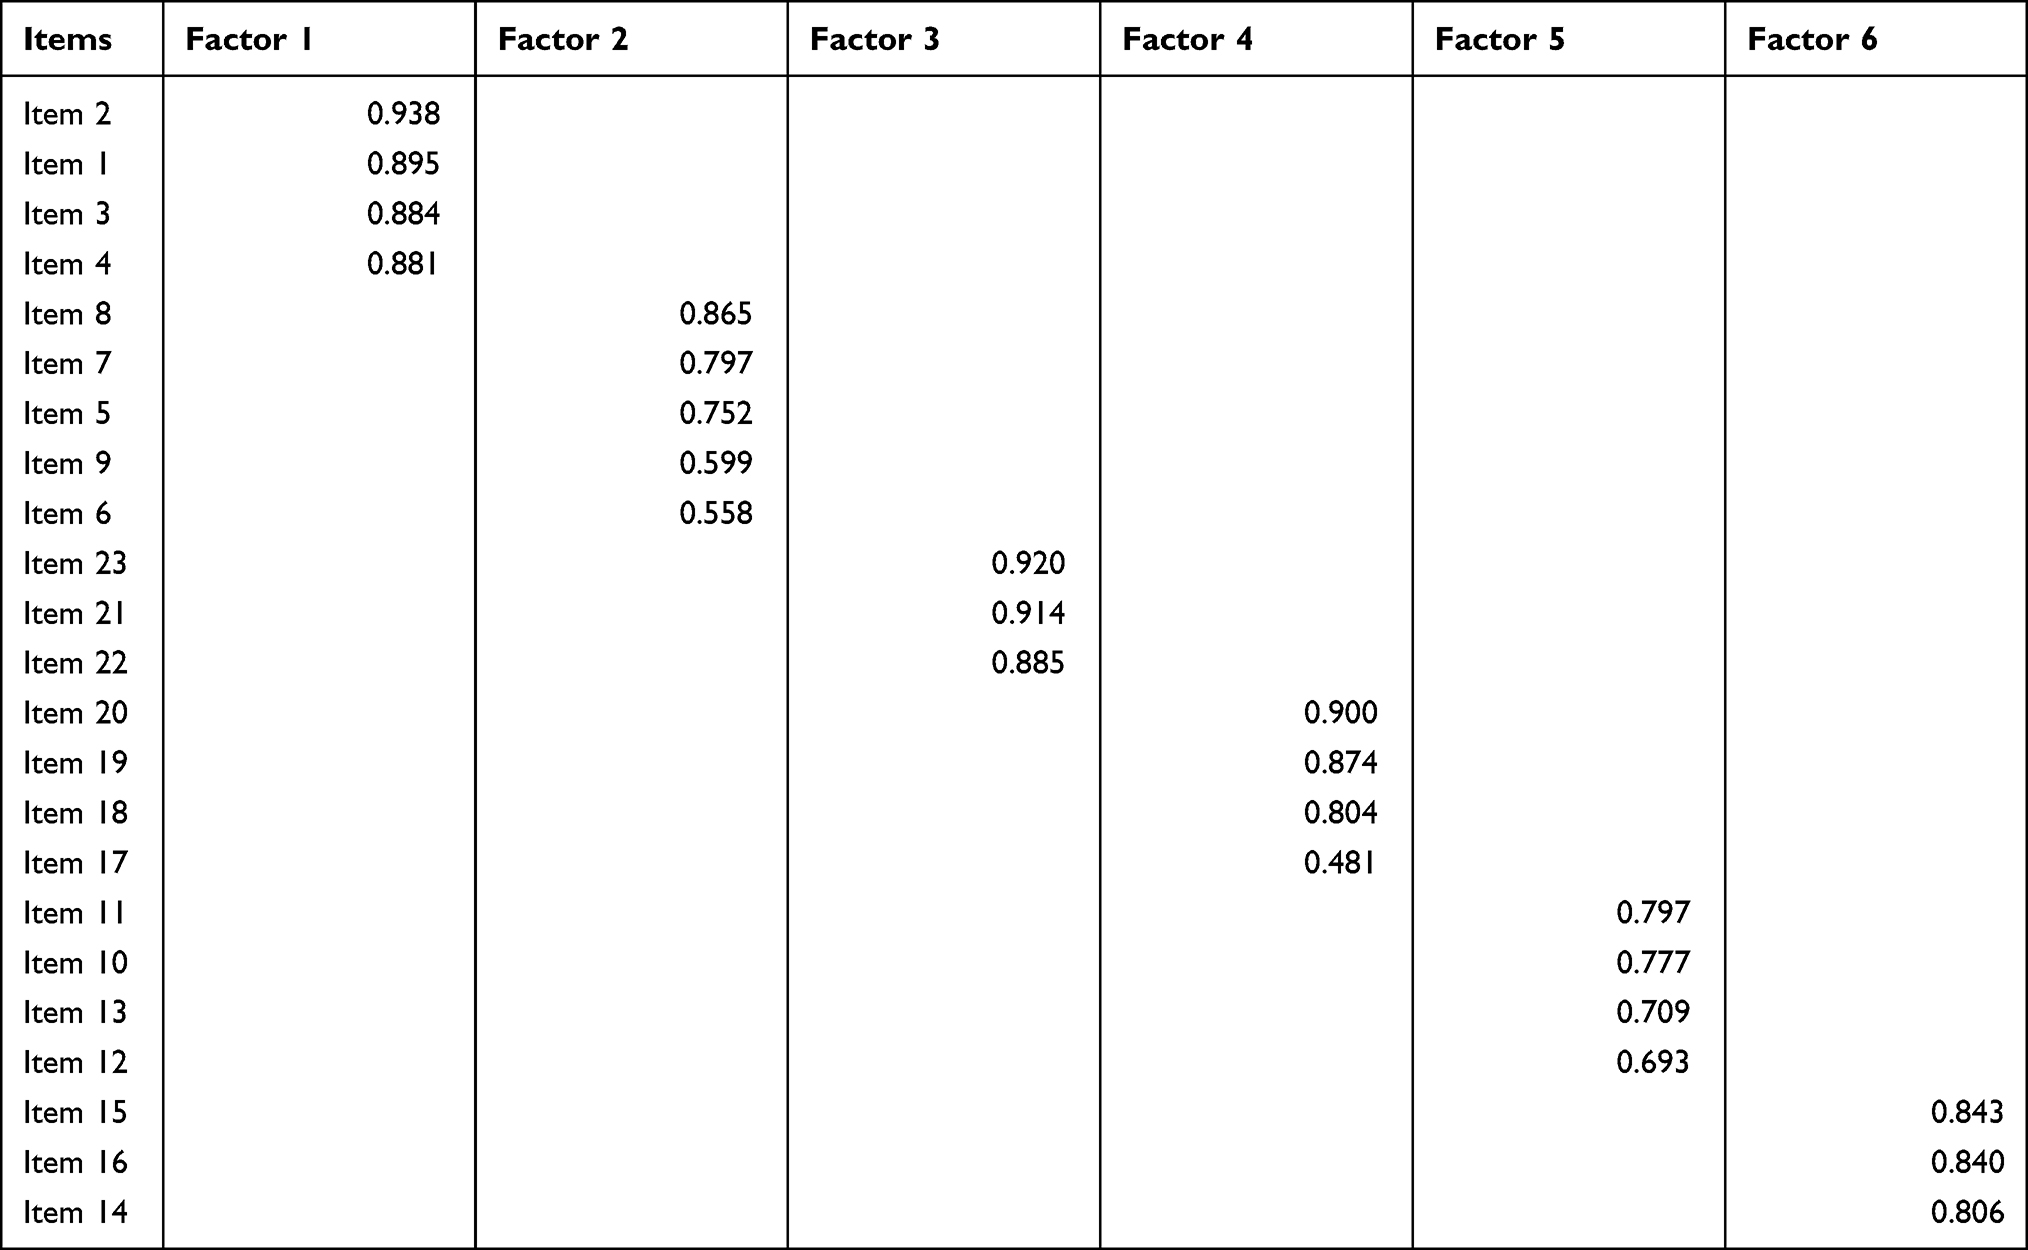 |
Table 4 Pattern Matrix Showing Factor Loadings for the Health Belief Assessment Tool |
Labeling of Factors
Items within each factor of the pattern matrix were examined to label the factors. Factor 1 included four items to measure the health beliefs of participants regarding their susceptibility towards hypertension and labeled them as “perceived susceptibility”. Factor 2 included 5 items to measure participants’ health perception towards the health-related severity of hypertension and labeled as “perceived health-related severity of the disease”. Factor 3 represented 3 items to measure participants’ self-efficacy to prevent hypertension and labeled as “perceived self-efficacy”. Factor 4 included 4 items to measure the health beliefs of participants about possible barriers to taking an appropriate measure and labeled as “perceived barriers to take action”. Factor 5 labeled as “perceived socio-economic-related severity”, participants’ belief towards socio-economic consequences of the disease. Factor 6 included 3 items to measure the health belief of participants about the benefits of taking measure and labeled as “perceived benefits of taking action”. The factors extracted were in agreement with the hypothesized theoretical groupings of the HBM. However, the EFA divided the perceived severity into two distinct sub-domains (perceived health-related and socio-economic-related severity).
Inter-Factor Correlations
The oblique promax rotation revealed that there was moderate correlation among factors, such as factor 2 with 4 (IFC = 0.328), factor 2 with 5 (IFC = 0.407), factor 2 with 6 (IFC = 0.431), factor 3 with 5 (IFC = 0.329), factor 4 with 5 (IFC = 0.442), factor 4 with 6 (IFC = 0.339), and factor 5 with 6 (IFC = 0.375).
Reliability Analysis
Inter-Item and Item-Total Correlations
The inter-item correlations ranged from 0.69 to 0.80 for perceived susceptibility of hypertensive disease; 0.37 to 0.64 for perceived health-related severity; 0.39 to.0.52 for perceived socio-economic related severity of the disease; 0.59 to 0.71 for the perceived benefit to take action; 0.43 to 0.67 for perceived barriers to take action; and 0.71 to 0.76 for perceived self-efficacy to take action. The corrected item-total correlations were all positive and ranged from 0.28 to 0.57, which means that the items were sufficiently related and contributed to scale measurement.
Internal Consistency Reliability
The Cronbach’s α were calculated for the entire scale and the six sub-domains of the HBAT and found to be an appropriate tool to measure an individual’s belief towards hypertension. The Cronbach’s alpha coefficient was 0.85 for the entire scale. It was 0.92 for the perceived susceptibility; 0.78 for perceived health-related severity; 0.74 for perceived socio-economic-related severity; 0.86 for the perceived benefit of taking action; 0.81 for perceived barriers to take action; and 0.89 for self-efficacy to take action. There is no improvement in Cronbach’s alpha coefficient if any of the items are deleted from the scale. Therefore, we would not want to remove any of the items (Table 5).
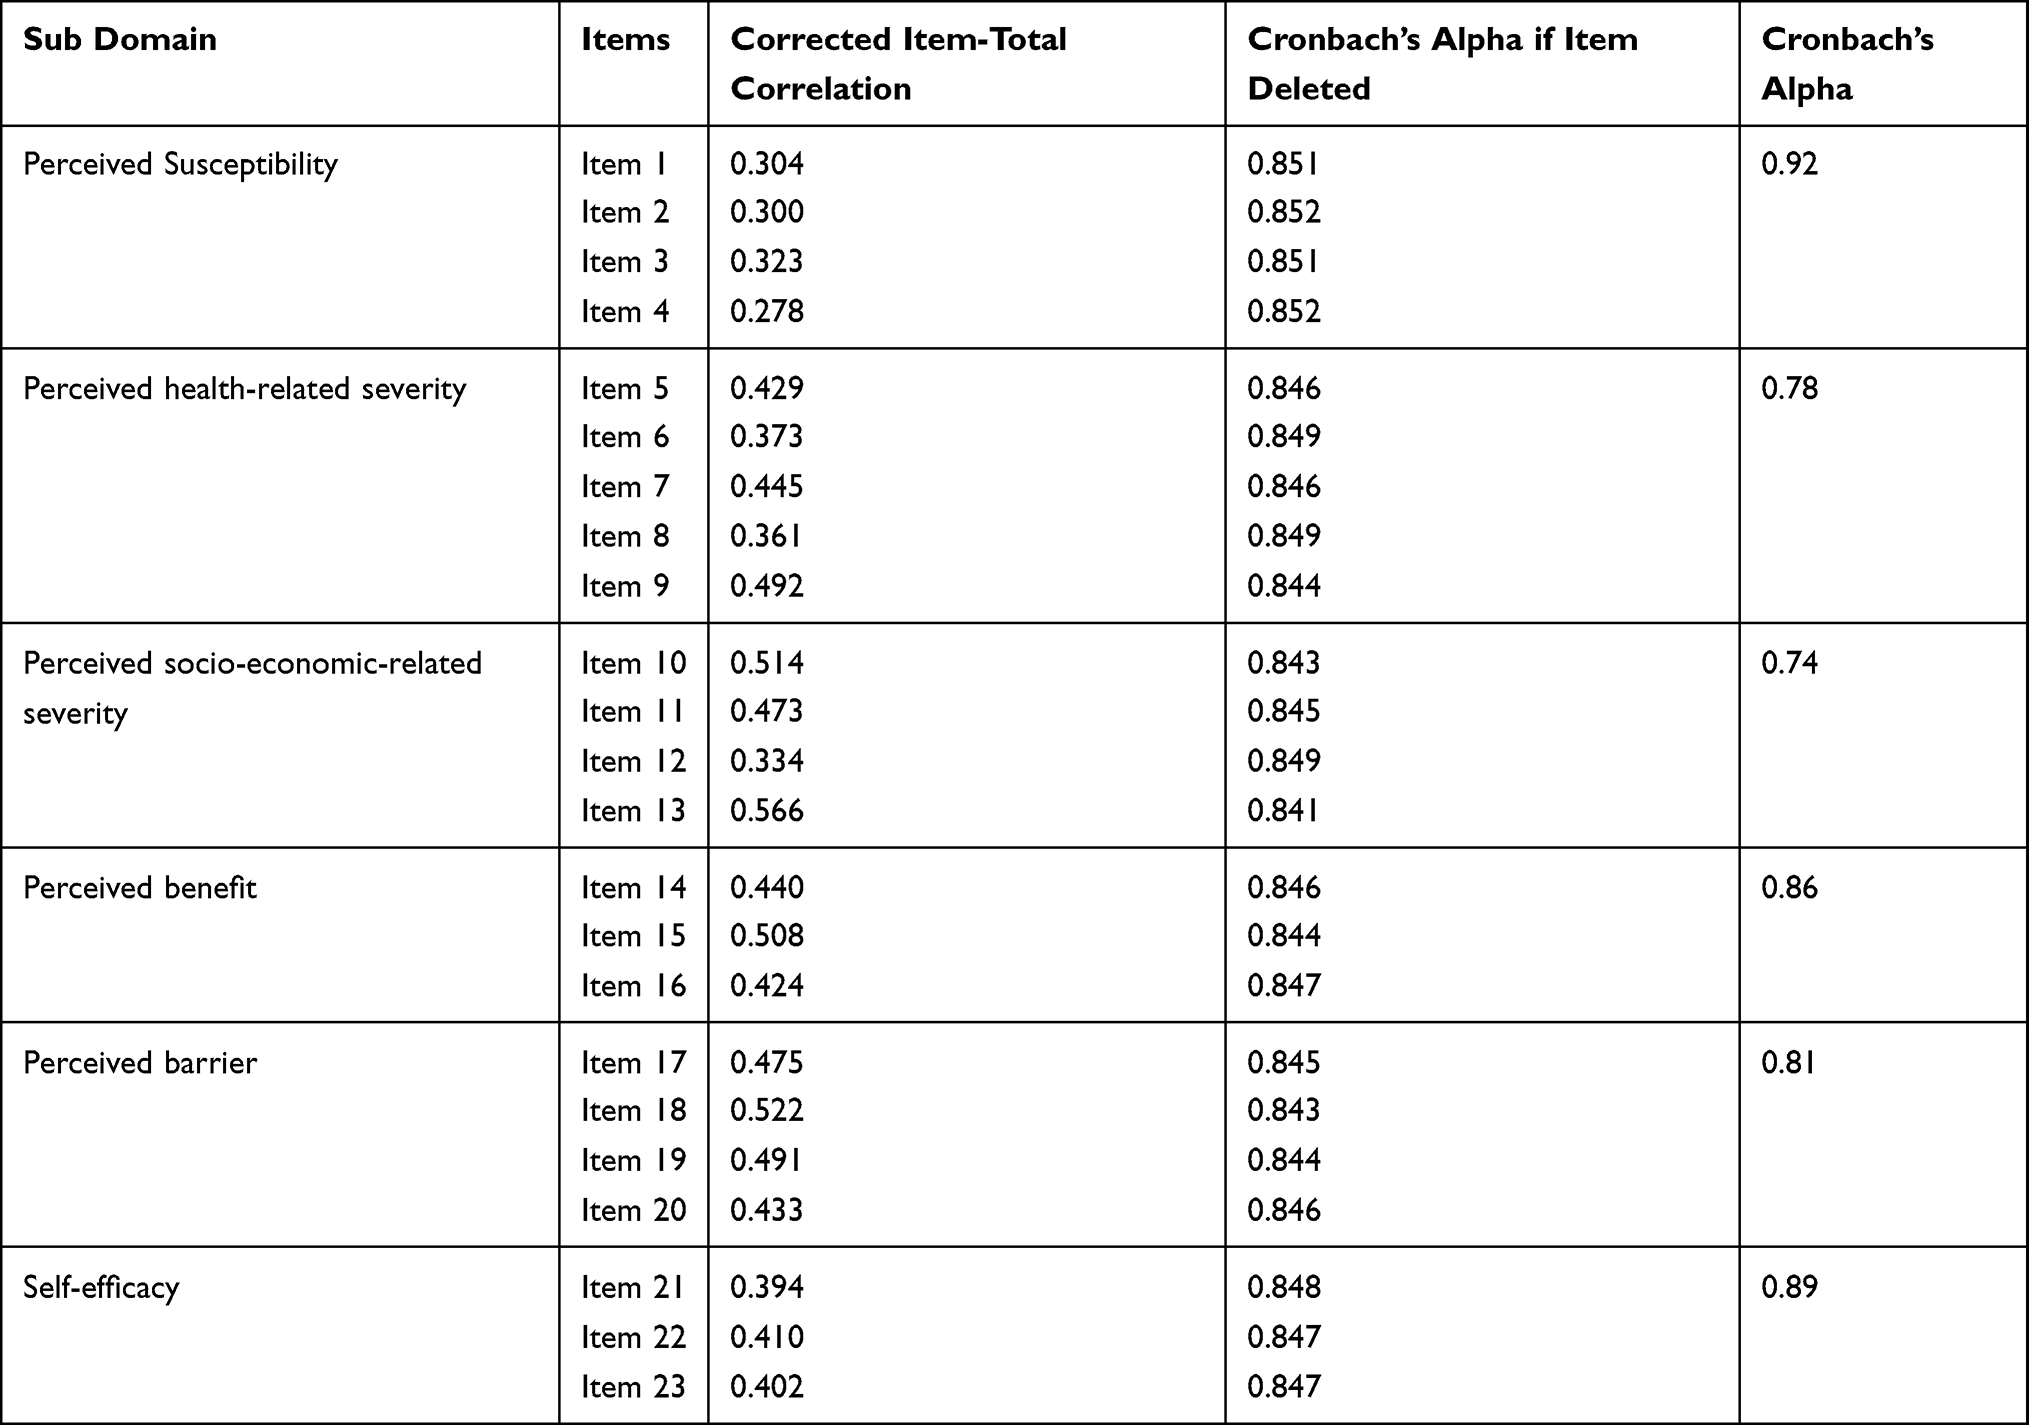 |
Table 5 Internal Consistency Reliability of the Health Belief Assessment Tool |
Construct Validity
In this study, the AVEs were above the cut-off value of 0.5 for all factors, ranging from 0.55 to 0.82. Hence, convergent validity had been established. The maximum shared variance, the squared of the inter-factor correlation, in any correlations between the two constructs were lower than the AVE in each factor indicated that discriminate validity had been established. The correlations among the factors ranged from −0.038 to 0.442, which are less than 0.85 indicated factors, are distinct from each other (no multicollinearity between the items). These indicators revealed that HBAT had good discriminant validity for all six factors.
Discussion
This validation study explored the health beliefs of the adult population towards hypertension in rural districts, northwest Ethiopia. The study revealed strong inter-items and item-to-total correlations within the sub-domains of the scale. The KMO sampling adequacy value (0.84) was found to be good. This was in agreement with the HBS for patients with hypertension (KMO = 0.78),59 the Spanish version of CHBMS for breast cancer screening (KMO = 0.81),63 the Mexican version of Health Belief Model Scale for breast self-examination (KMO = 0.84),50 and Malaysian version of CHBMS for breast cancer screening (KMO = 0.87).84 But, it was higher than the Chennai hypertension screening tool (KMO = 0.67)62 and the Health Belief Model Questionnaire for promoting Breast Self-Examination (KMO = 0.69%),51 which had fair sampling adequacy.
The EFA identified six sub-domains, namely Perceived susceptibility, Perceived health-related severity, Perceived socio-economic-related severity, Perceived benefit, Perceived barriers, and Self efficacy with excellent factor loadings except for item 17 (0.48) (“Lack of health information can prevent getting healthcare services”). The factor loadings ranged from 0.48 to 0.93, indicating that all items represented the same construct. It was consistent with the HBS for hypertensive patients (0.67–0.87)59 and HBS for testicular cancer self-examination (0.37–0.89).54 The absence of cross-loading items and the high loading of each item in each factor indicated that each item was strongly correlated with its corresponding factor.
The EFA also revealed that all the sub-domains in the scale explained 70.06% of the total variance in the data set. This finding was in agreement with the HBS for hypertensive patients (TVE = 72%)59 and Health Belief Model Questionnaire for promoting Breast Self-Examination (TVE = 74.2%).51 However, the TVE in this study was far better than validation studies conducted in Chennai urban community (TVE = 42.4%),62 HBS for testicular cancer self-examination (TVE = 53.8%),54 and the Spanish version CHBMS for breast cancer screening (TVE = 50.4%).63
The positive and significant correlations between some factors or constructs indicated a synergistic relationship between the sub-domains. Perceived health-related severity of hypertensive disease was positively correlated with the perceived barriers and benefits of taking action. Those individuals who have had positive beliefs about the health-related severity of the disease tend to have lower barriers to taking preventive action and higher perceived benefits of taking preventive action. There was also a positive correlation between the perceived socio-economic-related severity of the disease with the perceived barrier, benefit, and self-efficacy of taking action. Those individuals who have had positive beliefs towards the socio-economic-related severity of hypertensive disease tend to have lower barriers to taking preventive action, high perception of the benefits of taking preventive action, and high self-efficacy in performing hypertension screening.
The internal consistency reliability of the overall scale was found to be good with Cronbach’s alpha value of 0.85. This finding was in agreement with the HBS for hypertensive patients (Cronbach’s α=0.79)59 and the various versions of the CHBMS.51,52,63,84–86 The internal consistency reliability for each sub-domain also showed good to excellent reliability (Cronbach’s α= 0.74 to 0.92). This finding was also in agreement with the Greek Version of CHBMS (Cronbach’s α=0.66 to 0.88),52 the Indian version of CHBMS for breast self-examination (Cronbach’s α=0.67 to 0.87),53 the Malaysian version of CHBMS for breast cancer screening (Cronbach’s α=0.716 to 0.879),84 Iranian version (Cronbach’s α=0.72 to 0.82),86 Spanish version (Cronbach’s α= 0.69, 0.83),63 and HBS for Testicular Cancer Self-Examination (Cronbach’s α=0.64–0.88).54 However, it was higher than the HBS for hypertensive patients (Cronbach’s α=0.52 to 0.69).59 This might be due to the current validation study dividing the perceived severity of the disease into two distinct categories (perceived health-related and socio-economic-related severity).
Limitations of the Study
The study included only the rural population, and it was difficult to generalize to the urban adult population.
Conclusions
This study is the first to explore an individual’s belief towards hypertension based on the HBM in rural settings of northwest Ethiopia. The HBAT found a valid and reliable instrument to evaluate the health beliefs related to hypertension for the general rural adult population. It is recommended that researchers can use this tool to measure the health beliefs of the adult population in rural settings. Healthcare providers can also use this tool to assess an individual’s health beliefs towards hypertension and provide education and the support needed, based on the HBM for rural adults in Ethiopia. Further, a validation study is needed to evaluate the HBAT in the urban setting of the general population of the country.
Abbreviations
AVE, Average Variance Extracted; CHBMS, Champion’s Health Belief Model Scale; HBAT, Hypertension Belief Assessment Tool; HBM, Health Belief Model; HBS Health Belief Scale; KMO, Kaiser– Meyer – Olkin Test; TVE, Total Variance Extracted.
Acknowledgments
We would like to acknowledge the University of Gondar for the approval and facilitation of the dissertation proposal. We would like to thank Amhara Public Health Institute, Zonal, and District health administrations for their willingness to conduct the study. We would also like to thank Professor Solomon Mekonnen Abebe, Mr. Abebaw Addis Gelagay, Mr. Temesgen Yihunie Akalu, Mr. Haileab Fekadu Wolde, Mr. Getayeneh Antehunegn Tesema, and Mr. Habtamu Sewunet Mekonnen for their contribution in making face validity of the tool.
Author Contributions
All authors contributed significantly to the work reported, that is in the conception, study design, data collection, data analysis, and drafting or revising the article. The authors have agreed on the journal to which the article was submitted, gave final approval for the version to be published, and agreed to be accountable for all aspects of the work.
Funding
This validation study is part of Ph.D. training for DFT. This work was supported financially by the University of Gondar. However, the university had no role in study design, data collections, and analysis, decision to publish, or preparation of the manuscript.
Disclosure
The authors declared that they have no conflicts of interest in this work.
References
1. Hermida RC, Ayala DE, Fernandez JR, Mojon A, Smolensky MH. Hypertension: new perspective on its definition and clinical management by bedtime therapy substantially reduces cardiovascular disease risk. Eur J Clin Invest. 2018;48(5):e12909. doi:10.1111/eci.12909
2. Bromfield S, Muntner P. High blood pressure: the leading global burden of disease risk factor and the need for worldwide prevention programs. Curr Hypertens Rep. 2013;15(3):134–136. doi:10.1007/s11906-013-0340-9
3. Nguyen TN, Chow CK. Global and national high blood pressure burden and control. Lancet. 2021;398(10304):932–933. doi:10.1016/S0140-6736(21)01688-3
4. Bozkurt B, Aguilar D, Deswal A, et al. Contributory risk and management of comorbidities of hypertension, obesity, diabetes mellitus, hyperlipidemia, and metabolic syndrome in chronic heart failure: a scientific statement from the American Heart Association. Circulation. 2016;134(23):e535–e578.
5. Drozdz D, Kawecka-Jaszcz K. Cardiovascular changes during chronic hypertensive states. Pediatr Nephrol. 2014;29(9):1507–1516. doi:10.1007/s00467-013-2614-5
6. US Department of Health Human Services; National Institutes of Health; National Heart, Lung, and Blood Institute; 2003. Your Guide to Lowering Blood Pressure. Available from: https://www.nhlbi.nih.gov/files/docs/public/heart/hbp_low.pdf. Accessed November 17, 2021.
7. Maryon-Davis A, Press V. Easing the pressure: Tackling hypertension toolkit. National Heart Forum; 2005. Available from: https://www.heartforum.org.uk/Publications_NHFreports_HypertensionToolkit.aspx. Accessed November 17, 2021.
8. Non-communicable diseases news. World Health Organization; Pan American Health Organization; 2016. Previously available from: https://www3.paho.org/hq/index.php?option=com_content&view=article&id=12757:ncd-risc-high-blood-pressure-affects-113-billion&Itemid=4327&lang=pt.
9. Emerging Public Health Problems in Ethiopia: Chronic Non-Communicable Diseases. Ethiopian Public Health Association; 2012. Available from: https://www.etpha.org/publications/other-publications.html?download=385:other-publications. Accessed November 17, 2021.
10. Tiruneh SA, Bukayaw YA, Yigizaw ST, Angaw DA. Prevalence of hypertension and its determinants in Ethiopia: a systematic review and meta-analysis. PLoS One. 2020;15(12):e0244642. doi:10.1371/journal.pone.0244642
11. Gudina EK, Michael Y, Assegid S. Prevalence of hypertension and its risk factors in southwest Ethiopia: a hospital-based cross-sectional survey. Integr Blood Press Control. 2013;6:111. doi:10.2147/IBPC.S47298
12. Mekonnen AS, Yemane B, Alemayehu W, Assefa G. Prevalence and associated factors of hypertension: a crossectional community based study in Northwest Ethiopia. PLoS One. 2015;10(4):e0125210. doi:10.1371/journal.pone.0125210
13. Mensah GA. Epidemiology and Global Burden of Hypertension. Oxford University Press; 2019.
14. Elevating hypertension on the public health agenda: World Heart Federation; May 17, 2018. Available from: https://www.world-heart-federation.org/news/elevating-hypertension-public-health-agenda/.
15. Tefera YG, Abegaz TM, Abebe TB, Mekuria AB. The changing trend of cardiovascular disease and its clinical characteristics in Ethiopia: hospital-based observational study. Vasc Health Risk Manag. 2017;13:143.
16. Rubinstein A, Colantonio L, Bardach A, et al. Estimation of the burden of cardiovascular disease attributable to modifiable risk factors and cost-effectiveness analysis of preventative interventions to reduce this burden in Argentina. BMC Public Health. 2010;10(1):627. doi:10.1186/1471-2458-10-627
17. Tocci G, Sciarretta S, Volpe M. Development of heart failure in recent hypertension trials. J Hypertens. 2008;26(7):1477–1486. doi:10.1097/HJH.0b013e3282fe1d3d
18. Erkabu SG, Agedie Y, Mihretu DD, Semere A, Alemu YM. Ischemic and hemorrhagic stroke in Bahir Dar, Ethiopia: a Retrospective Hospital-Based Study. J Stroke Cerebrovasc Dis. 2018;27(6):1533–1538. doi:10.1016/j.jstrokecerebrovasdis.2017.12.050
19. Deresse B, Shaweno D. Epidemiology and in-hospital outcome of stroke in South Ethiopia. J Neurol Sci. 2015;355(1–2):138–142. doi:10.1016/j.jns.2015.06.001
20. Temesgen TG, Teshome B, Njogu P. Treatment outcomes and associated factors among hospitalized stroke patients at shashemene referral hospital, Ethiopia. Stroke Res Treat. 2018;2018:1–5. doi:10.1155/2018/8079578
21. Bikila G, Takele M, Tesfaye B, Hailu A. Assessment of risk factors and treatment outcome of stroke admissions at St. Paul’s teaching hospital, Addis Ababa, Ethiopia. J Neurol. 2017;8:03.
22. Alemayehu CM, Birhanesilasie SK. Assessment of stoke patients: occurrence of unusually high number of haemorrhagic stroke cases in Tikur anbessa specialized hospital, Addis Ababa, Ethiopia. Clin Med Res. 2013;2(5):94–100. doi:10.11648/j.cmr.20130205.11
23. Mattila R. Effectiveness of a Multidisciplinary Lifestyle Intervention on Hypertension, Cardiovascular Risk Factors and Musculoskeletal Symptoms. University of Kuopio; 2009.
24. WHO. Global status report on noncommunicalble diseases; 2014: Attaining the Nine Global Noncommunicable Diseases Targets; a Shared Responsibility. Available from: https://apps.who.int/iris/handle/10665/148114. Accessed November 17, 2021.
25. Law M, Morris J, Wald N. Use of blood pressure lowering drugs in the prevention of cardiovascular disease: meta-analysis of 147 randomised trials in the context of expectations from prospective epidemiological studies. BMJ. 2009;338(may19 1):b1665. doi:10.1136/bmj.b1665
26. Ettehad D, Emdin CA, Kiran A, et al. Blood pressure lowering for prevention of cardiovascular disease and death: a systematic review and meta-analysis. Lancet. 2016;387(10022):957–967. doi:10.1016/S0140-6736(15)01225-8
27. Antonakoudis G, Poulimenos I, Kifnidis K, Zouras C, Antonakoudis H. Blood pressure control and cardiovascular risk reduction. Hippokratia. 2007;11(3):114.
28. Carey RM, Whelton PK. Prevention, detection, evaluation, and management of high blood pressure in adults: synopsis of the 2017 American college of cardiology/American heart association hypertension guideline. Ann Intern Med. 2018;168(5):351–358. doi:10.7326/M17-3203
29. Fernandez S, Tobin JN, Cassells A, Diaz-Gloster M, Kalida C, Ogedegbe G. The counseling African Americans to control hypertension (CAATCH) trial: baseline demographic, clinical, psychosocial, and behavioral characteristics. Implement Sci. 2011;6(1):100. doi:10.1186/1748-5908-6-100
30. Addressing the Impact of Noncommunicable Diseases And Injuries In Ethiopia: A Collaboration with the Global Lancet Commission on Reframing NCDIs for the Poorest Billion. Addis Ababa: Federal Democratic Republic of Ethiopia Ministry of Health; 2018.
31. Samuel AL, Yohannes AS, Laemengo GF. Hypertension and its associated factors in Hosanna town, Southern Ethiopia: community based cross-sectional study. BMC Res Notes. 2018;11(1):306. doi:10.1186/s13104-018-3435-1
32. Animut Y, Assefa AT, Lemma DG. Blood pressure control status and associated factors among adult hypertensive patients on outpatient follow-up at University of Gondar Referral Hospital, Northwest Ethiopia: a retrospective follow-up study. Integr Blood Press Control. 2018;11:37. doi:10.2147/IBPC.S150628
33. Teshome DF, Demssie AF, Zeleke BM. Determinants of blood pressure control amongst hypertensive patients in Northwest Ethiopia. PLoS One. 2018;13(5):e0196535. doi:10.1371/journal.pone.0196535
34. Long E, Ponder M, Bernard S. Knowledge, attitudes, and beliefs related to hypertension and hyperlipidemia self-management among African-American men living in the southeastern United States. Patient Educ Couns. 2017;100(5):1000–1006. doi:10.1016/j.pec.2016.12.011
35. Veerapu N, Baer PRK, Kudumula M. Health beliefs about hypertension among hypertensive elderly people in Khammam urban locality: health belief model. Int J Community Med Public Health. 2020;7(10):3892.
36. Puspita RC, Tamtomo D, Indarto D. Health belief model for the analysis of factors affecting hypertension preventive behavior among adolescents in Surakarta. J Health Promot Behav. 2017;2(2):183–196. doi:10.26911/thejhpb.2017.02.02.08
37. Khatib R, Schwalm J-D, Yusuf S, et al. Patient and healthcare provider barriers to hypertension awareness, treatment and follow up: a systematic review and meta-analysis of qualitative and quantitative studies. PLoS One. 2014;9(1):e84238. doi:10.1371/journal.pone.0084238
38. Okwuonu CG, Ojimadu NE, Okaka EI, Akemokwe FM. Patient-related barriers to hypertension control in a Nigerian population. Int J Gen Med. 2014;7:345. doi:10.2147/IJGM.S63587
39. Osamor PE, Ojelabi OA. Health belief model and hypertension treatment compliance.
40. Setiyaningsih R, Tamtomo D, Suryani N. Health belief model: determinants of hypertension prevention behavior in adults at community health center, sukoharjo, central java. J Health Promot Behav. 2016;1(3):160–170. doi:10.26911/thejhpb.2016.01.03.03
41. Naanyu V, Vedanthan R, Kamano JH, et al. Barriers influencing linkage to hypertension care in Kenya: qualitative analysis from the LARK hypertension study. J Gen Intern Med. 2016;31(3):304–314. doi:10.1007/s11606-015-3566-1
42. Labaran K, Mohammed M, Sa’eed S, Wada A, Mustapha S. Relationship between patients’ beliefs about their antihypertensives and adherence in a secondary hospital in northern Nigeria. Bayero J Pure Appl Sci. 2017;10(1):276–279. doi:10.4314/bajopas.v10i1.55S
43. Al-Noumani H, Wu J-R, Barksdale D, Sherwood G, Alkhasawneh E, Knafl G. Health beliefs and medication adherence in patients with hypertension: a systematic review of quantitative studies. Patient Educ Couns. 2019;102(6):1045–1056. doi:10.1016/j.pec.2019.02.022
44. Kressin NR, Wang F, Long J, et al. Hypertensive patients’ race, health beliefs, process of care, and medication adherence. J Gen Intern Med. 2007;22(6):768–774. doi:10.1007/s11606-007-0165-9
45. Edwards MM. Beliefs about hypertension among people with uncontrolled hypertension; 2015.
46. Goldmann E, Jacoby R, Finfer E, et al. Positive health beliefs and blood pressure reduction in the DESERVE study. J Am Heart Assoc. 2020;9(9):e014782. doi:10.1161/JAHA.119.014782
47. Karen G, Donald B. The role of behavioral science theory in development and implementation of public health interventions. Annu Rev Public Health. 2010;31:399–418. doi:10.1146/annurev.publhealth.012809.103604
48. Janz NK, Becker MH. The health belief model: a decade later. Health Educ Q. 1984;11(1):1–47. doi:10.1177/109019818401100101
49. Woringer M, Nielsen JJ, Zibarras L, et al. Development of a questionnaire to evaluate patients’ awareness of cardiovascular disease risk in England’s national health service health check preventive cardiovascular programme. BMJ Open. 2017;7(9):e014413. doi:10.1136/bmjopen-2016-014413
50. Juárez-García DM, de Jesús García-solís M, Téllez A. Adaptation and validation of the health belief model scale for breast self-examination in Mexican women. Value Health Reg Issues. 2020;23:30–36. doi:10.1016/j.vhri.2019.11.006
51. Mohamed NC, Moey S-F, Lim B-C. Validity and reliability of health belief model questionnaire for promoting breast self-examination and screening mammogram for early cancer detection. Asian Pac J Cancer Prev. 2019;20(9):2865. doi:10.31557/APJCP.2019.20.9.2865
52. Tsangari H, Petro-Nustas W. The psychometric properties of the Greek version of champion’s health belief model scale. J Nurs Meas. 2012;20(3):244–257. doi:10.1891/1061-3749.20.3.244
53. Dewi TK. Validation of the Indonesian version of champion’s health belief model scale for breast self-examination. Psychol Res Behav Manag. 2018;11:433. doi:10.2147/PRBM.S177124
54. Avci IA, Altinel B. The validity and reliability of health belief scale for testicular cancer self-examination. Am J Mens Health. 2018;12(3):531–538. doi:10.1177/1557988315611226
55. Soleymanian A, Niknami S, Hajizadeh E, Shojaeizadeh D, Montazeri A. Development and validation of a health belief model based instrument for measuring factors influencing exercise behaviors to prevent osteoporosis in pre-menopausal women (HOPE). BMC Musculoskelet Disord. 2014;15(1):1–8. doi:10.1186/1471-2474-15-61
56. Dean-Barr S. Development of an instrument to measure the health beliefs of individuals with arthritis; 1991. Available from: https://ecommons.luc.edu/cgi/viewcontent.cgi?article=3755&context=luc_diss. Accessed November 17, 2021.
57. Kartal A, Özsoy SA. Validity and reliability study of the Turkish version of health belief model scale in diabetic patients. Int J Nurs Stud. 2007;44(8):1447–1458. doi:10.1016/j.ijnurstu.2007.06.004
58. Vazini H, Barati M. The health belief model and self-care behaviors among type 2 diabetic patients. Iran J Diabetes Obes. 2014;6(3):107–113.
59. Oruganti R, Paidipati S, Dinaker M. The health beliefs scale for hypertensive patients: construction and psychometric testing. J Nurs Health Sci. 2018;7(6):34–43.
60. Rosenstock IM. The health belief model and preventive health behavior. Health Educ Monogr. 1974;2(4):354–386. doi:10.1177/109019817400200405
61. Bandura A. Self-efficacy: toward a unifying theory of behavioral change. Psychol Rev. 1977;84(2):191. doi:10.1037/0033-295X.84.2.191
62. Neelakandan BV, Gopalakrishnan S, Ramachandran H, Anuradha R, Gopichandran V. Health beliefs regarding uptake of hypertension screening in an urban setting: a population segmentation strategy. Int J Med Public Health. 2018;8:1. doi:10.5530/ijmedph.2018.1.3
63. Medina-Shepherd R, Kleier JA. Spanish translation and adaptation of Victoria champion’s health belief model scales for breast cancer screening-mammography. Cancer Nurs. 2010;33(2):93–101. doi:10.1097/NCC.0b013e3181c75d7b
64. Saadat M, Ghalehtaki R, Sadeghian D, Mohammadtaheri S, Meysamie A. Can we create a reliable and valid short form of champion health belief model questionnaire? Arch Breast Cancer. 2016;3:19–23.
65. Taherdoost H, Sahibuddin S, Jalaliyoon N. Exploratory Factor Analysis; Concepts and Theory. WSEAS; 2014.
66. Haan NS-D, Wel M, Schoenmakers G, et al. Thirty-minute compared to standardised office blood pressure measurement in general practice. Br J Gen Pract. 2011;61(590):e590–e597.
67. Stojanovic M. IS 30 minutes interval enough for analyzing? Ambulatory blood pressure monitoring? J Hypertens. 2018;36(p e71). doi:10.1097/01.hjh.0000539162.42022.d8
68. Carmines EG, Zeller RA. On establishing the empirical dimensionality of theoretical terms: an analytical example. Political Methodol. 1974;1:75–96.
69. Brian E, Anders S. The Cambridge Dictionary of Statistics. Cambridge University Press Cambridge; 2002.
70. Zijlmans EA, Tijmstra J, van der Ark LA, Sijtsma K. Item-score reliability in empirical-data sets and its relationship with other item indices. Educ Psychol Meas. 2018;78(6):998–1020. doi:10.1177/0013164417728358
71. Henrysson S. Correction of item-total correlations in item analysis. Psychometrika. 1963;28(2):211–218.
72. Yang B. Factor analysis methods. In: Research in Organizations: Foundations Methods of Inquiry. Berrett-Koehler Publishers, Inc.; 2005:181–199.
73. Habing B. Exploratory Factor Analysis. University of South Carolina; O2003. Available from: https://people.stat.sc.edu/habing/courses/530EFA.pdf. Accessed November 17, 2021.
74. Goodwin LD, Leech NL. Understanding correlation: factors that affect the size of r. J Exp Educ. 2006;74(3):249–266. doi:10.3200/JEXE.74.3.249-266
75. Kaiser HF, Rice J. Little jiffy, mark IV. Educ Psychol Meas. 1974;34(1):111–117. doi:10.1177/001316447403400115
76. Shirkey EC, Dziuban CD. A note on some sampling characteristics of the measure of sampling adequacy (MSA). Multivariate Behav Res. 1976;11(1):125–128. doi:10.1207/s15327906mbr1101_9
77. Bartlett MS. A note on the multiplying factors for various χ2 approximations. J R Stat Soc Series B. 1954;16(2):296–298.
78. Andy F. Discovering Statistics Using SPSS for Windows: Advanced Techniques for the Beginner/Andy Field. London: Sage Publications; 2000.
79. Yong AG, Pearce S. A beginner’s guide to factor analysis: focusing on exploratory factor analysis. Tutor Quant Methods Psychol. 2013;9(2):79–94. doi:10.20982/tqmp.09.2.p079
80. Cronbach LJ. Coefficient alpha and the internal structure of tests. Psychometrika. 1951;16(3):297–334. doi:10.1007/BF02310555
81. Cronbach LJ, Meehl PE. Construct validity in psychological tests. Psychol Bull. 1955;52(4):281–302. doi:10.1037/h0040957
82. Fornell C, Larcker DF. Evaluating structural equation models with unobservable variables and measurement error. J Market Res. 1981;18(1):39–50. doi:10.1177/002224378101800104
83. Chin WW, Newsted PR. Structural equation modeling analysis with small samples using partial least squares. Stat Strategies Small Sample Res. 1999;1(1):307–341.
84. Parsa P, Kandiah M, Mohd Nasir M, Hejar A, Nor Afiah M. Reliability and validity of champion’s health belief model scale for breast cancer screening among Malaysian women. Singapore Med J. 2008;49(11):897.
85. Kirag N, Kızılkaya M. Application of the champion health belief model to determine beliefs and behaviors of Turkish women academicians regarding breast cancer screening: a cross sectional descriptive study. BMC Womens Health. 2019;19(1):1–10. doi:10.1186/s12905-019-0828-9
86. Hashemian M, Amin Shokravi F, Lamyian M, Hassanpour K, Akaberi A. Reliability and validity of the champion’s health belief model scale for mammography among Iranian women with family history of breast cancer. Health Educ Promot Pract. 2013;1(3):19–31.
 © 2021 The Author(s). This work is published and licensed by Dove Medical Press Limited. The
full terms of this license are available at https://www.dovepress.com/terms
and incorporate the Creative Commons Attribution
- Non Commercial (unported, 3.0) License.
By accessing the work you hereby accept the Terms. Non-commercial uses of the work are permitted
without any further permission from Dove Medical Press Limited, provided the work is properly
attributed. For permission for commercial use of this work, please see paragraphs 4.2 and 5 of our Terms.
© 2021 The Author(s). This work is published and licensed by Dove Medical Press Limited. The
full terms of this license are available at https://www.dovepress.com/terms
and incorporate the Creative Commons Attribution
- Non Commercial (unported, 3.0) License.
By accessing the work you hereby accept the Terms. Non-commercial uses of the work are permitted
without any further permission from Dove Medical Press Limited, provided the work is properly
attributed. For permission for commercial use of this work, please see paragraphs 4.2 and 5 of our Terms.